A Thesis
Submitted in Partial Fulfillment of the Requirements for the Degree of Sarjana Pendidikan in English Education of the Faculty of Tarbiyah and
Teaching Science of UIN Alauddin Makassar
By
Afdhalulhafiz
Reg. Number: 20400112105
ENGLISH EDUCATION DEPARTEMENT
TARBIYAH AND TEACHING SCIENCE FACULTY
ALAUDDIN ISLAMIC STATE UNIVERSITY
NIM : 20400112105
Tempat/Tanggal Lahir : Ujung Pandang, 14 Juni 1994
Jurusan/Prodi/Konsentrasi : Pendidikan Bahasa Inggris
Fakultas/Program : Tarbiyah dan Keguruan
Alamat : Bumi Pallangga Mas I Blok B2/5
Judul : The Difficulty Level of Local Entrance Test (Ujian
Masuk Mandiri) of UIN Alauddin Makassar
Menyatakan dengan sesungguhnya dan penuh kesadaran bahwa skripsi ini
benar adalah hasil karya sendiri. Jika dikemudian hari terbukti bahwa ia merupakan
duplikat, tiruan, plagiat atau dibuat oleh orang lain, sebagian atau seluruhnya, maka
skripsi dan gelar yang diperoleh karenanya batal demi hukum.
Makassar, 2017
Penyusun
Afdhalulhafiz
Keguruan UIN Alauddin Makassar, setelah meneliti dan mengoreksi secara
seksama skripsi berjudul, “The Difficulty Level of English Local Entrance Test (Ujian Masuk Mandiri) of UIN Alauddin Makassar”, memandang bahwa skripsi tersebut telah memenuhi syarat-syarat ilmiah dan dapat disetujui ke sidang
munaqasyah. Demikian persetujuan ini diberikan untuk diproses lebih lanjut.
Makassar 2017
Pembimbing I Pembimbing II
Alhamdulillahi Robbil Alamin. The researcher praises his highest gratitude
to the almighty Allah swt., who has given His blessing, mercy, health, and
inspiration to complete this thesis. Salam and Shalawat are due to the highly chosen
Prophet Muhammad saw., His families and followers until the end of the world.
Further, the researcher also expresses sincerely unlimited thanks and his
beloved parents (Dr. Haeruddin, M.H – Dra. Zaharnilam) for their affection, prayer, financial, motivation and sacrificed for his success, and their love sincerely
and purely without time. The researcher considers that in carrying out the research
and writing this thesis, many people have also contributed their valuable guidance,
assistance, and advices for his completion of this thesis. They are:
1. Prof. Dr. H. MusafirPababbari, M. Si., as the Rector of Alauddin State
Islamic University of Makassar, who has given a big inspiration for the
researcher.
2. Dr. H. Muhammad Amri, Lc., M. Ag., the Dean of Tarbiyah and Teaching Science Faculty of UIN Alauddin Makassar, who has given motivation for
the researcher.
3. Dr. Kamsinah, M. Pd.I and SittiNurpahmi, S. Pd., M. Pd. as the Head and Secretary of English Education Department of Tarbiyah and Teaching
Science Faculty of UIN Alauddin Makassar, who has given guidance and
during this thesis writing
5. The most profound thanks delivered to all the lectures of English Education
Department and all the staffs of Tarbiyah and Teaching Sciences faculty at
Alauddin State Islamic University of Makassar for their multitude of lesson,
lending a hand, support and guidance during the researcher’s studies. 6. The headmaster and the students of XII A class of MA MadaniAlauddin
who gave their time so willingly to participate in his research.
7. Special thanks to researcher’s beloved classmates in PBI 5-6 and all my friends in PBI 2012 (Invincible) who could not be mentioned here. Thanks
for sincere friendship and assistance during the writing of this thesis
8.
The researcher’s brothers and sisters in New Generation Club (NGC) and KKNP Internasionalthanks for brotherhood and solidarity.9. All of the people around the researcher’s life whom could not mention one by one by researcher who has given a big inspiration, motivation, spirit, for
him.
Gowa, 2017 The researcher,
PERSETUJUAN PEMBIMBING ... iii
B. Problems Statements... 3
C. Research Objectives ... 3
D. Research Significances ... 4
E. Research Scope ... 4
F. Operational Definition of Term ... 5
CHAPTER II REVIEW OF RELATED LITERATURE ... A. Some Previous Research Findings ... 7
B. Some Pertinent Ideas 9
a. Some Basic Concept about the Key Issues .... 9
b. Concept of Item Analysis ... 12
c. Concept of Difficulty Level ... 13
CHAPTER III RESEARCH METHOD ... A. Research Design ... 34
B. Research Setting ... 34
C. Research Variable ... 34
D. Research Subject... 34
E. Research Instrument ... 35
F. Data Collecting Procedure ... 36
G. Data Analysis Technique ... 36
APPENDICES ...
Table 2.3 Maximum Item Difficulty Illustrating Individuals Differences ... 18
Table 2.4 Maximum Item Difficulty Illustrating Individuals Differences ... 19
Table 2.5 Maximum Item Difficulty Illustrating Individuals Differences ... 20
Table 2.6 Positive Item Discrimination Index D ... 23
Table 2.7 Negative Item Discrimination Index D ... 24
Table 3.1 Classification of Difficulty Level ... 37
Table 4.1 Students’ Test Result ... 23
Year : 2016
Researcher : Afdhalulhafiz
Consultant I : Dr. H. WahyuddinNaro, M.Hum Consultant II : Dahniar, S.Pd., M.Pd.
The purpose of this research was to analyze the difficulty level of English
Local Entrance Test (UMM) of UIN Alauddin Makassar 2016 academic year for
each item. This test was designed to test the candidates who were registered as new students in the academic year 2016-2017 at UIN Alauddin Makassar.
The researcher applied the quantitative and qualitative descriptive method. The subject of this research was English items of the Local Entrance Test (UMM) of Alauddin Makassar 2016 academic year designed to test the candidates who were registered as new students in 2016/2017 academic year at UIN Alauddin Makassar. The subject of try out was students of XII MIA I class at Madani Alauddin Senior High School. The test was tried out to the subject of try out then the researcher analyzed the item difficulty level with mentioned method above.
The result of this research found 6 too difficult questions, 3 difficult questions, 16 moderate questions but no easy and very easy questions. Because of that result the test classified as a moderate level test and has a good quality although the result of interviews with students said the test was very difficult.
CHAPTER I
INTRODUCTION
A. Background
Good output is determined by good input. Even though this statement is not
totally true but at least this is one of the rationales why almost all education
institutes conducting admission tests to filter their student candidates. The other
reason might be the amount of the student candidates and the available seat is very
much unbalanced.
Naturally, the test is a written test which consists of general knowledge
questions including English. The test results are used as requirements whether the
student candidates are capable to be the part of the university.
UIN Alauddin Makassar is one of state Islamic universities in Indonesia
applying the system. In 2016, it provides some lanesthat could be used for new
students’ admission. They are SNMPTN, SBMPTN, SPAN PTKIN/SPMB-PTAIN,
UM-PTKIM, UMM, UMK.
Of all the tests mention above, one of the tests examined is designed by UIN
Alauddin Makassar which is applied when there are seats still available. Generally,
the ones who passed through this test located in certain classes based on their
choice.
Based on the preliminary study which conducted by researcher, researcher
found that many students in this department were selected to be students
inappropriately. Many of them cannot totally speak English even only introducing
English to them. Surprisingly, they have been learnt English since they were in
elementary until senior high school.
What the researcher questioning then are does the local entrance test work
well? Is the local entrance test developed well? Can the local entrance test predict
the students who can succeed academically? Is the local entrance test valid and
reliable? Has the local entrance test fulfilled the item facility as well as the item
discrimination? Has the local entrance test been tried out? All the questions stated
previously are still too difficult to be answered because what happening in the class
is still too far from our expectations. If the local entrance test works well, why the
selected students cannot speak English even only understanding what their lecturers
say and introducing themselves. If the test has been developed well why the test
cannot select appropriate students.
Considering the importance of UMM test, it is crucial to know and maintain
the quality of Local Entrance Test (UMM). One of efforts to know and maintain the
quality of a test is by analysing test items. Analysing test items related to the quality
of a test that have been conducted. There are several aspects that can be analyzed
in an item. They are validity, reliability, difficulty level, and item discrimination.
There are some reasons why the researcher chooses Local Entrance Test
(UMM)to be analyzed. First, Local Entrance Test (UMM) is one of determinants in
determining the candidate of new students’ qualification, so we need to measure the
test quality. Second,Local Entrance Test(UMM) test is conducted every year so the
By those considerations, researcher is interested to conduct a research
about“The Difficulty Level of Local Entrance Test (UMM) ofUIN Alauddin
Makassar”. This study uses the copy of English test in Local Entrance Test
(UMM)which is conducted in UIN Alauddin Makassar in 2016. By considering the
population, the researcher conducted the test for the third grade students of Madani
Alauddin Senior High School of Makassar.
B. Problem Statements
Analyzing the difficulty levelof English questions in UMM 2016 test in UIN
Alauddin Makassar is the focus of this research. In order to be able to examine the
problem, the researcher formulates the following research question:
1. What is the difficulty level of English questions of Local Entrance Test
(UMM) of UIN Alauddin Makassar?
2. Does the English questions of Local Entrance Test (UMM) of UIN Alauddin
Makassar has a good quality difficulty level?
C. Research Objective
This research aims to analyze the difficulty level of English question of
Local Entrance Test (UMM) 2016 academic year in UIN Alauddin Makassar which
conducted by researcher in third grade students of Madani Alauddin Senior High
School. The spesific objectives of this research are:
2. “To analyze whether the difficulty level of English question items of Local Entrance Test (UMM) 2016 of UIN Alauddin Makassar qualified as a good
test or not”
D. Research Significance
The findings of this research are to provide significant information about
difficulty level of English questions of Local Entrance Test (UMM) of UIN
Alauddin Makassar, both theoretical and practical significances.
1. Theoretical Significance
The researcher hopes this research can give great contribution to the
other researchers as a reference for further studies on a similar topic.
2. Practical Significance
First, it is expected to give a contribution to future test-maker in the
effort of designing and maintaining a good test as a determinant whether a
candidate of new students are appropriate to continue their study in a
university or not. Second, it is expected to give contribution to measure
students’ ability to answer English questions for teachers and students
themselves.
E. Research Scope
Considering the financial supports and time limits, the researcher decided to
limit the aspect of this research. This research focus on analyzing the difficulty
levelof English test items ofLocal entrance Test 2016/2017 academic year at UIN
Alauddin Makassar. The test was conducted in third grade students of Madani
F. Operational Definition of Term
Local Entrance Test is a selection system to enter UIN Alauddin Makassar
through a written test. The researcher will limit the test based on the time of test
conducting that is the Local Entrance Test (UMM) which conducted in 2016.
a. English Test
According to Brown (2004: 3) a test is a method of measuring person’s ability, knowledge, or performance in a given domain. Thus, test in this research
means a method which consists of multiple choice questions to measure a
candidate of new students’ ability especially in answering English question.
b. Difficulty level or item difficulty
According to Lyle F. Bachman (2004: 151) “Item difficulty is defined
as the proportion of test takers who answered the item correctly, and the
item difficulty index, p, values can be calculated on the basis of test takers
response to the item”.
The percentage is inversely related to the difficulty because the larger
the percentage of correct answer, the easier the item and the more difficult
the item is, the fewer will be the student who select the correct option.
A good test item should have a certain degree of difficulty it may not
too difficult because the tests that are too easy or too difficult will yield
score distribution that make it hard to identify reliable in achievement
between the pupil who have done well and those who have done poorly.
A system/procedure used at UIN Alauddin Makassar at selecting new
students. This test is designed by UIN itself. It is only used at UIN Alauddin
Makassar. In addition, it is especially used only for Local Entrance Test (UMM)
CHAPTER II
LITERATURE REVIEW A. Some Previous Research Finding
The activity of analyzing the English test had been conducted by some
researchers, for instance, at Alauddin State Islamic University. The researcher had
reviewed some findings that strengthened this research and motivated the
researcher to do this research.
Tahmid M (2005: 45) revealed his finding on the “Analysis of the Teacher’s
Multiple Choice English Test for the Students of MAKN Makassar”. He pointed out
that a good test had to be valid and reliable. It should have measured what was
supposed to be measure and has to be consistent in terms of measurement. Both
criteria of an ideal test should be taken into test designing. As the difference,
Tahmid limited his research only on the kind of multiple choice items, while this
research has two kinds of test, namely short-answer test and completion test.
Another important experimental research finding on the analysis of the
teacher made test had been conducted by Saenong (2008) on “Analyzing the Item Feasibility of the English Test used in SMA Negeri 9 Makassar”. She focused only
on the research about the analysis of the test in terms of its feasibility to find out
the index difficulty and the discrimination power of such test. She stated that index
difficulty of a test provided the information about the test whether it was easy or
difficult, and whether it was easy or too hard, for a good item should be neither too
On the other hand, the discrimination power told us whether those students
who performed well on the whole test tended to do well or badly on each item in
the test. Furthermore, we were going to know the item that needs to revise.
Unfortunately, her research was not proper enough to be considered as a test which
has a good quality and could not be surely determined whether or not the test is
valid and reliable to measure what should be measured.
Jusni (2009: 43) reported her research findings on the “Analysis of the English
test items used in SMA Negeri 3 Makassar”. On her research, she found some
invalid items that need to be revised by the teacher. She pointed out that the
information of the analysis result was effective to make further necessary changes
of the weak tests, to adapt them for future use, or to create good test.
However, this kind of research is getting different from her research. Her
research took many things to analyze, namely analysis of validity, reliability, and
feasibility which consists of index difficulty and discrimination power, while this
research was only focused on the difficulty level.
The whole previous researches strongly motivated the researcher in also
conducting the item analysis on difficulty level. As a matter of fact, the three
researchers had outlined the functions of analysis activity. Therefore, the researcher
considered that this kind of research had to be sustainable in the future research.
There were still many schools which did not concern in comprehending and
B. Some Partinent Ideas
a. Some Basic Concept about the Key Issues
Making fair and systematic evaluations of others' performance can be a
challenging task. Judgments cannot be made solely on the basis of intuition,
haphazard guessing, or custom (Sax, 1989). Teachers, employers, and others in
evaluative positions use a variety of tools to assist them in their evaluations.
Tests are tools that are frequently used to facilitate the evaluation process. When
norm-referenced tests are developed for instructional purposes, to assess the
effects of educational programs, or for educational research purposes, it can be
very important to conduct item and test analyses.
Test analysis examines how the test items perform as a set. Item analysis
"investigates the performance of items considered individually either in relation
to some external criterion or in relation to the remaining items on the test"
(Thompson & Levitov, 1985, p. 163). These analyses evaluate the quality of
items and of the test as a whole. Such analyses can also be employed to revise
and improve both items and the test as a whole.
However, some best practices in item and test analysis are too infrequently
used in actual practice. The purpose of the present paper is to summarize the
recommendations for item and test analysis practices, as these are reported in
commonly-used measurement text books (Crocker & Algina, 1986; Gronlund
Cunningham, Thorndike, & Hagen, 1991). These tools include item difficulty,
item discrimination, and item distractors.
This part, the researcher explains about basic terms in language testing,
concept of item analysis and concept of difficulty level.
There are four terms which are often used interchangeably in education
world and sometimes the function of each term is equalized. They are
evaluation, measurement, assessment, and test. However, they are different one
another. Test is only a measurement instrument while measurement is a process
to obtain a score description. On the other hand, assessment and evaluation are
more general than both.
1. Evaluation
On The Government Regulation of Indonesian Republic Number 19
Year 2005 about Education National Standard stated that Evaluation is
process of collecting and tabulating information to measure the students’ study achievement. The information is obtained by giving test. Gronlund
(1985: 5) ascertains that evaluation is systematic process of collecting,
analyzing, and interpreting information to determine how far a student can
reach educational purpose. In line with this point of view, Tuckman (1975:
12) assumes that evaluation is a process to know (test) whether an activity,
activity process, and the whole program have been appropriate with the
purpose or criteria that has been maintained.
In connection with the previous definitions, Longman Advanced
how good, useful, or successful something is. On the other side, Brown
(2004: 3) considers evaluation is similar to test as a way to measure
knowledge, skill, and students’ performance on a given domain. However,
the researcher tries to formulate a definition of evaluation as a final process
of interpreting the value that the students get as a whole.
2. Assessment
Propham (1995: 3) argues that assessment is a formal effort to
determine students’ status related to some educational variations which become the teachers’ attention. On the other hand, Airasian (1991: 3) states
that assessment is process of collecting, interpreting, and synthesis
information to make decision. It means that the assessment is similar to the
definition of evaluation stated by Gronlund.
Related to the description above, assessment as a process by which
information is obtained relative to some known objectives or goals (Kizlik,
2009). From the views above, the researcher considers assessment is
somewhat similar to evaluation as the process of judgment of person or
situation.
3. Measurement
Tuckman (1975: 12) asserts that measurement is only a part of
evaluation tool and it is always related to quantitative data, such us students’
scores. Contrary, Gronlund (1985: 5) highlights that measurement is a
the process by which the attributes or dimensions of some physical object
are determined (Kizlik, 2009). From this definition, the term “measure”
seems to be in the use of determining the IQ of a person. Based on all the
previous definitions of measurement, the researcher underlines that
measurement are some ways to obtain quantitative data in connection with
numeral or students’ scores.
4. Test
Test is a very basic and important instrument to conduct the activity of
measurement, assessment, and evaluation. Joni (1984: 8) concludes that test
is one of educational measurement tools that gathering with another
measurement tools create quantitative information used in arranging
evaluation.
Gronlund (1985: 5) convey that test is an instrument or systematic
procedure to measure a behavior sample. In line with this, Goldenson (1984:
742) points out that test is a standard set of question or other criteria
designed to assess knowledge, skills, interests, or other characteristics of a
subject. However, not all the questions can be defined as a test. There are
some requirements that must be fulfilled to be considered as the test. After
comprehending the experts’ definitions above, the researcher takes a blue
print that test is a group of questions designed to measure skills, knowledge
or capability by considering certain steps before using the test.
As explained previously, the four main items of the key issues above
basically have the same goal which in this case to know the quality of what or
who is being measured. One way to find out the data is by using test. Hence,
before applying a test, the teachers should comprehend how to design a good
test.
Suryabarata (1984: 85) conveys that a test has to have several qualities. The
qualities are the validity and the reliability. If researchers’ interpretations of data are valuable, the measuring instruments used to collect those data must be both
valid and reliable (Gay, at all. 2006: 134). Therefore, after designing a test, the
teachers should execute item analysis to classify and to determine whether the
item is valid and reliable or not.
According to Nurgiyantoro (2010: 190), item analysis is quality estimation
of each item of a test tool to examine or to try the effectiveness of each item. A
good test tool is supported by good, effective, and accountable items. Item
analysis is coherence analysis between scores of each item with the whole
scores, compares the students answer on one test item with the answer of the
whole test. The purpose of analyzing test item is to make each item is consistent
with the whole test (Tuckman, 1975: 271), to evaluate the test as a measurement
tool, because if the test is not examined, the effectiveness of the measurement
cannot be determined satisfactorily (Noll, 1979:207).
Item difficulty is simply the percentage of students taking the test who
answered the item correctly. The larger the percentage getting an item right, the
to be (Wood, 1960). To compute the item difficulty, divide the number of people
answering the item correctly by the total number of people answering item. The
proportion for the item is usually denoted as p and is called item difficulty
(Crocker & Algina, 1986). An item answered correctly by 85% of the examinees
would have an item difficulty, or p value, of .85, whereas an item answered
correctly by 50% of the examinees would have a lower item difficulty,
or p value, of .50.
A p value is basically a behavioral measure. Rather than defining difficulty
in terms of some intrinsic characteristic of the item, difficulty is defined in terms
of the relative frequency with which those taking the test choose the correct
response (Thorndike et al, 1991). For instance, in the example below, which
item is more difficult?
1. Who was Boliver Scagnasty?
2. Who was Martin Luther King?
One cannot determine which item is more difficult simply by reading the
questions. One can recognize the name in the second question more readily than
that in the first. But saying that the first question is more difficult than the
second, simply because the name in the second question is easily recognized,
would be to compute the difficulty of the item using an intrinsic characteristic.
This method determines the difficulty of the item in a much more subjective
Another implication of a p value is that the difficulty is a characteristic of
both the item and the sample taking the test. For example, an English test item
that is very difficult for an elementary student will be very easy for a high school
student. A p value also provides a common measure of the difficulty of test
items that measure completely different domains. It is very difficult to
determine whether answering a history question involves knowledge that is
more obscure, complex, or specialized than that needed to answer a math
problem. When p values are used to define difficulty, it is very simple to
determine whether an item on a history test is more difficult than a specific item
on a math test taken by the same group of students.
To make this more concrete, take into consideration the following examples.
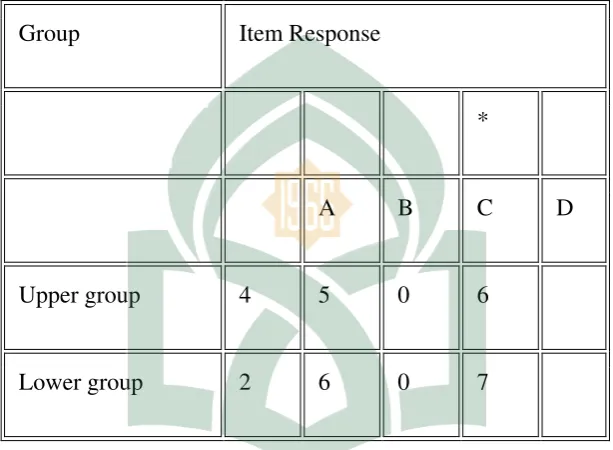
When the correct answer is not chosen (p = 0), there are no individual
differences in the "score" on that item. As shown in Table 1, the correct answer
C was not chosen by either the upper group or the lower group. (The upper
group and lower group will be explained later.) The same is true when everyone
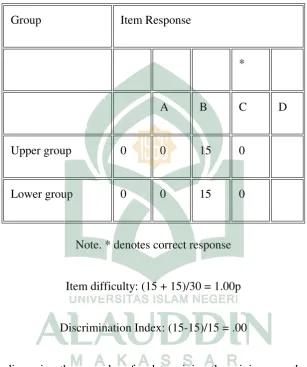
taking the test chooses the correct response as is seen in Table 2. An item with
a p value of .0 or a p value of 1.0 does not contribute to measuring individual
differences, and this is almost certain to be useless. Item difficulty has a
profound effect on both the variability of test scores and the precision with
which test scores discriminate among different groups of examinees (Thorndike
et al, 1991). When all of the test items are extremely difficult, the great majority
scores will be extremely high. In either case, test scores will show very little
variability. Thus, extreme p values directly restrict the variability of test scores.
Table 2.1.
Minimum Item Difficulty Example Illustrating No Individual Differences
Group Item Response
*
A B C D
Upper group 4 5 0 6
Lower group 2 6 0 7
Note. * denotes correct response
Item difficulty: (0 + 0)/30 = .00p
Table 2.2.
Maximum Item Difficulty Example Illustrating No Individual
Differences
Group Item Response
*
A B C D
Upper group 0 0 15 0
Lower group 0 0 15 0
Note. * denotes correct response
Item difficulty: (15 + 15)/30 = 1.00p
Discrimination Index: (15-15)/15 = .00
In discussing the procedure for determining the minimum and maximum
score on a test, Thompson and Levitov (1985) stated that “items tend to improve test reliability when the percentage of students who correctly answer the item is
halfway between the percentage expected to correctly answer if pure guessing
governed responses and the percentage (100%) who would correctly answer if
For example, many teachers may think that the minimum score on a test
consisting of 100 items with four alternatives each is 0, when in actuality the
theoretical floor on such a test is 25. This is the score that would be most likely
if a student answered every item by guessing (e.g., without even being given
the test booklet containing the items).
Similarly, the ideal percentage of correct answers on a four-choice
multiple-choice test is not 70-90%. According to Thompson and Levitov (1985), the ideal
difficulty for such an item would be halfway between the percentage of pure
guess (25%) and 100%, (25% + {(100% - 25%)/2}.
Therefore, for a test with 100 items with four alternatives each, the ideal
mean percentage of correct items, for the purpose of maximizing score
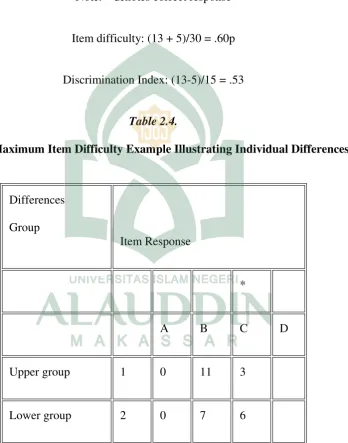
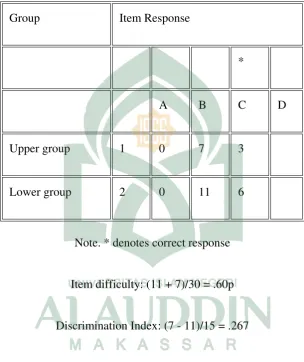
reliability, is roughly 63%. Table 3, 4, and 5 show examples of items with p
values of roughly 63%.
Table 2.3.
Maximum Item Difficulty Example Illustrating Individual Differences
Group Item Response
*
Upper group 1 0 13 3
Lower group 2 5 5 6
Note. * denotes correct response
Item difficulty: (13 + 5)/30 = .60p
Discrimination Index: (13-5)/15 = .53
Table 2.4.
Maximum Item Difficulty Example Illustrating Individual Differences
Differences
Group
Item Response
*
A B C D
Upper group 1 0 11 3
Lower group 2 0 7 6
Note. * denotes correct response
Discrimination Index: (11-7)/15 = .267
Table 2.5.
Maximum Item Difficulty Example Illustrating Individual Differences
Group Item Response
*
A B C D
Upper group 1 0 7 3
Lower group 2 0 11 6
Note. * denotes correct response
Item difficulty: (11 + 7)/30 = .60p
Discrimination Index: (7 - 11)/15 = .267
1. Item Discrimination
If the test and a single item measure the same thing, one would expect
people who do well on the test to answer that item correctly, and those
who do poorly to answer the item incorrectly. A good item discriminates
indices can be computed to determine the discriminating power of an
item, the item discrimination index, D, and discrimination coefficients.
2. Item Discrimination Index, D
The method of extreme groups can be applied to compute a very
simple measure of the discriminating power of a test item. If a test is
given to a large group of people, the discriminating power of an item can
be measured by comparing the number of people with high test scores
who answered that item correctly with the number of people with low
scores who answered the same item correctly. If a particular item is doing
a good job of discriminating between those who score high and those
who score low, more people in the top-scoring group will have answered
the item correctly.
In computing the discrimination index, D, first score each student's
test and rank order the test scores. Next, the 27% of the students at the
top and the 27% at the bottom are separated for the analysis. Wiersma
and Jurs (1990) stated that "27% is used because it has shown that this
value will maximize differences in normal distributions while providing
enough cases for analysis" (p. 145). There need to be as many students
as possible in each group to promote stability, at the same time it is
desirable to have the two groups be as different as possible to make the
the use of 27% maximizes these two characteristics. Nunnally (1972)
suggested using 25%.
The discrimination index, D, is the number of people in the upper
group who answered the item correctly minus the number of people in
the lower group who answered the item correctly, divided by the number
of people in the largest of the two groups. Wood (1960) stated that “when more students in the lower group than in the upper group select the right
answer to an item, the item actually has negative validity. Assuming that
the criterion itself has validity, the item is not only useless but is actually
serving to decrease the validity of the test (p. 87)”.
The higher the discrimination index, the better the item because such
a value indicates that the item discriminates in favor of the upper group,
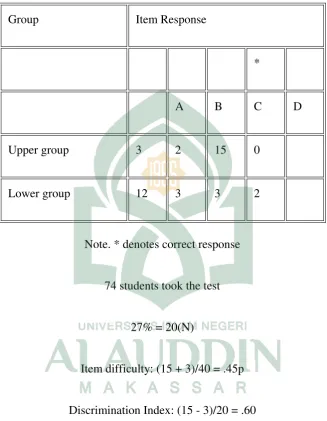
which should get more items correct, as shown in Table 6. An item that
everyone gets correct or that everyone gets incorrect, as shown in Tables
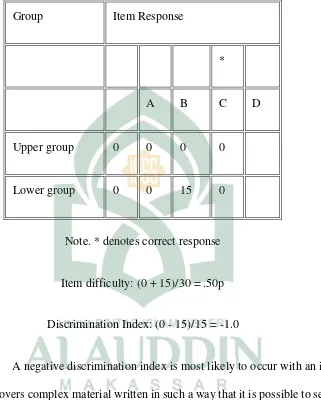
1 and 2, will have a discrimination index equal to zero. Table 7 illustrates
that if more students in the lower group get an item correct than in the
upper group, the item will have a negative D value and is probably
Table 2.6.
Positive Item Discrimination Index D
Group Item Response
*
A B C D
Upper group 3 2 15 0
Lower group 12 3 3 2
Note. * denotes correct response
74 students took the test
27% = 20(N)
Item difficulty: (15 + 3)/40 = .45p
Table 2.7.
Negative Item Discrimination Index D
Group Item Response
*
A B C D
Upper group 0 0 0 0
Lower group 0 0 15 0
Note. * denotes correct response
Item difficulty: (0 + 15)/30 = .50p
Discrimination Index: (0 - 15)/15 = -1.0
A negative discrimination index is most likely to occur with an item
covers complex material written in such a way that it is possible to select
the correct response without any real understanding of what is being
assessed. A poor student may make a guess, select that response, and
come up with the correct answer. Good students may be suspicious of a
question that looks too easy, may take the harder path to solving the
problem, read too much into the question, and may end up being less
discrimination index, .40 and greater are very good items, .30 to .39 are
reasonably good but possibly subject to improvement, .20 to .29 are
marginal items and need some revision, below .19 are considered poor
items and need major revision or should be eliminated (Ebel & Frisbie,
1986).
3. Discrimination Coefficients
Two indicators of the item's discrimination effectiveness are point
biserial correlation and biserial correlation coefficient. The choice of
correlation depends upon what kind of question we want to answer. The
advantage of using discrimination coefficients over the discrimination
index (D) is that every person taking the test is used to compute the
discrimination coefficients and only 54% (27% upper + 27% lower) are
used to compute the discrimination index, D.
The point biserial (rpbis) correlation is used to find out if the right
people are getting the items right, and how much predictive power the
item has and how it would contribute to predictions. Henrysson (1971)
suggests that the rpbis tells more about the predictive validity of the total
test than does the biserial r, in that it tends to favor items of average
difficulty. It is further suggested that the rpbis is a combined measure of
Biserial correlation coefficients (rbis) are computed to determine
whether the attribute or attributes measured by the criterion are also
measured by the item and the extent to which the item measures them.
The rbis gives an estimate of the well-known Pearson product-moment
correlation between the criterion score and the hypothesized item
continuum when the item is dichotomized into right and wrong
(Henrysson, 1971). Ebel and Frisbie (1986) state that the rbis simply
describes the relationship between scores on a test item (e.g., "0" or "1")
and scores (e.g., "0", "1","50") on the total test for all examinees.
4. Distractors
Analyzing the distractors (e.i., incorrect alternatives) is useful in
determining the relative usefulness of the decoys in each item. Items
should be modified if students consistently fail to select certain multiple
choice alternatives. The alternatives are probably totally implausible and
therefore of little use as decoys in multiple choice items. A discrimination
index or discrimination coefficient should be obtained for each option in
order to determine each distractor's usefulness (Millman & Greene,
1993). Whereas the discrimination value of the correct answer should be
positive, the discrimination values for the distractors should be lower
and, preferably, negative. Distractors should be carefully examined when
items show large positive D values. When one or more of the distractors
of the correct response depends on some extremely subtle point, it is
possible that examinees will be penalized for partial knowledge.
Thompson and Levitov (1985) suggested computing reliability
estimates for a test scores to determine an item's usefulness to the test as
a whole. The authors stated, "The total test reliability is reported first and
then each item is removed from the test and the reliability for the test less
that item is calculated" (Thompson & Levitov, 1985, p.167). From this
the test developer deletes the indicated items so that the test scores have
the greatest possible reliability.
c. Concept of Difficulty level
According to PAN (Patokan Acuan Normal) (Cited in Ruseffendi
1998:160-161), a good test is a test that has moderate level of difficulty level because the
test can provide information about the big difference amongst the student.
1. On varying the difficulty of test items
Someone by the name of Stenner once said, “If you don’t know why
this question is harder than that one, then you don’t know what you are measuring” (cited in Fisher-Hoch & Hughes, 1996). This statement puts into focus the role of item difficulty in educational measurement. While
it is very often in testing agencies worldwide that item researchers are
reminded to write test items to measure the construct that they are
measuring, it is less often that item researchers are advised to think about
There is a host of construct validation procedures (see Sireci, 1998) to
aid item researchers in ensuring that test items measure the construct they
are intended to measure; but there are only a few documents (e.g., Pollitt,
Hutchinson, Entwistle, & De Luca, 1985; Fisher-Hoch, Hughes, &
Bramley, 1997; Ahmed & Pollitt, 1999) on how to vary the difficulty of
test items that item researchers may refer to. This paper aims to add to
the literature on how the difficulty of test items may be varied and to
generate discussion among practitioners on the appropriate practices in
controlling the difficulty of test items.
2. The need to control difficulty in an item
Besides contributing to the measurement of the construct that item
researchers want to measure, there are other rationales for controlling the
difficulty of items. First, in some achievement testing circumstances,
there is a need to spread candidates over a wide range of marks. Test
items of a wide range of difficulty levels are needed to test the entire
range of candidates’ achievement levels. Tests that contain too many easy
or too many difficult test items of would result in skewed mark
distributions. Second, in situations where there is a need to construct
parallel tests (e.g., to maintain the rigour and standards of assessment
from year to year), the ability to vary the difficulty of test items is crucial.
The distribution of item difficulty levels in one year should be
comparable to the distribution of item difficulty levels in another, among
items of unsuitable difficulty levels is a waste of time and effort. Test
items must be set at suitable difficulty levels so that the results of
pilot-tests can be used to confirm their difficulty level. Fourth, in assessments
where choices from optional items are offered to candidates, there is a
responsibility for item researchers to ensure that the items are of
comparable difficulty. It is only when the optional items are of
comparable difficulty that the test results may be reliable.
3. Locations of difficulty in a test item
Ahmed and Pollitt (1999) have suggested that the difficulty of a test
item is in the question-answering process. In their paper, they list
“sources of difficulty” in the five stages of the question-answering
process (namely, learning, reading the question, searching the subject
knowledge, matching the question and subject models, generating the
answer, and writing the answer). Is there another way of thinking about
the locations of difficulty in a test item? In other words, is there a way of
thinking about difficulty that does not require a psychological
understanding of the question-answering process? We can begin with the
definition of a test item in Osterlind (1990).
“A test item in an examination of mental attributes is a unit of
measurement with a stimulus and a prescriptive form of answering; and
is intended to yield a response from an examinee from which
performance in some psychological construct (such as knowledge,
An analysis of Osterlind’s definition of a test item suggests there are
four locations in an item where difficulty may reside. These are: (1)
content assessed; (2) stimulus; (3) task to be performed; (4) expected
response. I shall refer to the difficulty in the four locations as content
difficulty, stimulus difficulty, task difficulty and expected response
difficulty. Content difficulty refers to the difficulty in the subject matter
assessed. In the assessment of knowledge, the difficulty of a test item
resides in the various elements of knowledge such as facts, concepts,
principles and procedures. These knowledge elements may be basic,
appropriate or advanced. Basic knowledge elements are those in which
candidates have learnt at lower levels. They are very likely to be familiar
to candidates because they would have the opportunity to learn them
well, and they are not likely to pose difficulty to many candidates.
Advanced knowledge elements are usually those that will be covered
more adequately at advanced levels and hence are peripheral to the core
curriculum, and candidates may not have sufficient opportunity to learn.
These knowledge elements are likely to be difficult for most of the
candidates. Knowledge elements at the appropriate level are those that
are central to the core curriculum. Depending on the level of
preparedness of the candidates, these knowledge elements may be easy
or difficult to candidates; overall, items that test knowledge elements at
the appropriate level may be moderately difficult to candidates. Content
elements assessed. Generally, the difficulty of an item increases with the
number of knowledge elements assessed. Test items that assess
candidates on two or more knowledge elements are generally more
difficult than test items that assess candidates on a single knowledge
element. The difficulty of a test item may be further increased by
assessing candidates on a combination of knowledge elements that are
seldom combined (Ahmed, Pollitt, Crisp, & Sweiry, 2003).
Stimulus difficulty refers to the difficulty that candidates face when
they attempt to comprehend the words and phrases in a test item and the
information that accompanies the item (e.g., diagrams, tables and
graphs). Test items that contain words and phrases that require only
simple and straightforward comprehension are usually easier than those
that require careful or technical comprehension. The manner in which
information is packed in a test item also affects the difficulty level of the
test item. Test items that contain information that is tailored to an
expected response (i.e., no irrelevant information in the test item) are
generally easier than test items that require candidates to select relevant
information or unpack a large amount of information.
Task difficulty refers to the difficulty that candidates face when they
generate a response or formulate an answer. In most test items, to
generate a response, candidates have to work through the steps of a
solution. Generally, test items that require more steps in a solution are
task difficulty of a test item may be mediated by the amount of guidance
present. Test items that contain guided steps are generally easier than
those that require candidates to devise the steps. The task difficulty of a
test item may also be affected by the order of thinking or cognitive
processing required. Taxonomies of cognitive processes, in particular the
Bloom’s Taxonomy, have suggested that cognitive processes exist in a
cumulative hierarchy (i.e., the more complex processes include the
simpler processes). Thus test items that assess candidates on higher order
processes (e.g., analysis and synthesis) may generally be more difficult
than test items that assess candidates on lower order processes (e.g.,
recall and comprehension). Similarly, in the assessment of skills, test
items that assess candidates in higher order skills such as application and
improvisation are generally more difficult than test items that assess
candidates in lower order skills such as imitation and patterning.
Expected response difficulty refers to the difficulty imposed by
examiners in a mark scheme or scoring rubrics. This location of difficulty
in a test item is applicable only to constructed-response items; it is not
applicable to selected-response (e.g., multiple-choice, true-false and
matching). When examiners expect few or no details in a response to a
test item, the test item is generally easier than a test item in which
examiners expect a lot of details. Another aspect of expected response
difficulty is the complexity in structure of an expected response. When
is generally easier than a test item in which the significance of the
relations between the parts and the whole is expected to be discussed in
a response. In other words, a test item in which a uninstructural response
is expected generally easier than a test item in which relational response
expected. A third aspect of expected response difficulty is in the clarity
of marks allocation. Test items in which the allocation of marks is
straight-forward or logical (e.g., 3 marks for listing 3 points) are
generally easier than test items in which the mark allocation is unclear
(e.g., 20 marks for a discussion of a concept, without any hint of how
much and what to write in a response). This aspect of expected response
difficulty affects the difficulty of an item because candidates who are
unclear about the demand in a response may not produce sufficient
amount of answers in a response that will earn the marks that befit their
CHAPTER III
RESEARCH METHOD A. Research Design
The researcher will apply quantitative and qualitative descriptive method. It will
describe the difficulty level of the items of the English Local Entrance Test (UMM)
of UIN Alauddin Makassar.
B. Research Setting a. Location
This research was located in Madani Alauddin Senior High School on Jalan
Bontotangnga, Kel. Paccinongan, Kec. Somba Opu, Kab. Gowa, Sulawesi
Selatan.
b. Time
This research was implemented on August until September 2017
C. Research Variable
The independent variable of the research is English Local Entrance Test (UMM)
items of UIN Alauddin Makassar 2016-2017 academic year and the dependent
variable of this research is difficulty level as the extent to measure the difficulty
quality of English test.
D. Research Subject
The subject of this research is English Local Entrance Test (UMM) of Alauddin
Makassar items used to test the students who were registered as students in the
2016-2017 academic year at UIN Alauddin Makassar. The subject of the try out
school that has cooperation and also the school library of UIN Alauddin Makassar
where the students of Tarbiyah and Teaching Science Faculty do their practice.
E. Research Instrument
To collect data researcher will need some instruments. They are the criteria of difficulty level interval, question test paper, answer sheet, the answer key and interview. The explanation of these instrumen can be seen as follow:
1. Criteria of difficulty level interval
It will be used to identifythe difficulty level of English test item of Local Entrance Test. The researcher will examine test-items and analyze them whether they have fulfilled the characteristics of a good test or not. With this instrument, the researcher got the qualitative data to answer the problem statement number 2.
2. Question test paper
It consists of reading comprehension, modals, connector or conjunction, tenses and subject and verb agreement. 10 questions deal with reading comprehension, 5 questions deal with tenses, 3 question deal with modals, 2 questions deal with connector and 5 questions deal with subject and verb agreement with total 25 number.
3. Answer sheets
This answer sheets will be used used to know the answer distribution. They will be analyzed in order to find out their difficulty level to answer the problem statement number 1.
4. Interview
This interview will be used as a reinforcement of students’ test
F. Data Collecting Procedure
To obtain data needed in this study, the researcher carried out some procedures.
First, researcher collected all items of the English local admission test designed by
UIN Alauddin Makassar in the academic year of 2016-2017. Second, researcher
distributed the tests and the answer sheets to the students. Third, the researcher
submitted the questions and answer sheets after the questions answered by students.
Fourth, researcher interviewed some students after answered the given question.
Fifth, researcher analyzed and wrote the result of the test and the interview.
G. Data Analysis Technique
To accomplish this data analysis, the researcher applied the quantitative
descriptive analysis to analyze the result of the test and qualitative descriptive
analysis to analyze the result of the test and interview. The researcher analyzed and
processed the data by using the following formulas to find the difficulty level.
a. Quantitative Analysis
P=NP/N
P= Indeks of difficulty level
NP= Number of test-takers answering correctly
N= Number of test-takers responding to that item.
(Athiyah Salwa, 2012) b. Qualitative Analysis
To answer the problem statement number 2, qualitative data analysis was
analyzed by using:
1. Test result to classify the interval of difficulty level, the researcher will use classification of level difficulty. Score of P can be ranged from
0-1. If P is 0.00 it means there are no students who can answer the item
test correctly. These items belong to very difficult one. And if P is 1,it
means that all the students can answer the item correctly. These items
belong to very easy item.
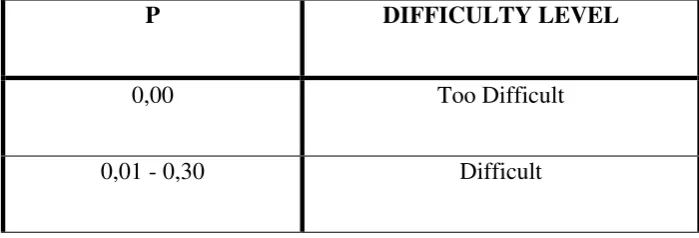
To make clear the researcher will give the range of difficulty
level range as follow(Athiyah Salwa, 2012):
Table 3.1. Classification of Difficulty Level
P DIFFICULTY LEVEL
0,00 Too Difficult
0,31 - 0,70 Moderate
0,71 - 0,90 Easy
0,91 - 1,00 Too Easy
CHAPTER IV
FINDINGS AND DISCUSSION
In this chapter, the researcher presents two parts that will be discussed. Those
two part deal with the research findings and discussions about what have been
discovered by the researcher. The findings and the discussions are related to the
difficulty level of local entrance test which made by UIN Alauddin Makassar
2016/2017 academic year.
A. Findings
As stated in the previous chapters, this research was held in Madani Alauddin
Senior High School which consists of four stages they are observation, test
examination, interview and data processing.
Observation was implemented to decide the sample and to make sure that the
students were available for the interview and test examination. From the
observation it was found that there are two classes which fulfill requirements for
the interview and examination test. They are XII MIA 1 and XII MIA II. However,
the researcher only took one class namely XII MIA 1 which consist of 22 students.
The test and interview was administered on August 26th 2017. The test presented
25 questions in the form of multiple choices. 10 questions deal with reading
comprehension, 5 questions deal with tenses, 3 question deal with modals, 2
questions deal with connector and 5 questions deal with subject and verb agreement.
Each item has the same maximum score namely 1 point while the interview deals
1). Quantitative Analysis
This data is used to answer the problem statement number 1, quantitative
data analysis was analyzed manually. This analysis shows students’ score after finished the test and the items’ difficulty level based on students’ score.
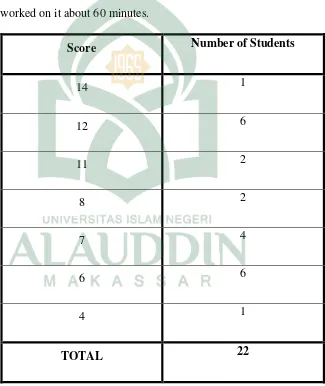
Table 4.1. Students’ Test Result
This table shows the students’ result after finished the test after
worked on it about 60 minutes.
Score Number of Students
14 1
12 6
11 2
8 2
7 4
6 6
4 1
TOTAL 22
The result of the test showed that from 22 students, there was
points in contrast the lowest score was 4. Only 7 students got score
more than 50%, and the rest is below 50%. It means there was no
student should pass the test if the standard of minimal mastery
criteria (KKM) was 75%.
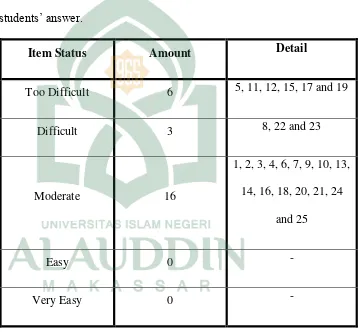
Table 4.2. Items’ Difficulty Level
This table shows the items’ difficulty level based on the students’ answer.
Item Status Amount Detail
Too Difficult 6 5, 11, 12, 15, 17 and 19
Difficult 3 8, 22 and 23
Moderate 16
1, 2, 3, 4, 6, 7, 9, 10, 13,
14, 16, 18, 20, 21, 24
and 25
Easy 0 -
Very Easy 0 -
2. Qualitative Analysis
This analysis separate in 2 parts, the first part is test difficulty status
quantitative analysis while interview result shows the result from
interview between the researcher and chosen students.
a. Test difficulty status
Based on the researcher’s statistical calculation, the data of the
result test above, there were 6 too difficult items of the test namely
5, 11, 12, 15, 17 and 19. There were 3 difficult items of the test
namely 8, 22 and 23. There were 16 moderate items namely 1, 2, 3,
4, 6, 7, 9, 10, 13, 14, 16, 18, 20, 21, 24 and 25 and there were 0 easy
and very easy items.
b. Interview Result
The researcher did the interview 15 minutes after all of students in XII
MIA 1 finished the test. Then researcher interviewed 10 students to answer
10 questions. Based on the researcher’s interview with 10 students, all of
them said that the test was very difficult. They also said that the most
difficult number was number 19 because it was a reading part and it was
proved by test result there were no students who got right answer. In contrast
the said that the easiest number was number 4 and the result of the test also
proved it with 12 students got right answer on it.
6 of 10 interviewed students had no specific strategy to answer the
questions and the rest said that they only looked for the easiest question to
answer. Adjectives and adverbs are the most difficult word classes to
understand they said. Most of students who got interviewed by the
B. Discussion
This part contains the interpretation of the findings derived from the previous
qualitative and quantitative analysis.
Based on the findings, the result of the existing data of test reported that 6
questions were classified too difficult, 3 questions were classified difficult and 16
questions were classified in moderate level. There was no student got 75% right
answer in test which means the test was very difficult to the students. It is inversely
when viewed from number of questions (16) classified in moderate level. Interview
session between researcher and students also reported that the test was very difficult
as a strengthening to result of the test. Despite the opposite result between students’ test and interview with the result of item test analysis, the test still classified as a
moderate level based on the number of items that was classified as moderate level.
According to PAN (Patokan Acuan Normal) (Cited in Ruseffendi 1998:
160-161), a good test is a test that has moderate level because the test can provide
information about the big difference amongst the student. Even the test was
classified as a good test, the students were still failed to pass the test.
Due to the result above there are several factors why all of students failed on
the test. First, the knowledge or the ability of each subject in English is in average
level. Based on researcher interview with the English teacher and the student,
student ability was classified in average level, it could be proved by the student
scores in English class. Second, the quality of the English standard, as a new school
Madani Alauddin Senior High School does not have a high standard of English.
language laboratory to improve their English Standard. Third, because of the second
factor, the students do not have adequate experience in English. So, if the students
face an English test they will have many troubles to pass the test like result that is
shown in this thesis.
Besides mentioned factors above, there are some other causes that can influence
the result of the test. Those are the test vocabulary quality, students’ condition while
doing test, the students face a type of question that have never been given by their
English teacher, and the test maker made a too high standard question on the test.
Similar to the findings of Noveria (2015: 34) in her thesis, a number of factors
can influence the result of tests and instruments used in research: 1) unclear
directions; 2) confusing and ambiguous item test; 3) using too difficult vocabulary
for test takers; 4) using too difficult and complex sentence structures; 5) inconsistent
and subjective scoring methods; 6) untaught items on achievement tests; 7) failure
to follow standardized of test administration procedure and 8) cheating, either by
CHAPTER V
CONCLUSIONS AND SUGGESTION
This chapter contains two parts. The first part concludes the findings and the
discussion from previous chapter and the second part deals with some suggestions.
A.Conclusions
Based on the result of the researcher findings and discussion on the previous
chapter, the researcher comes to conclusions as follow:
1. The difficulty level of English questions of Local Entrance Test (UMM) of
UIN Alauddin Makassar is in the moderate level. The researcher revealed
that the test has 6 questions were classified into too difficult level, 3 questions
classified into difficult level and 16 questions classified into moderate level.
2. The English questions of Local Entrance Test (UMM) of UIN Alauddin
Makassar has a good quality difficulty level because the test has about 65%
(16) questions classified into moderate level.
B.Suggestions
Concerning with the result of this research, the researcher would like to give
some following suggestions:
1. To make the test becomes better the future test maker of UIN Alauddin
Makassar’s Local Entrance Test (UMM) needs to change some moderate
question to easy question. Because there was no question on the Local
Entrance Test (UMM) of UIN Alauddin Makassar classified as easy question,
2. Before applying the test to the candidates, it would be better if the
test-maker(s) tested the test several times.
3. Future test-maker(s) should make a different English test for prospective
students who want to take general majors than those who want to major in
English education or English literature.
4. In addition to making tests based on the need of University, the test-maker(s)
BIBLIOGRAPHY
Ahmed, A., & Pollitt, A.: Curriculum demands and question difficulty. Paper presented at IAEA Conference, Slovenia, 2003.
Ahmed, A, Pollitt, A., Crisp, V., & Sweiry, E.:Writing examinations questions. A course created by the Research & Evaluation Division, University of Cambridge Local Examinations Syndicate, 2003.
Airasian, P. W. Classroom Asessment. New York: Mcgraw-Hill, 1991.
Arikunto, S. Dasar-dasar Pemikiran Pendidikan. Jakarta: BumiAksara, 2003.
---. ProsedurPenelitian; Suatu Pendekatan Praktik. Edisi Revisi; Jakarta: PT. RinekaCipta, 2006.
Brown, H. D. Language Assessment, Principles and Classroom Practices. San Fransisco: Longman, 2004.
Crocker, L., & Algina, J. Introduction to classical and modern test theory. New York: Holt, Rinehart and Winston, 1986.
Ebel, R.L., & Frisbie, D.A. Essentials of educational measurement. Englewood Cliffs, NJ: Prentice-Hall, 1986.
Fisher-Hoch, H., & Hughes, S.: What makes mathematics exam questions difficult?
Paper presented at the British Educational Research Association Annual Conference, Lancaster University, 1996.
Fisher-Hoch, H., Hughes, S., & Bramley, T.: What makes GCSE examination questions difficult? Outcomes of manipulating difficulty of GCSE questions. Paper presented at the British Educational Research Annual Conference, University of York, 1997.
Fulcher, G. Practical Language Testing. London: HodderEducation, 2010.
Fulcher, G and Fred, D. Language Testing and Assessment: An Advanced Resource
Book. Oxon: Routledge. 2007.
Gay, R.L. Educational Research; Competencies for Analysis & Application. Second Edition; USA: Charles E. Merril Publishing Company, 1981