INTERNET, PHONE, MAIL,
AND MIXED-MODE
INTERNET, PHONE, MAIL,
AND MIXED-MODE
SURVEYS
The Tailored Design Method
Cover design: Wiley
Cover image: © iStockphoto/khalus
Copyright © 2014 by John Wiley & Sons, Inc. All rights reserved.
Published by John Wiley & Sons, Inc., Hoboken, New Jersey. Published simultaneously in Canada.
No part of this publication may be reproduced, stored in a retrieval system, or transmitted in any form or by any means, electronic, mechanical, photocopying, recording, scanning, or otherwise, except as permitted under Section 107 or 108 of the 1976 United States Copyright Act, without either the prior written permission of the Publisher, or authorization through payment of the appropriate per-copy fee to the Copyright Clearance Center, Inc., 222 Rosewood Drive, Danvers, MA 01923, (978) 750-8400, fax (978) 646-8600, or on the web at www.copyright.com. Requests to the Publisher for permission should be addressed to the Permissions Department, John Wiley & Sons, Inc., 111 River Street, Hoboken, NJ 07030, (201) 748-6011, fax (201) 748-6008.
Limit of Liability/Disclaimer of Warranty: While the publisher and author have used their best efforts in preparing this book, they make no representations or warranties with respect to the accuracy or completeness of the contents of this book and specifically disclaim any implied warranties of merchantability or fitness for a particular purpose. No warranty may be created or extended by sales representatives or written sales materials. The advice and strategies contained herein may not be suitable for your situation. You should consult with a professional where appropriate. Neither the publisher nor author shall be liable for any loss of profit or any other commercial damages, including but not limited to special, incidental, consequential, or other damages.
This publication is designed to provide accurate and authoritative information in regard to the subject matter covered. It is sold with the understanding that the publisher is not engaged in rendering professional services. If legal, accounting, medical, psychological or any other expert assistance is required, the services of a competent professional person should be sought.
Designations used by companies to distinguish their products are often claimed as trademarks. In all instances where John Wiley & Sons, Inc. is aware of a claim, the product names appear in initial capital or all capital letters. Readers, however, should contact the appropriate companies for more complete information regarding trademarks and registration.
For general information on our other products and services please contact our Customer Care Department within the United States at (800) 762-2974, outside the United States at (317) 572-3993 or fax (317) 572-4002.
Wiley publishes in a variety of print and electronic formats and by print-on-demand. Some material included with standard print versions of this book may not be included in e-books or in print-on-demand. If this book refers to media such as a CD or DVD that is not included in the version you purchased, you may download this material at http://booksupport.wiley.com. For more information about Wiley products, visit www.wiley.com.
ISBN: 978-1-118-45614-9 (cloth) ISBN: 978-1-118-92129-6 (ebk) ISBN: 978-1-118-92130-2 (ebk)
Printed in the United States of America
John Tarnai (1947–2012)
For his leadership of the Social and Economic Sciences Research Center
at Washington State University, the laboratory for our collaborative
efforts to develop and test the methods described in this book
.
Janet Harkness (1948–2012)
For encouraging the further development of these methods
as Director of the Survey Research and Methodology (SRAM) Program
Contents
Additional Resources
xi
Preface
xiii
Chapter 1 Sample Surveys in Our Electronic World
1
Four Cornerstones of Quality Surveys
3
What Is Different About Surveying in the 2010s?
10
Why Emphasize Mixed-Mode Data Collection?
12
What Is Tailored Design and Why Is It Needed?
15
Conclusion
17
Chapter 2 Reducing People’s Reluctance to Respond to Surveys
19
Example of a Survey With a High Response Rate
21
Using Social Exchange Concepts to Motivate
Potential Respondents
23
Putting the Parts Together: Some Guidelines
for Applying Social Exchange
42
Mixed-Mode Designs Provide New Opportunities
for Applying Social Exchange
47
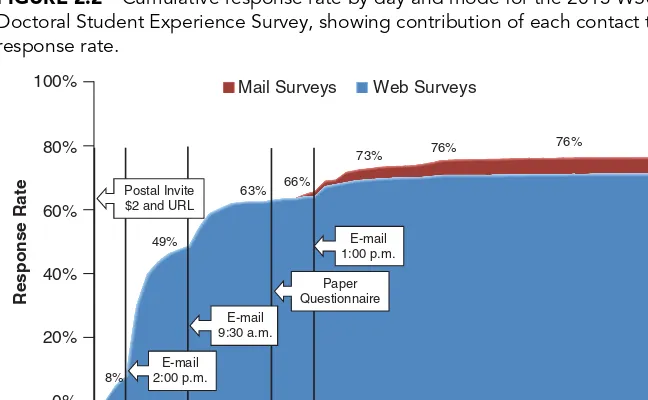
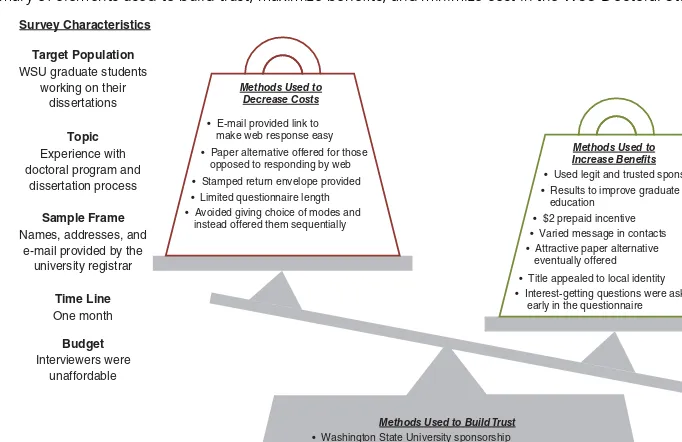
Returning to the WSU Doctoral Student Experience Survey:
Why It Obtained Such a High Response Rate
50
Conclusion
55
List of Guidelines
55
Chapter 3 Covering the Population and Selecting
Who to Survey
56
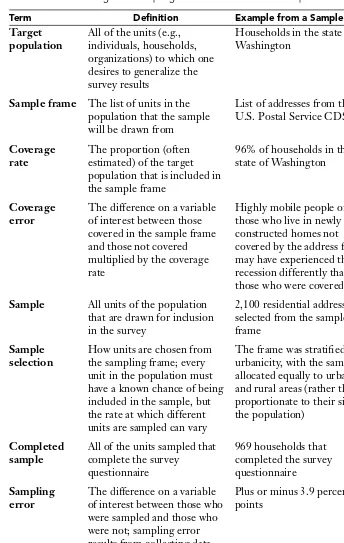
Essential Definitions and Their Use
57
Current Coverage and Access Considerations
58
Common Sampling Frames and Assessing How Well
They Cover the Population
62
Probability Sampling
75
Postsurvey Adjustments and Calculating Sampling Error
87
Nonprobability Sampling
91
Conclusion
92
viii Contents
Chapter 4 The Fundamentals of Writing Questions
94
Issues to Consider When Starting to Craft
Survey Questions
95
The Anatomy of a Survey Question and Types
of Question Formats
109
Guidelines for Choosing Words and Forming Questions
113
Conclusion
125
List of Guidelines
126
Chapter 5 How to Write Open- and Closed-Ended Questions
127
Guidelines for Writing Open-Ended Questions
128
General Guidelines for Writing All Types
of Closed-Ended Questions
134
Guidelines for Nominal Closed-Ended Questions
142
Guidelines for Ordinal Closed-Ended Questions
150
Conclusion
164
List of Guidelines
167
Chapter 6 Aural Versus Visual Design of Questions
and Questionnaires
169
The Importance of Visual Design
in Self-Administered Surveys
172
Visual Design Concepts and Their Application to Surveys
173
General Guidelines for the Visual Presentation
of Survey Questions
183
Guidelines for the Visual Presentation
of Open-Ended Questions
192
Guidelines for the Visual Presentation
of Closed-Ended Questions
197
Guidelines for the Visual Presentation of Questionnaire
Pages or Screens
204
A Case Study: The Use of Visual Design Principles
to Improve Data Quality in the American
Community Survey
218
Conclusion
224
List of Guidelines
225
Chapter 7 Ordering Questions and Testing for Question
Order Effects
228
Question Order
229
Testing Questions and Questionnaires
241
Conclusion
256
Chapter 8 Telephone Questionnaires and Implementation
258
Types of Telephone-Only Surveys Today
262
Guidelines for Designing Telephone Questionnaires
262
Guidelines for Administering Telephone Questionnaires
277
Guidelines for Establishing Calling Rules and Procedures
284
Quality Control and Testing Guidelines
for Telephone Surveys
293
Conclusion
298
List of Guidelines
298
Chapter 9 Web Questionnaires and Implementation
301
Guidelines for Designing Web
and Mobile Questionnaires
303
Guidelines for Web and Mobile Survey Implementation
328
Quality Control and Testing Guidelines for Web
and Mobile Surveys
342
Conclusion
348
List of Guidelines
349
Chapter 10 Mail Questionnaires and Implementation
351
Guidelines for Designing Paper Questionnaires
352
Guidelines for Implementing Mail Questionnaires
366
Quality Control and Testing Guidelines
for Mail Surveys
389
Conclusion
396
List of Guidelines
396
Chapter 11 Mixed-Mode Questionnaires and Survey
Implementation
398
When Single-Mode Surveys Are Not Acceptable
398
Why Consider a Mixed-Mode Survey Design
400
Guidelines for Designing Questionnaires That Will
Minimize Measurement Differences Across
Survey Modes
404
Expanding the Research Base for Designing
Mixed-Mode Surveys
416
Guidelines for Using Multiple Contact Modes
to Achieve More Effective Communication With
Potential Respondents
417
Guidelines for Providing Alternative Response Modes
424
From Individual Guidelines to Practical Study Designs
434
x Contents
Conclusion
447
List of Guidelines
448
Chapter 12 Responding to Societal Change and Preparing
for What Lies Ahead
450
Panels and Longitudinal Surveys
452
Nonprobability Sampling
455
New Mobile Devices and Technology
456
Supplementing Questionnaires With Measurement
Using Electronic Devices
458
Big Data and Administrative Records
459
Data Security
461
Specialized Purpose Surveys
461
International and Cross-Cultural Surveys
463
The Challenge of Connecting With Empowered but
Diverse Respondents
464
References
469
Author Index
491
Additional Resources
We are excited to share new developments in survey methods with our readers in this fourth edition ofInternet, Phone, Mail, and Mixed-Mode Surveys. There were issues we could not address in the pages of the book because of space limitations and the constraints of the print format. Our solution, in part at the urging of our great editorial team at John Wiley & Sons, was to create a Book Companion Website for this new edition of the book: www.wiley.com/go/dillman.
On the web page, we have provided a set of materials that we hope readers will find informative and useful. We chose materials we thought would help readers see how the ideas we discussed in the book can be brought together in practical ways. The website contains:
·
Checklist and summary of principles: 184 guidelines for designing drawn from the book that can be used as a brief refresher or even as a checklist when one is designing one’s own questionnaire. The guidelines are organized under topical headings for quicker searching.·
Visual design video presentation, “Understanding Visual Design for Questions and Questionnaires” (47 minutes) that is suitable for classroom presentation. In this video we demonstrate key visual design concepts and their application to questionnaire design. The video format allows us to integrate a number of helpful examples and illustrations that would not work in the static pages of a book. We anticipate that this will be a highly valuable resource for those trying to better understand the visual design of surveys and those trying to figure out how to format their questions into a questionnaire.·
Sets of real-world example survey materials: Each set includes a brief overview of the goals and design of the study, a copy of the question-naire(s), copies of all implementation materials, and in some cases, copies of envelopes. These example materials illustrate how procedures have been brought together to create comprehensive designs that are consistent with our social exchange framework, are tailored to the specific study and population, and incorporate the visual design concepts presented in the book. The examples include both single- and mixed-mode surveys. These sample materials will be useful to those looking for examples of how we have applied ideas from the book to our surveys, as well as those looking for ideas about how to put together their own surveys.·
An example of a 7′′×8.5′′questionnairefor those looking for an example of how this smaller booklet size can work.·
Before-and-after images from a redesign of the USDA-sponsored Agricultural Resource Management surveythat demonstrates the appli-cation of many of the visual design ideas discussed in the book. This example shows how multiple visual design concepts and design strategies can be brought together to simplify an incredibly complex survey.xii Additional Resources
·
Anexample of a cognitive interview report that demonstrates how this method can be used to inform questionnaire design. This report describes the motivation behind the interviews, procedures followed, and results and discussion. Readers can use it to better understand how this method works, see a real example of its application, and inform their own study design and procedures, or as an example of how a cognitive interview report can be put together.·
Color versions of select figureswhere we think the color will help convey the central idea better than can be done in the black-and-white format used in the print edition of the book.We hope that you find these materials helpful. We wish to acknowledge the invaluable help of Morgan Millar in pulling these materials together, especially the example survey materials. Morgan compiled most of these example surveys and wrote most of the survey descriptions. As with the rest of the book, this website has benefited greatly from her assistance.
Preface
Writing the fourth edition of this book nearly four decades after preparing the first edition has brought into perspective how survey science has evolved. It has also led us to reflect on how each edition needed to be refocused in order to fit with dramatically changing times.
The first edition was written on a typewriter, when personal computers, fax machines, the Internet, and cell phones were mostly unimagined by those want-ing to do surveys. The title of this 1978 book, Mail and Telephone Surveys: The Total Design Method, suggested what was then a revolutionary idea—sample sur-veys of the general public, which prior to that time were viewed as synonymous with in-person interviews, could be done in other ways. It proposed standardized step-by-step methods for conducting such surveys by either mail or by telephone. Those procedures contained the seeds of a bold idea, “For very little investment of money, almost any academic institution or agency can establish the capability for conducting credible mail and telephone surveys” (Dillman, 1978, p. 275).
Nearly 20 years elapsed before work began on the second edition. During those years dozens of experiments and field tests involving different survey popu-lations were undertaken to refine the 1978 mail data collection procedures and test new ones. The main outcome was to realize the necessity of tailoring specific data collection strategies to different populations, survey situations, and topics rather than using the one-size-fits-all approach described in that first book. The title of the 2000 edition, Mail and Internet Surveys: The Tailored Design Method, con-cisely summarized the fundamental changes introduced there. More than half of the new book was devoted to tailored designs such as alternative ways to deliver questionnaires, how to achieve greater speed and efficiency, challenges specific to government surveys, and how to survey businesses. The last chapter to be drafted, and the first to go out of date, was about Internet and interactive voice response surveys, which seemed ready to revolutionize surveying. In addition, the idea of mixed-mode survey designs, using the strengths of one mode to assist another, was introduced. To make room for these changes, telephone data collection methods were removed. This book was about a 95% revision of the first edition.
Only 6 years elapsed before work began in earnest on the third edition with two new coauthors, Jolene Smyth and Leah Christian. The three of us had begun working together as a team in 2002 to systematically research the effects of visual layout and design on the ways people answered survey questions and how responses differed across aural and visual modes of response. In this edition, we were first able to articulate what we had learned as guidelines for designing questionnaires. It was also apparent that there were multiple barriers to the conduct of mixed-mode surveys, ranging from how surveyors tended to structure questions for use in particular modes to inherent differences between aural and visual communication that might not be amenable to solutions for some types of questions. This edition began and ended with a discussion about the turbulence being felt among surveyors
xiv Preface
with declining response rates, coverage problems with telephone surveys, and a concern that the Internet was not yet ready to replace telephone as a stand-alone data collection mode, especially for household surveys. When bringing closure on this substantial rewrite in early 2008, we were also examining soon-to-be pub-lished results from a new kind of experiment we had done, which was a significant departure from the measurement and question wording issues that constituted much of our focus in this revision. These preliminary results seemed to show that we could use address-based sampling (our best source of coverage for household surveys in the United States) with mail contact and effectively encourage many people to respond over the Internet. These results (Smyth, Dillman, Christian, & O’Neill 2010) were included in this 2009 edition as having potential for surveying the general public by Internet using a mixed-mode design.
Work began on the fourth edition of this book, only 4 years after publica-tion of the previous edipublica-tion, and it was quickly apparent to us that the revisions would need to be nearly as substantial as the changes between the second and third editions. The telephone as an independent survey mode was continuing to face difficulties, and seemed on the verge of being rejected for certain national as well as state and smaller area surveys. It was also clear that the Internet had still not yet achieved the use and comfort levels that would allow it to be a sole data collection mode for many, and perhaps most, surveys. In addition, new chal-lenges to designing and getting people to respond to Internet surveys had arisen because of the quick adoption of smartphones and tablets as devices for accessing the Internet. And mail, which was once our least expensive mode but had the poor-est coverage, had become the mode with the bpoor-est coverage of households but had also become a higher-cost mode. These were the new issues we were grappling with in the constantly changing survey landscape.
The most significant change in this edition is bringing the telephone back into the book after leaving it out of the 2000 and 2009 editions. This decision may seem curious at a time when most surveyors are moving away from the telephone mode. But it is apparent to us that the telephone is still necessary for certain types of surveys and, perhaps more importantly, that there are many ways it can be used in mixed-mode designs to overcome the weaknesses of single contact and/or response mode surveys. Including the telephone in this edition reflects our commitment to integrating some of the main themes of the previous edition—tailored design and mixed-mode surveys—throughout the book, rather than assigning them to individual chapters. In this edition we have also expanded the theoretical under-pinnings of our approach to asking people to cooperate with survey requests and updated the social exchange framework used in all previous editions, placing more emphasis on trust and its response consequences in today’s rapid-fire commu-nication environment. Rethinking this framework was critical to laying a base for showing how different modes of contact, different response modes, and their coordinated use each provides potential for improving survey response rates and response quality.
certain survey situations; those chapters are also a prelude to their integration in mixed-mode designs.
This book ends on a note of uncertainty about exactly what lies ahead but also conveys our belief that the fundamental ideas of social exchange and tailored design that have evolved through all editions of this book will continue to be rele-vant and helpful for figuring out how to conduct surveys in the face of significant cultural and technological changes. Survey methods will undoubtedly continue to change and successful change will depend upon reconciling the needs and desires of surveyors with those of the people being surveyed. The ideas of social exchange and tailored design will be useful in figuring out how to do that. This edition draws heavily upon our own research experiences and experiments. Some of this research was conducted when we were working together at Washington State University with assistance from the Social and Economic Sciences Research Center (SESRC), but this edition also draws heavily on our separate experiences and research foci since that time. This includes Don’s continued work at the SESRC, Jolene’s expe-riences at the Survey Research and Methodology Program, the Department of Sociology, and the Bureau of Sociological Research at the University of Nebraska– Lincoln and Leah’s experiences at the Pew Research Center and Nielsen.
For the first time we have developed a companion website for this book that contains additional materials. On the website you will find example survey materials (i.e., questionnaires, contact materials, descriptions of implementation, etc.) for web, mail, telephone, and mixed-mode surveys; resources developed to demonstrate good survey visual design; color versions of many of the figures from throughout the book; and a cognitive interview example report. Readers can access these materials at www.wiley.com/go/dillman.
This book is dedicated to two consummate professionals—John Tarnai and Janet Harkness—both of whom were taken from us too early. Each has influenced our work in ways neither may have realized.
As the Assistant Director and Director of the SESRC from 1981 to 2012, John, more than any individual, nurtured the development of the web, mail, and telephone data collection capabilities of the SESRC, which provided the survey infrastructure that made it possible for us to conduct dozens of experiments that are reported in this book. Without his entrepreneurial leadership, our joint research could not have been done. His quiet demeanor and insights inspired us to do our best work and to share our survey experiences openly with others. He also collaborated on one of the first efforts to articulate the need for mixed-mode survey designs (Dillman & Tarnai, 1988), which set the tone for 25 years of follow-up experiments on the strengths and limitations of such designs that made this book possible.
Janet Harkness, served as a faculty member and later the Director of the Sur-vey Research and Methodology Program at the University of Nebraska–Lincoln from 2005 to 2012, and in that role was a strong supporter of much of the research reported in this edition of the book. In her research Janet was grappling with many incredibly complex issues involved in cross-national and cross-cultural sur-vey research; her contributions in these areas will continue to influence our field for decades to come as more and more surveys are conducted across cultural and national borders.
xvi Preface
For more than a decade the National Center for Science and Engineering Statistics (NCSES) has funded much of our work to invent and apply new mixed-mode methodologies and test their applicability to government surveys. For this we are especially grateful to the NCSES Division Director, Lynda Carlson, who initiated this work, and her successor, John Gawalt, who continued it and the many NCSES staff who worked with us. This funding provided support for many grad-uate students whose much appreciated contributions to this research appear in the book references—Michael Stern, Arina Gertseva, Taj Mahon-Haft, Nicholas Parsons, Bryan Rookey, Allison O’Neill, Benjamin Messer, Morgan Millar, and Michelle Edwards. We also wish to acknowledge the contributions of graduate students in the Sociology Department Survey Practicum at Washington State Uni-versity, and in Data Collection Methods and Questionnaire Design courses at the University of Nebraska–Lincoln.
Don would also like to thank the many staff of the SESRC who regularly, and often with great patience, solved the innumerable design challenges associ-ated with the experimentation necessary for testing many of the ideas presented here. Special thanks goes to Tom Allen, study director for most experiments, for his ability to solve the visual design and communication issues associated with work-ing across survey modes, and Rita Koontz, SESRC Administrative Manager, for her commitment to making the SESRC an effective and much appreciated work environment. He would also like to thank Edith deLeeuw for conversations that influenced rewriting the theoretical approach used in this book.
Jolene would like to thank Kristen Olson for being a wonderful colleague and friend who shares her time generously and is always willing to talk through ideas and undertake new research projects. She would also like to thank Amanda Richardson and the staff of the Bureau of Sociological Research for the many insightful survey discussions that have influenced her thinking in recent years, and Dan Hoyt and Julia McQuillan for their ongoing support and leadership. Finally, Jolene has had the privilege of working directly with many wonderful graduate students in recent years who have made valuable contributions to her research and thinking. She appreciates each and every one and would like to especially thank Nuttirudee Charoenruk, Alian Kasabian, Amanda Libman, Rebecca Powell, Kay Ricci, Ashley Richards, Mathew Stange, Lauren Walton, Heather Wood, and Quan Zhou.
Leah would like to thank Scott Keeter, her mentor and collaborator at the Pew Research Center, as well as Jim Bell and the many other colleagues who eagerly tackled the methodological challenges the center faced. Special thanks go to Leah’s new colleagues at Nielsen, who provided encouragement and guidance as she spent time on the final manuscript.
The intensive writing process benefitted greatly from the help of several indi-viduals. We appreciate Kristen Olsen critically reviewing the sampling and cover-age chapter and Amanda Richardson providing a thorough review of the telephone chapter. In addition, Mathew Stange provided assistance with some of the figures. We especially want to thank Morgan Millar, who brought her expertise with survey methods and excellent editorial skills to bear on all aspects of reviewing, prepar-ing, and submitting the final manuscript. Her attention to detail, organization, and encouragement ensured we were able to deliver a final manuscript.
Washington State University faculty colleague. His appreciation for her support is both deep and long lasting.
Kristi and Tyson Chambers were both invaluable sources of support and inspi-ration during the writing of this book. They did more than their share of the chores when Jolene was tied to the computer, stayed patient with the process, and always seemed to have the right answer, usually a laugh or a hug, at the right time. She hopes they know how much she loves and appreciates them.
Eugene MacIntyre has helped Leah throughout her work on this book; she deeply appreciates his unwavering support. She also thanks Leilani, who lights every day and reminds Leah of all the really important things in life, and who gave up very important playtime with Mommy so she could work on the book.
1
Sample Surveys
in Our Electronic
World
Hundreds of times every day someone decides to create a survey. The variety of organizations and individuals who make this decision is enormous, ranging from individual college students to the largest corporations. Community service organi-zations, nonprofit foundations, educators, voluntary associations, special interest groups, research scientists, and government agencies also all collect needed information by conducting surveys. The topics of these surveys vary greatly, from questions about health, education, employment, and political preferences to inquiries about television viewing, the use of electronic equipment, and interest in buying a new car, among many other things.
The reasons for deciding to conduct a survey are as diverse as the range of survey sponsors and topics. Sometimes, the justification is that the sponsors do not know the opinions or beliefs of those they want to survey. More typically, the sponsor has interests that go much deeper, wanting to know not just how many individuals in a group have a particular attitude, but how that attitude varies with other respondent characteristics that will be asked in the survey, such as across men and women or across different age or socioeconomic groups.
While the need to know something that is unknown drives the decision to conduct most surveys, the uses of survey results are as diverse as those who spon-sor them. For example, one of us recently completed a community survey that was used to decide what facilities to include in a new neighborhood park that was about to be developed. University leaders use results from surveys of students to revise their undergraduate and graduate education programs. Public opinion poll-sters use results from surveys of likely voters to predict who will win national and local elections. The Federal Reserve uses estimates of the unemployment rate pro-duced monthly in the Current Population Survey to help set economic policy. Data from this same survey are used by individuals and businesses throughout the United States to make investment, hiring, and policy decisions. Market researchers use surveys to provide insights into consumer attitudes and behaviors. Nonprofit groups use surveys to measure attitudes about issues that are important to them and support for possible programs the group might pursue.
Surveys are both large and small. For example, over the course of a year the U.S. Census Bureau asks a few million households to respond to the American Community Survey. Others ask only a few hundred or even fewer individuals to respond. The survey response mode also varies, with some surveys being con-ducted by a single mode—in-person, web, telephone, or paper—while others provide multiple modes for answering questions. Sometimes respondents are asked to respond only once, while in other surveys a single individual may be asked to answer questions repeatedly over months or years, and surveys may be conducted
2 Sample Surveys in Our Electronic World
in just a few weeks or over several months or years. In some cases people are asked to provide information about themselves or their households, and in other cases they are asked to provide information about a particular business or other organization with which they are affiliated.
Despite this diversity, all surveys still have a lot in common. Each is moti-vated by the desire to collect information to answer a particular question or solve a particular problem. In some cases the desired information is not available from any other source. In other cases, the information may be available, but it can-not be connected to other important information—such as other characteristics or related attitudes and behaviors—that need to be known in order to solve the problem or answer the question.
In most surveys only some of those in the population of interest are asked to respond. That is, the survey is based on a sample rather than being a census
of every member of the target population. In addition, those who respond are asked questions they are expected to answer by choosing from among predeter-mined response categories or, occasionally by providing open-ended answers in their own words. These commonalities and the enormous amount of money and effort now spent on surveys point to their importance as a tool for learning about people’s characteristics, opinions, and behaviors, and using those results to inform and direct public policy, business decisions, and for many other purposes.
Other nonsurvey means, both quantitative and qualitative, are available to social scientists, marketing professionals, government officials, special interest groups, and others for collecting useful information that will produce insight into the attitudes and behaviors of people and the groups they are a part of. These include unstructured interviews, focus groups, participant observation, content analyses, simulations, small group experiments, and analyses of administrative records or organic data such as birth and death records, sales transactions, records of online searches, social media, and other online behavior. Each of these methods can yield different types of information, and for some questions they are more appropriate than surveys or may be used in combination with surveys to answer the research question or community problem.
The feature of the probability sample survey that distinguishes it from these other methods of investigation is that it can provide a close estimate of the distri-bution of a characteristic in a population by surveying only some members of that population. If done correctly, it allows one to generalize results with great preci-sion, from a few to the many, making it a very efficient method for learning about people and populations.
The efficiency and importance of the probability sample survey might best be illustrated by considering an alternative way to learn about a population—a census. Every 10 years the U.S. Census Bureau attempts to contact and survey every household in the United States, as required by our Constitution. The result-ing information is used to reapportion the U.S. House of Representatives so that each member represents about the same number of U.S. residents. This mas-sive survey, known as the Decennial Census, costs billions of dollars to conduct. A smaller organization that wants to know the opinions of all U.S. residents on a particular issue could hardly afford such an undertaking. But with a probability sample survey, it can learn those opinions for considerably lower costs by selecting only some members of the population to complete the survey.
education they are receiving. If this were necessary, studies of student satisfaction would seldom, if ever, be done. But probability sample surveys allow us to be much more efficient with our resources by surveying only a sample of students in a way that enables us to generalize to the entire student population.
Whatever the target population or research question, limiting our data collec-tion to a carefully selected sample of the populacollec-tion of interest allows us to con-centrate limited resources (e.g., time and money for follow-up communications, data cleaning, and analysis) on fewer individuals, yet obtain results that are only slightly less precise than they would be if every member of the population were surveyed.
Our purpose in this book is to explain how to conduct effective probability sample surveys. We discuss the fundamental requirements that must be met if one wants to generalize results with statistical confidence from the few who are surveyed to the many they are selected to represent. We also describe specific pro-cedures for designing surveys in which one can have high confidence in the results. Regardless of whether your interest in surveys is to understand one of the many national surveys that are conducted for policy purposes or to gain knowledge of how to design your own survey of organization members, college students, cus-tomers, or any other population, it is important to understand what it takes to do a good survey and the multiple sources of error that can reduce the accuracy of the survey results—or completely invalidate them.
FOUR CORNERSTONES OF QUALITY SURVEYS
In general, survey error can be thought of as the difference between an estimate that is produced using survey data and the true value of the variables in the popula-tion that one hopes to describe. There are four main types of error that surveyors need to try to minimize in order to improve the survey estimates.
1. Coverage Erroroccurs when the list from which sample members are drawn
does not accurately represent the population on the characteristic(s) one wants to estimate with the survey data (whether a voter preference, a demographic characteristic, or something else). A high-quality sample survey requires that every member of the population has a known, nonzero probability of being sampled, meaning they have to be accurately represented on the list from which the sample will be drawn. Coverage error is the difference between the estimate produced when the list is inaccurate and what would have been produced with an accurate list.
2. Sampling Erroris the difference between the estimate produced when only
a sample of units on the frame is surveyed and the estimate produced when every unit on the list is surveyed. Sampling error exists anytime we decide to survey only some, rather than all, members of the sample frame.
3. Nonresponse Erroris the difference between the estimate produced when
only some of the sampled units respond compared to when all of them respond. It occurs when those who do not respond are different from those who do respond in a way that influences the estimate.
4. Measurement Erroris the difference between the estimate produced and
4 Four Cornerstones of Quality Surveys
which can be due to poor question design, survey mode effects, interviewer and respondent behavior, or data collection mistakes.
We consider reducing the potential for these errors as the four cornerstones of conducting successful sample surveys. Surveyors should attempt to limit each to acceptable levels. None of them can be ignored. As such, each receives detailed attention in the chapters that follow. Because these sources of error are so essential for defining survey quality, we describe each of them here in more detail.
Coverage Error
As we previously mentioned, the strength of a probability sample survey is that it allows us to collect data from only a sample of the population but generalize results to the whole, thus saving considerable time, money, and effort that would be incurred if we had to survey everyone in the population. However, in order to draw a sample, one has to have a sample frame, or a list of members of the tar-get population, and any errors in that list have the potential to introduce coverage error into the final estimates that are produced. If some units from the target pop-ulation are not included on the sample frame (i.e., undercoverage)andthey differ from those that are in ways that are important to the survey, the final estimates will contain error.
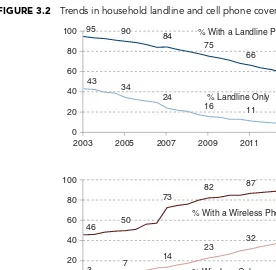
For example, all other error sources aside, a landline random digit dial tele-phone survey would likely overestimate the prevalence of higher socioeconomic status because the well-off are more likely than the poor to have landline tele-phone service (i.e., the well-off are more likely to be on the landline random digit dial sample frame) (Blumberg & Luke, 2013). In fact, one of the challenges now being faced in conducting household telephone surveys is that only about 58% of households still have landlines (Blumberg & Luke, 2013), the traditional source of random digit dialing samples, and those who have them are quite different from those who do not on a number of important characteristics. Using the landline telephone frame alone (without supplementing it with a cell phone frame) for a national household survey would leave out significant portions of the population who are likely to differ in important ways from those included on the frame.
Similarly, conducting a national household survey by Internet would leave out significant portions of the population because, as of May 2013, only 73% of American adults have Internet access in the home (Pew Internet & American Life Project, 2013b). In comparison, an Internet survey of undergraduate students at a university, where all students are required to use the Internet, would likely have little coverage error, provided a list of all students could be obtained. In Chapter 3 we discuss in detail the threat of coverage error, its likely sources, and how to limit it.
Sampling Error
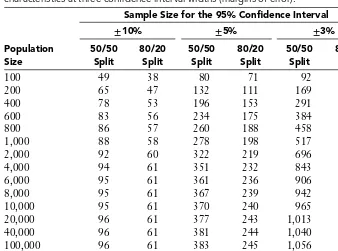
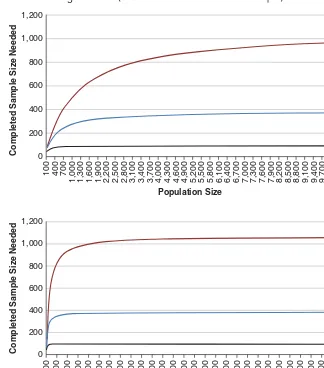
estimates with acceptable levels of precision can usually be made for the population by surveying only a small portion of the people in the population. For example, a researcher can sample only about 100 members of the U.S. general public and, if all 100 respond, achieve estimates with a margin of error of+/−10%. Successfully sur-veying a sample of 2,000 individuals reduces the margin of error to about+/−2%. Surveying 100 or even 2,000 people rather than the approximately 315 million people in the United States represents an enormous and desirable cost savings, but doing so means that one has to be willing to live with some sampling error in the estimates.
Sampling error is an unavoidable result of obtaining data from only some rather than all members on the sample frame and exists as a part of all sample surveys. For this reason, we describe the importance of reducing survey error to acceptable levels, rather than being able to eliminate it entirely. By contrast, censuses—in which all members on the sampling frame are selected to be surveyed—are not subject to sampling error.
Many novice surveyors find sampling error to be somewhat nonintuitive. They find it difficult to imagine only needing to survey a few hundred or thousand to learn about millions of households or individuals. Yet, during each presidential election in the United States, surveys of between 1,000 and 2,000 likely voters are conducted that correctly estimate (within the limits of sampling error) the votes for each candidate. For example, across polls conducted in the final week of the 2012 campaign, the average error for each candidate was about 2 percentage points. Just as nonintuitive for some beginning surveyors to grasp is that in order to predict the outcome of a local election for a particular state or medium sized U.S. city with perhaps 50,000 voters, nearly as many people need to be surveyed as are needed for predicting a national election.
The exact sampling error is easily calculated mathematically, as described in Chapter 3. However, the ease of making those calculations and the mathe-matical preciseness of the result leads to overreliance on it as a singular measure of the amount of error in a survey statistic. This tendency should be avoided. Sampling error calculations reflect the completed sample size, that is, only received responses are considered. The larger the number of responses, the greater the reported precision and statistical confidence. But they ignore the possibility for coverage error as well as the fact that many and sometimes most of the invited participants did not respond, which raises the potential for a third source of error, nonresponse error.
Nonresponse Error
6 Four Cornerstones of Quality Surveys
The common mistake sometimes made by novice surveyors is to consider response rate as an adequate indicator of whether nonresponse error exists. Comparisons across many surveys have shown that nonresponse error may occur in surveys with higher as well as lower response rates (Groves & Peytcheva, 2008). For example, in 1989 a study was conducted in Dallas County, Texas, to learn about people’s thoughts and behaviors related to acquired immunodeficiency syn-drome (AIDS). Sampled individuals were asked to complete a self-administered survey and have a blood sample drawn by a phlebotomist. This study achieved a remarkable 84% response rate: A rate that some might think is a clear indication of high quality. But to ascertain whether there was nonresponse bias, the researchers went back to a random sample of the nonrespondents and were able to get some to participate (some were not asked to give the blood sample at this stage). This effort revealed that the prevalence of human immunodeficiency virus (HIV) risk behav-iors like intravenous (IV) drug use and male-to-male sex were underestimated in the original data collection effort. Only 3% of those who initially participated reported engaging in IV drug use compared to 7% of those who participated in the follow-up. Similarly, only about 5% of the initial participants reported engaging in male-to-male sex compared to about 17% of those in the follow-up (Centers for Disease Control and Prevention, 1991). Despite an impressive 84% response rate, the initial estimates were biased because those who responded differed from those who did not respond on characteristics of interest in this study. While the study just described demonstrates that higher response rates do not guarantee minimal nonresponse error, it is important to recognize that higher response rates do reduce the likelihood of nonresponse error and thus provide greater credibility to surveys’ results than do lower response rates. In addition, higher response rates result in larger completed samples, thereby increasing the precision of the estimates in that way. Thus, designing surveys in ways that produce higher response rates can be a helpful tool in reducing nonresponse error. Response is a function of contact and cooperation. That is, in order to obtain a response, we first have to make contact with sample members and then we have to convince them to cooperate with our request to complete the survey. Using multi-ple contact attempts and varying the timing, delivery method, and mode of those attempts are a few ways we discuss in this book of increasing the likelihood of mak-ing contact with sample members. Respondent-friendly questionnaires, shorter (rather than longer) survey instruments, the use of incentives, follow-up requests that target likely nonrespondents, and switching survey modes are a few of the many features of survey design discussed in this book that are intended to increase the likelihood of sample members cooperating with our request. All of these strate-gies have the parallel objectives of increasing response while simultaneously reduc-ing nonresponse error. Chapter 2 introduces the discussion of implementation procedures and a theory for guiding those decisions. The majority of this book, from Chapter 4 forward, focuses on many aspects of survey design that can reduce nonresponse as well as measurement error.
Measurement Error
measures the idea or concept of interest. An example occurred in a survey in which the sponsor wanted to obtain a measurement of household wealth. He had tentatively decided to use household income for the previous year as a measure of wealth until a colleague pointed out that annual income is likely to decrease sharply when a person retires, but wealth typically does not. Similarly, a community survey sponsor proposed using length of time individuals had lived in their current residence as a measure of length of time in the community, but soon discarded the idea because of the likelihood that many people may have moved from one residence to another in the same community. When a question does not measure what it was intended to, as in these cases, it is typically referred to as having speci-fication error (also known as low construct validity). Considerable time and effort can be spent deciding what format of question to use, what type of scale to provide, how to label answer categories, whether to offer a “don’t know” option, and any number of other details, but all of that effort is useless if the question does not measure the concept called for by the study objectives.
Once one has selected an acceptable way to measure a specific concept, there are many different ways that accuracy of the estimate may be compromised, resulting in measurement error.
·
The substance of the question may encourage a response that, because of perceived societal norms, puts the respondent in a more favorable light to the interviewer and/or survey sponsor. Questions about sex and illegal behaviors are examples.·
The question may be unclear to the respondent because it uses words that are not understood or phrases that are confusing.·
The question structure may encourage certain answers that another structure would not. For example, items that ask respondents to mark all that apply tend to result in fewer selections among later categories than those that ask for an explicit positive or negative answer for each item (i.e., a forced-choice or yes/no format).·
The order in which questions are asked may produce different answers to specific questions than would another order.·
The visual layout of a question may increase the likelihood that certain answers are chosen and others are not, or that some items are overlooked altogether.·
Some types of respondents may be less likely to give accurate answers than others.·
Perception of the expectations of interviewers or the sponsor may also influ-ence answers.·
Interviewer characteristics, such as gender or race, may influence the answers people provide.·
The choice of survey mode may also influence answers to surveys. For example, research has consistently shown that scalar questions are likely to be answered differently in visual versus aural surveys.8 Four Cornerstones of Quality Surveys
variance, which is akin to the idea of low reliability. That is, if the measurement were taken over and over multiple times, it would produce a different result each time.
A great deal of terminology is often used to indicate why some questions and not others exhibit measurement error, including social desirability, primacy/ recency, acquiescence, clarity of figure/ground relationships, the Law of Pragnanz, the norm of evenhandedness, and much more. We mention these many sources of potential measurement differences because writing effective questions requires simultaneously working on many fronts in an effort to reduce measurement prob-lems in surveys to obtain accurate answers to all questions. We discuss this further in Chapters 4, 5, 6, and 7.
Total Survey Error
The need to focus on many design considerations at once sometimes results in ignoring one source of error, a mistake that can have devastating repercussions for a survey. For example, a faculty member concerned with reports of classroom cheating decided to take advantage of the web survey software available in her university and design a survey of students to get their perceptions about whether classroom cheating was happening and to learn what they thought would be appro-priate punishment. It was her hope that conducting a probability sample survey of students would produce data she could report to the appropriate university officials to inform new policies for dealing with cheating cases. To avoid the challenge of sending sample members e-mails with individual passwords that would allow only those sampled to respond, she sent generic e-mails and set up the survey website so that anyone who knew about the survey could complete it. She soon learned that the e-mails sent to the carefully selected sample of students had been forwarded to other students and that some students with particularly strong viewpoints had filled out the survey multiple times (i.e., stuffed the ballot box!), which breaks from the requirement for a probability sample that only the people selected for the sur-vey can provide a response and that each person can respond only once. In trying to simplify the administration of this survey, the faculty member ended up making a decision that undermined the probability nature of the sample and discredited the survey’s results.
We have also observed situations in which survey designers became excessively concerned over resolving issues with small consequences. Upon learning that a sample of household addresses for a community survey would only reach about 95% of the households in the community, one surveyor became obsessed with how to manually add the missing addresses. To do so would have required tremendous costs and effort, including cross-checking records and potential personal visits to areas in the community to check to see if there were addresses there. In this case, the error from missing 5% of households was likely to be small, and the resources that would be required to fix it were excessive in relation to the likely benefit. It would have been more beneficial to focus on reducing other potential errors.
In another situation this may not be the case. Surveyors designing a national survey that will produce data used to allocate government funds may decide that even though small, the extra precision obtained by enumerating the missing 5% of addresses is worth the extra effort because it will help ensure that federal funds are fairly distributed.
sources of error comes from different academic disciplines. Sampling theory and concepts for defining and understanding coverage effects come principally from statistics. Measurement issues are more likely to be dealt with by the disciplines of psychology and sociology. Nonresponse research draws concepts from all of the disciplines. While understanding of the behavioral reasons for nonresponse as relied heavily on sociological and psychological thinking, potential solutions for such response issues, such as imputing missing responses for individual items or calculating weighting adjustments to mitigate unit nonresponse have been developed primarily by statisticians. Economists, political scientists, and market research professionals have also contributed significantly to the literatures in these areas. Survey error is fundamentally a multidisciplinary problem and nowhere is that more evident than in efforts to reduce multiple sources of survey error. Good survey design requires giving balanced concern to error sources, regardless of one’s inclination to focus mostly on what he or she knows best.
This state of affairs has encouraged the development and use of the Total Survey Error (TSE) framework. This term refers to attempting to design surveys in a way that maximizes data accuracy within constraints that cannot be ignored, such as costs and the time available for completing the survey (Biemer & Lyberg, 2003). Reducing total survey error involves careful survey planning, sample selection, questionnaire design, implementation, and data analysis. It is about simultaneously controlling all four sources of error to the extent practical and possible, within the time, cost, and other constraints of the survey. Survey error cannot be completely eliminated, but with diligence to all four types it can be kept to reasonable levels. Our emphasis throughout this book is on how reducing total survey error can be accomplished in large and small surveys alike, including those with generous as well as quite limited budgets.
Often reduction of total survey error focuses on discrete actions that can be taken separately to reduce each type of error, but in other cases a much broader systematic change to the survey design may be undertaken. For many years, the National Household Education Survey conducted by the National Center for Educational Statistics was conducted in a two-step process. Random digit dial telephone surveys (landline numbers only) were used to identify households with children. Then the identified households were surveyed again, also by telephone, to collect detailed information. It became evident early in 2007 that not only were response rates falling dramatically (Montaquila, Brick, Williams, Kim, & Han, 2013), but increasing portions of the nation’s children were being raised in homes without landline connections. The proportion of children growing up in cell-only households has continued to increase, and is now over 45% (Blumberg & Luke, 2013). The survey sponsors were concerned about both coverage and nonresponse error and were worried about the costs associated with beginning to call cell phones to reduce the coverage error. A proposal to consider a possible change to address-based sampling using mail methods was met with considerable skepticism. In addition to not being sure it would improve response, changing to mail also meant that questions would need to be asked in different ways, changes that might impact trend lines from data accumulated over many years. But, after extensive testing, it was decided to make the switch based on considerations across multiple types of error.
10 What Is Different About Surveying in the 2010s?
changes to the survey itself to make it work in a visual rather than aural survey mode. Because this undertaking was so enormous, initial reluctance was only over-come after several years of testing. Ultimately, this testing showed that the new methods were more suitable for the changing survey landscape we now face, and that they were beneficial from a total survey error perspective.
WHAT IS DIFFERENT ABOUT SURVEYING IN THE 2010s?
When the first edition of this book appeared in 1978, personal computers, the Internet, cell phones, and fax machines existed only as ideas that might someday be a part of people’s lives. Surveys were limited to landline telephone, mail, and in-person interviews. When the second edition appeared in 2000, the Internet and another intriguing development, telephone Touchtone Data Entry, which even-tually evolved into Interactive Voice Response, were added in a single chapter. At this time surveyors were just beginning to consider their possible uses.
Rapid technological development in the past 15 years has changed this situation substantially so that there are now many means for contacting people and asking them to complete surveys. Web and cellular telephone communication have undergone rapid maturation as means of responding to surveys. In addition, voice recognition, prerecorded phone surveys that ask for numerical and/or voice recorded responses, fillable PDFs, smartphones, tablets, and other devices have increasingly been used for data collection. Yet, for many reasons traditional phone, mail, and in-person contacts have not disappeared, and are often being used in combination to maximize the potential of reaching people. In addition, offering multiple ways of responding (e.g., web and mail in the same survey) is common. It is no longer practical to talk about a dominant mode of surveying, as in-person interviews were described in the middle of the 20th century and telephone was referred to from about 1980 to the late 1990s.
The situation faced by surveyors in this decade is in some ways ironic. We can now connect with a huge portion of a survey population in multiple ways; about 98% of U.S. households have either a landline or cellular telephone (Blumberg & Luke, 2013), around 96% have U.S. Postal Service mail delivery (Iannacchione, 2011), and 85% of adults in the United States use the Internet and 73% have Internet access in their homes (Pew Internet & American Life Project, 2013b, 2013c). Individual household access for in-person surveys is harder to estimate because of locked apartment buildings and gated communities that prevent interviewers from gaining access. However, while surveyors now have multiple ways to contact people, their efforts are often thwarted by buffers designed to keep unsolicited messages at bay. Receptionists or guards prevent access to buildings. Answering machines, voice mail, and caller ID technology filter telephone calls. E-mail filters and the ability to preview e-mails without opening them make e-mail survey requests less likely to be seen and answered. Thus, the technology that makes unprecedented and speedy access possible also provides the means of avoiding or ignoring it. In addition, cultural norms have evolved so that control over whether a survey request is received and responded to rests increasingly with the individual to whom the request is being made, and not with the individual making it.
of intermediaries. Tasks that once required help—making a bank withdrawal, reserving a room in a hotel or a seat on an airplane, leaving a phone message, and purchasing groceries—can now be done quite well without the assistance of another person. In this environment, why should surveyors expect that positioning an interviewer as a necessary intermediary between the surveyor and respondent remain the most prevalent way of conducting a survey? It should not be surprising that many telephone-only surveys now obtain response rates in the single digits (Keeter, Christian, Dimock, & Gewurz, 2012).
However, the rapid decline of telephone interviewing as a dominant stand-alone way of conducting household and other surveys is occurring for other reasons as well. The shift away from landlines as the predominant method of tele-phone communication means that the traditional sample frame for random digit dialing that was depended upon to cover the U.S. population no longer covers a considerable portion of households. Combining landline and cell phones poses difficult sampling challenges, some of which occur because many people have both landlines and cell phones, and because landlines tend to be household-based and cell phones tend to belong to individuals. In addition, the portability of cell phone numbers across geographic areas adds to the challenge when one wants to conduct a survey of a specific geographic area like a city or region. Those who keep a cell phone number from another area when they move into the area being surveyed will not appear on the sample frame, and those who kept their local number when they moved out of the area will be erroneously included in the frame. Also, the need to ask all respondents additional questions to establish eligibility is made difficult by the conflicting need to make questionnaires shorter, due to today’s culture of people being less willing to reveal information about themselves to a stranger over the telephone.
Many surveyors were optimistic in the late 1990s that as telephone response rates fell, a smooth transition could be made to conducting most surveys over the Internet. This transition has not been as effective as it was envisioned. Not all households have Internet access, and the fact that individuals who do not use the Internet differ sharply (older, less education, and lower incomes) from those who do, makes it difficult to achieve adequate representation for many surveys. Per-haps even more importantly, there are no sample frames for household surveys that allow direct e-mail contact, like traditional random digit dialing for the telephone or address-based lists for mail. Even when e-mail addresses are available (e.g., lists of clients, students, and organization members), contact only by e-mail often pro-duces response rates that are similarly low to those achieved in telephone surveys. As a result, optimism about the potential for web surveys has more recently given way to puzzlement. Even casual observation in airports, shopping malls, and meetings make it evident that people are increasingly receiving and sending mes-sages on smartphones and a myriad of other electronic devices. Full screen laptops or desktop computers with keyboards are no longer the predominant way that many people connect to the Internet.
12 Why Emphasize Mixed-Mode Data Collection?
young people continue to replace e-mail communication with texts or social networking status updates, it has become harder to reach this group. For these reasons, successfully shifting to electronic communication for all survey requests continues to be very challenging.
Mail surveys have also undergone a significant transformation. Although mod-ern mail survey methods were being developed at the same time that random digit dialing enabled the telephone to become a prominent mode, mail has long been considered a less desirable and lower response rate alternative. This survey mode is also not well suited for the intensive branching that now characterizes many survey questionnaires. But substantial advancements in printing capabilities mean that the personalization and customization of paper surveys and mailing materials have advanced well beyond where they were just a decade ago.
The situation for mail also improved considerably when the U.S. Postal Service began routinely releasing a list of residential addresses of all households receiving delivery of postal mail. Improvements in the proportion of households with city addresses, as opposed to simplified addresses that were somewhat imprecise, now mean that about 95% to 97% of U.S. households are accessible to surveyors by mail (Iannacchione, 2011). At the same time, research has shown that responses to postal surveys have not declined as significantly as responses to telephone surveys (Messer & Dillman, 2011; Rookey, Le, Littlejohn, & Dillman, 2012; Smyth, Dillman, Christian, & O’Neill, 2010).
Ironically, mail has moved from being the lowest response rate mode for many survey designs to now having response rates that are significantly higher than telephone and being competitive with well-financed in-person surveys. It has also shifted from having the poorest coverage for household surveys to having the most comprehensive household sample frame. Mail surveys were also once considered the lowest cost method for conducting surveys but are now a some-what higher cost method, especially when compared to an e-mail-only contact web survey. That said, mail continues to have its challenges, such as ensuring that the mail is actually delivered to the household and opened by someone in the household and that the person receiving it can read and comprehend it in the language(s) provided.
In sum, single mode surveys, regardless of mode, tend not to be as effective as in years past for many, if not most, survey situations. And increasingly, more than one mode may need to be used to contact and survey different individuals to ensure that various members of the population are represented.
WHY EMPHASIZE MIXED-MODE DATA COLLECTION?
Our emphasis in this book on mixed-mode survey designs stems from our desire to create designs that are most likely to keep the four major sources of error to acceptably low levels while also reducing survey costs. Mixing modes allows us to take advantage of the strengths of certain modes to overcome the weaknesses of others in order to minimize total survey error as much as possible within resource and time constraints. How exactly we mix modes depends heavily on our motiva-tion for mixing them; that is, it depends on what sources of error we are trying to minimize or if we are trying to reduce costs or collect the data quickly.
United States by Luiten (2013) found that reducing costs was the primary reason for the increasing use of mixed-mode designs. A common way to mix modes to reduce costs is to collect as many responses as possible in a cheaper mode before switching to a more expensive mode to try to obtain additional responses. This strategy was used by the U.S. Census Bureau for the 2010 Decennial Census. Paper questionnaires were first mailed to nearly every address in the United States and about 74% of them responded (U.S. Census Bureau, n.d.). Only then were more expensive interviewers sent out to try to obtain responses from households that did not respond by mail. The Census Bureau was able to save considerable money by getting most households to respond by mail and minimizing the number that would need to be visited by in-person interviewers.
However, there are many other reasons that multiple modes of survey response are used. Sometimes the goal is to improve coverage. While it is theoretically pos-sible to contact sampled individuals in many different ways—cell phone, office phone, home phone, home postal delivery, office postal delivery, or through mul-tiple e-mail addresses—it is quite uncommon for our available sampling frames or lists to include all types of contact information for each unit. The lack of avail-able contact information for multiple modes can be due to the inability to match contact information from different frames or because people are unwilling to vol-untarily provide multiple types of contact information to organizations requesting it (e.g., some people might provide a phone number, others an e-mail address, and still others a postal mailing address). In this context, developing a sample frame for a single-mode survey often means excluding members of the target popula-tion for whom the desired mode of contact is not available, potentially increasing coverage error. Mixing modes is a way to ensure most members of the target population can be included on the sample frame and thus have an opportunity to be sampled.
Sometimes a second or third mode is offered to individuals in hopes they will find an alternative mode particularly appealing or they will be able to respond to it when they are unable to respond by a different mode. An example is that indi-viduals who cannot respond on a computer because of not having developed those skills may be quite comfortable responding by paper or by telephone. Some indi-viduals may not pick up their mail or answer a landline phone but will check their e-mail and answer their cell phone. In cases such as these, using multiple modes can improve response rates and reduce nonresponse error by appealing to differ-ent kinds of responddiffer-ents. In still other instances, one response mode is offered initially, such as web or telephone, and then followed by another (e.g., mail) to improve the speed of response and facilitate quicker processing of results.
Mixing survey modes does not necessarily mean offering people more than one way of completing a survey questionnaire. Different modes can also be used to contact sample members with the survey request even when only one mode is used for collecting responses. Traditionally, people were contacted by the same mode that was also used to complete the survey. However, research has long shown that contacting individuals by mail ahead of a telephone or in-person interview can improve response rates (de Leeuw, Callegaro, Hox, Korendijk, & Lensvelt-Mulders, 2007); similarly, follow-up telephone calls to remind people to respond can sometimes improve response rates for postal surveys.