Mathematics and Visualization
Editors
ABC
Gregory Conti
John R. Goodall
Kwan-Liu Ma
Proceedings of the Workshop on Visualization
for Computer Security
VizSEC 2007
c
This work is subject to copyright. All rights are reserved, whether the whole or part of the material is concerned, specifically the rights of translation, reprinting, reuse of illustrations, recitation, broadcasting, reproduction on microfilm or in any other way, and storage in data banks. Duplication of this publication or parts thereof is permitted only under the provisions of the German Copyright Law of September 9, 1965, in its current version, and permission for use must always be obtained from Springer. Violations are liable to prosecution under the German Copyright Law.
The use of general descriptive names, registered names, trademarks, etc. in this publication does not imply, even in the absence of a specific statement, that such names are exempt from the relevant protective laws and regulations and therefore free for general use.
Printed on acid-free paper 9 8 7 6 5 4 3 2 1 springer.com
John R. Goodall
Gregory Conti
United States Military Academy
Kwan-Liu Ma
[email protected] Editors
ISBN 978-3-540-78242-1 e-ISBN 978-3-540-78243-8
ISSN 1612-3786 Library of Congress Control Number: 2008924865
Department of Electrical Engineering and Computer Science
Mathematics and Visualization
2008 Springer-Verlag Berlin Heidelberg
Cover design:WMX Design GmbH
University of California One Shields Avenue Davis, CA 95616, USA
Mathematics Subject Classification (2001): 68-06, 68U05
6 Bayview Ave. Applied Vision, Inc.
Northport NY 11768, USA West Point, NY 10996, USA
Secure Decisions Division
Preface
This volume is a collection of the papers presented at the 4th International Work-shop on Computer Security – VizSec 2007. The workWork-shop was held in conjunction with the IEEE Visualization 2007 Conference and the IEEE InfoVis Conference in Sacramento, California on October 29, 2007.
This volume includes an introductory chapter and two chapters from the
work-shop’s invited speakers:The Real Work of Computer Network Defense Analystsby
Anita D’Amico and Kirsten Whitley, andVisAlert: From Idea to Productby
Ste-fano Foresti and Jim Agutter. All other papers were peer-reviewed by the VizSec program committee.
January 2008 John R. Goodall
Acknowledgements
We thank the VizSec 2007 Sponsor, NSA’s National Information Assurance Research Laboratory (NIARL), and the VizSec committee members:
Workshop Chair
• John R. Goodall, Secure Decisions division of Applied Visions, Inc.
Program Co-Chairs
• Kwan-Liu Ma, University of California at Davis
• Gregory Conti, United States Military Academy
Program Committee
• Kulsoom Abdullah, Georgia Institute of Technology
• Jim Agutter, University of Utah
• Stefan Axelsson, Blekinge Institute of Technology
• Anita D’Amico, Secure Decisions
• Glenn Fink, Pacific Northwest National Laboratory
• Deborah Frincke, Pacific Northwest National Laboratory
• John Gerth, Stanford University
• Patrick Hertzog, NEXThink S.A.
• Kiran Lakkaraju, University of Illinois at Urbana-Champaign
• Yarden Livnat, University of Utah
• Raffael Marty, Splunk
• Daniel Keim, University of Konstanz
• Stephen North, AT&T Research
• Penny Rheingans, UMBC
• Walt Tirenin, Air Force Research Laboratory
• Soon Tee Teoh, San Jose State University
• Kirsten Whitley, Department of Defense
Contents
Introduction to Visualization for Computer Security. . . 1
J.R. Goodall 1 Computer Security . . . 1
2 Information Visualization . . . 3
3 Visualization for Computer Network Defense . . . 5
3.1 Data Sources for Computer Network Defense . . . 6
3.2 VizSec to Support Computer Network Defense . . . 6
4 Papers in This Volume . . . 11
4.1 Users and Testing . . . 11
4.2 Network Security . . . 13
4.3 Communication, Characterization, and Context . . . 14
4.4 Attack Graphs and Scans . . . 15
5 Conclusion . . . 15
References . . . 16
The Real Work of Computer Network Defense Analysts . . . 19
A. D’Amico and K. Whitley 1 Introduction . . . 19
2 Related Work . . . 20
3 Methods . . . 22
4 Findings . . . 23
4.1 Data Transformation in CND Analysis . . . 24
4.2 CND Analysis Roles . . . 27
4.3 CND Analysis Workflow Across Organizations . . . 29
5 Implications for Visualization . . . 33
5.1 Visualization Across the CND Workflow . . . 33
5.2 Visualization as Part of a CND Analysis Environment . . . 35
References . . . 36
Adapting Personas for Use in Security Visualization Design. . . 39
J. Stoll, D. McColgin, M. Gregory, V. Crow, and W.K. Edwards 1 Introduction . . . 39
Measuring the Complexity of Computer Security Visualization Designs. . . 53
Visual Analysis of Network Flow Data with Timelines and Event
Plots . . . 85
D. Phan, J. Gerth, M. Lee, A. Paepcke, and T. Winograd 1 Introduction . . . 85
NetBytes Viewer: An Entity-Based NetFlow Visualization Utility for Identifying Intrusive Behavior. . . 101
T. Taylor, S. Brooks, and J. McHugh 1 Introduction . . . 101
Visual Analysis of Corporate Network Intelligence: Abstracting and Reasoning on Yesterdays for Acting Today. . . 115
D. Lalanne, E. Bertini, P. Hertzog, and P. Bados 1 Introduction . . . 115
2 Background . . . 117
3 On the Need to Support Visual Analysis . . . 118
3.1 Types of Analyses . . . 120
3.2 Analysis Tasks . . . 120
4 User and Application Centric Views of the Corporate Network . . . 122
Visualizing Network Security Events Using Compound Glyphs
Visually Understanding Jam Resistant Communication . . . 175
D. Schweitzer, L. Baird, and W. Bahn 1 Introduction . . . 175
F. Mansman, L. Meier, and D.A. Keim 1 Introduction . . . 187
2 Related Work . . . 189
2.1 Analysis of Application Ports . . . 190
2.2 Graph-Based Approaches for Network Monitoring . . . 190
2.3 Towards Visual Analytics for Network Security . . . 191
3.4 Abstraction and Integration of the Behavior Graph in HNMap . . . 196
3.5 Application and Evaluation . . . 197
4 Future Work . . . 200
5 Conclusions . . . 200
References . . . 201
Putting Security in Context: Visual Correlation of Network Activity with Real-World Information . . . 203
4 Future Work . . . 217
5 Conclusions . . . 218
References . . . 219
An Interactive Attack Graph Cascade and Reachability Display . . . 221
L. Williams, R. Lippmann, and K. Ingols 1 Introduction . . . 221
Intelligent Classification and Visualization of Network Scans. . . 237
C. Muelder, L. Chen, R. Thomason, K.-L. Ma, and T. Bartoletti 1 Introduction . . . 237
Using InetVis to Evaluate Snort and Bro Scan Detection on a Network Telescope . . . 255
B. Irwin and J.-P. van Riel 1 Introduction . . . 255
1.1 The Merits and Difficulties of Scan Detection . . . 256
2 Related Work . . . 257
2.1 Intrusion Detection and the False Positive Problem . . . 257
4.1 Network Telescope Traffic Capture . . . 262
4.2 Scan Detection Configuration and Processing . . . 262
4.3 Graphical Exploration and Investigation with InetVis . . . 264
5 Results and Analysis . . . 264
5.1 Address Scans and the Distribution of Unique Addresses . . . 265
5.2 Scans Discovered and Characterised with InetVis . . . 266
6 Future Work . . . 270
7 Conclusion . . . 271
Introduction to Visualization for Computer
Security
J.R. Goodall
AbstractNetworked computers are ubiquitous, and are subject to attack, misuse, and abuse. Automated systems to combat this threat are one potential solution, but most automated systems require vigilant human oversight. This automated approach undervalues the strong analytic capabilities of humans. While automation affords opportunities for increased scalability, humans provide the ability to handle excep-tions and novel patterns. One method to counteracting the ever increasing cyber threat is to provide the human security analysts with better tools to discover pat-terns, detect anomalies, identify correlations, and communicate their findings. This is what visualization for computer security (VizSec) researchers and developers are doing. VizSec is about putting robust information visualization tools into the hands of humans to take advantage of the power of the human perceptual and cognitive processes in solving computer security problems. This chapter is an introduction to the VizSec research community and the papers in this volume.
1 Computer Security
InThe Cuckoo’s Egg, astronomer-turned-systems administrator Cliff Stoll (Stoll,
1989) recounted his experience identifying and tracking a hacker through the nascent Internet in the mid-1980s. Through perseverance, creativity (he once dan-gled his keys over the telephone modem lines to create interference to slow down and frustrate the intruder), and extensive coordination and collaboration with other systems administrators, Stoll’s actions led to the uncovering of an international spy ring that had infiltrated U.S. military systems. The intruder was initially detected from a 75 cent accounting error.
J.R. Goodall
Secure Decisions Division of Applied Visions, Inc., 6 Bayview Ave. Northport, NY 11768, USA, e-mail: [email protected]
In the two decades since Stoll’s investigation, computer security has become an overriding concern of all types of organizations. New systems and protocols have been developed and adopted to prevent and detect network intruders. But even with these advances, the central feature of Stoll’s story has not changed: humans are still crucial in the computer security process. Administrators must be willing to patiently observe and collect data on potential intruders. They need to think quickly and cre-atively. They collaborate and coordinate their actions with colleagues. Humans are still as central to computer security today as they were 20 years ago. Technologies have evolved and many security processes have been automated, but the analytic capabilities and creativity of humans are paramount in many security-related prac-tices, particularly in intrusion detection, the focus of this chapter. Because of this, not all security work should be or can be automated. Humans are – and should be – central to security practice. This central feature of computer security is at the core of visualization for computer security (VizSec).
Many things have changed since Stoll’s time. In conjunction with the rapid growth of the Internet and increased organizational dependence on networked information technology, the frequency and severity of network-based attacks has increased drastically (Allen et al., 1999). At the same time, there is an inverse relationship between the decreasing expertise required to execute attacks and the increasing sophistication of those attacks; less skill is needed to do more damage (McHugh, 2001). As we have come more and more to rely on the ability to network computers and access information online, attacks are becoming more pervasive, easier to carry out, and more destructive.
Despite this increasing threat and concerted efforts on preventative security mea-sures, vulnerabilities remain. The reasons for these include: programming errors, design flaws in foundational protocols, and the insider abuse problem of legitimate users misusing their privileges (Lee et al., 2000). While it is theoretically possible to remove all security vulnerabilities through formal methods and better engineer-ing practices, practically it remains infeasible (Hofmeyr et al., 1998). Thus, even as security technologies and practices improve, the threat to network infrastructures remains.
Automated systems to combat this threat are one potential solution, but most automated systems require vigilant human oversight. This automated approach undervalues the strong analytic capabilities of humans. While automation affords opportunities for increased scalability, humans provide the ability to handle excep-tions and novel patterns. A technical report on intrusion detection technologies noted that while security vendors attempt to fully automate intrusion diagnosis, a more realistic approach is to involve the human in the diagnostic loop; computers can process large amounts of data, but cannot match humans’ analytic skills (Allen et al., 1999).
and how their work processes can be improved by taking advantage of the inherent strengths of both technology and humans.
One method to counteracting this ever increasing threat is to provide the human security analysts with better tools to discover patterns, detect anomalies, identify correlations, and communicate their findings. This is what VizSec researchers and developers are doing. VizSec is about putting robust information visualization tools into the hands of humans to take advantage of the power of the human perceptual and cognitive processes in solving computer security problems.
2 Information Visualization
Because of the vast amounts of data analysts work with, the need to recognize patterns and anomalies, and the importance of keeping humans in the loop, infor-mation visualization shows great potential for supporting computer security work. Put simply, information visualization turns data into interactive graphical displays. Information visualization takes advantage of the highest bandwidth human input device, vision, and human perceptual capabilities. Information visualization can be used for exploration, discovery, decision making, and to communicate complex ideas to others.
Information visualization is distinct from the broader field of data graphics. Infor-mation visualization is interactive; the user will have tools to adjust the display in order to gain a more meaningful understanding of the data being presented. Unlike scientific visualization, which is concerned with representing physically based data (such as the human body, molecules, or geography), information visualization rep-resents abstract data; to do so often requires creativity on the designers’ part since there is no existing structure to map the data to the graphical display. This is one of the inherent problems in developing an effective information visualization: mapping the data spatially in a meaningful manner. At the core of information visu-alization is the goal of amplifying cognition, the intellectual processes in which information is obtained, transformed, stored, retrieved, and used (Card, 2003). Infor-mation visualization is able to augment cognition by taking advantage of human perceptual capabilities.
system, which can expand working memory and the storage of information. Infor-mation visualization reduces the processes of searching by grouping inforInfor-mation together in a small, dense space. Pattern recognition, one of the key elements in recognizing intrusion detections, is another of the benefits of visualization, which emphasizes recognition rather than recall, another way in which working memory is expanded. Visual representations can often make an anomaly obvious to the user by taking advantage of human perceptual inference and monitoring abilities. Finally, information visualization encodes the data in a manipulable form that permits the user to browse and explore the data.
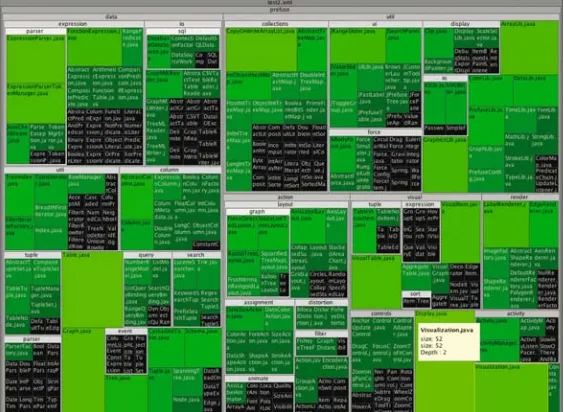
One of the most successful examples of an information visualization technique is the treemap. The original treemap layout was designed by Ben Shneiderman to effectively use display space when visualizing a hard drive’s files and their attributes, such as file size and type (Shneiderman, 1992). The treemap was a recursive algo-rithm that split the display space into rectangles alternating in horizontal and vertical directions. The size and the color of the leaf node rectangles can encode attributes of the data. In the original implementation visualizing a computer disk, color repre-sented file type and size reprerepre-sented file size. An example application of a treemap is an alternative method of viewing software source code, as shown in Fig. 1. In this example, nodes represent source code files organized into their package hierar-chy. Color is used to show the file’s last modification time, with green hues being more recently modified. Treemap visualizations have been adapted to many different applications of understanding hierarchical data, such as newsgroup activity, stock market performance, election results, and sports statistics. (For a history of treemaps and their many applications by Ben Shneiderman, see (Shneiderman, 2006)).
Fig. 2 The FilmFinder information visualization application combining a starfield display with dynamic queries. c1994 ACM, Inc. Included here by permission
FilmFinder, shown in Fig. 2, is an early example of an information visualiza-tion that highlights the importance of interacvisualiza-tion (Ahlberg and Shneiderman, 1994). FilmFinder combines a starfield display, a scatterplot where each data item is
repre-sented by a point, with dynamic queries so that the display is continuouslyupdated
as the user filters to refine the selection. This is an excellent example of the
impor-tance of interaction in information visualization. The display itself is fairly simple,
time is plotted on thexaxis and ratings on theyaxis with color coded to genre.
But the dynamic queries through sliders and other widgets prevent user errors and
instantly show the results of complex queries. The system is an exemplarof the
visual information-seeking mantra: overview first, zoom and filter, then details on
demand (Shneiderman, 1996). This approach encourages exploration and
under-standing of the data set as a whole, while providing a method for drilling down to the actual data details. Many of the VizSec systems described below follow this methodology.
3 Visualization for Computer Network Defense
There are many potential applications of information visualization to the problems of computer security, including:
– Visualization for detecting anomalous activity – Visualization for discovering trends and patterns – Visualization for correlating intrusion detection events – Visualization for computer network defense training – Visualization for offensive information operations
– Visualization for seeing worm propagation or botnet activity – Visualization for forensic analysis
– Visualization for understanding the makeup of malware or viruses – Visualization for feature selection and rule generation
– Visualization for communicating the operation of security algorithms
with the defense of enterprise networks from outside attack or insider abuse. This section will focus on the data sources and results of the research into visualization for computer network defense (CND).
3.1 Data Sources for Computer Network Defense
The research of VizSec for CND can be organized according to the level of network-ing data to be visualized. At the base, most raw level is a network packet trace. A packet consists of the TCP/IP header (which defines how a packet gets from point A to point B) and payload data (the contents of the packet). At a higher level of abstraction is a network flow. Originally developed for accounting purposes, net-work flows have been increasingly used for computer security applications. A flow is an aggregated record of the communications between two distinct machines. A flow is typically defined by the source and destination Internet Protocol addresses, the source and destination ports, and the protocol. Flows are much more compact than packet traces, but sacrifice details and have no payload data. At a higher level of abstraction are automated systems that reduce network data to information such as an intrusion detection system (IDS). An IDS examines network traffic and auto-matically generates alerts of suspicious activity. All three of these levels operate on the enterprise network level. At a finer level of granularity is the visualization of data about individual computer systems or applications, and at a higher level is the visualization of data about the Internet.
The remainder of this section will describe a selection of VizSec research that targets the enterprise network level, which is generally the focus of CND.
3.2 VizSec to Support Computer Network Defense
This section presents representative visualization research projects for each of the levels of enterprise network security. The examples presented here each solve an important problem. Rumint facilitates the understanding of packet payloads; tnv allows analysts to move from a high-level overview of packet activity to raw details; NVisionIP enables analysts to use visualization to create automation rules; FlowTag assists collaboration and sharing through tagging of data; VisAlert enables the inte-gration of multiple data sources through a what, where, when paradigm; and IDS Rainstorm highlights the importance of multiple, linked views at different levels of semantic detail.
3.2.1 Packet Trace Visualizations
Fig. 3 Rumint visualization: binary rainfall visualization where each row represents a packet and each column in the row represents a bit in the packet (left), and byte frequency visualization where each row represents one of 256 byte values and each column in the row represents the frequency of that byte in the packet (right). c2006 IEEE, Inc. Included here by permission
source for analyzing security events, but is typically collected and analyzed on an ad hoc basis, not systematically, since the data can become very large. To help analysts cope with this copious packet data, researchers are looking at ways to visualize packet headers and payloads.
One example is rumint, shown in Fig. 3, which uses a novel visualization called binary rainfall, in which each packet is plotted one per row where each pixel rep-resents a bit in the packet (Conti et al., 2006, 2005). Multiple packets are shown in time series order at multiple semantic levels. An additional view presents a byte frequency visualization, where each packet is plotted on a row where each pixel represents byte values of 0–255. Pixels for each row are drawn according to the frequency of that byte in the packet. The system is unique in that it provides a graphical plotting of packet payload data, plotted according to the bit value. Rumint also includes other views into the data, such as a parallel coordinate plot to show network connections.
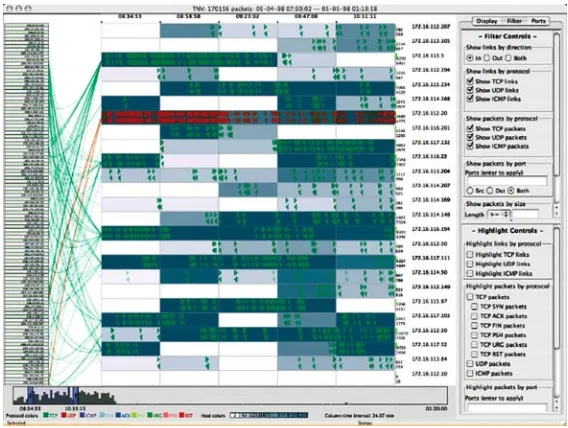
Fig. 4 Tnv visualization showing 170,000 packets. Remote hosts at the left and local hosts at the right of the display, with links drawn between them; packets are drawn for local hosts over time and color is used to represent protocol and packet frequency for a time period
once by dividing the available screen real estate between local and remote hosts. In addition to being able to display more hosts at a time, this partitioning also fits well with analysts’ perceptions of what they deem to be important. Because local hosts are of primary concern in ID analysis, the majority of the display space is devoted to the local hosts. The details of individual packets can be displayed on demand.
3.2.2 Network Flow Visualizations
Network flows are aggregations of packet traces according to the hosts, ports, and protocol involved. Because it is aggregated, flows can be systematically collected and stored, and then used in forensic analysis when an intrusion occurs or monitored for anomalous activity. In either case, the volume of data makes textual analysis dif-ficult and a number of researchers are looking at visualization methods for analyzing flow data.
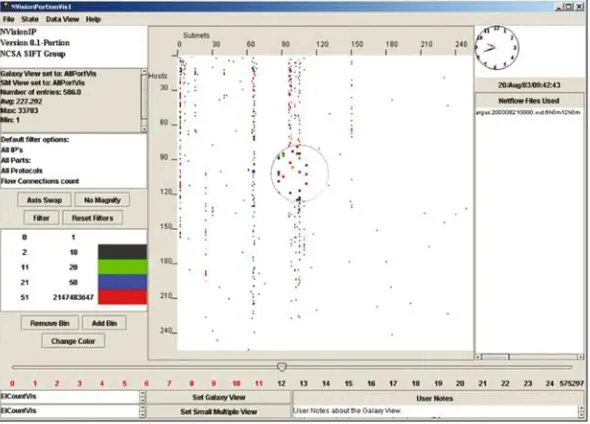
Fig. 5 NVisionIP visualization’s galaxy view, a scatterplot that puts subnets (the third octet of the class-B network) along thexaxis and hosts (the fourth octet) along theyaxis to present an overview of network flows for a class-B network. Animation can be used to visualize traffic flows over time. c2004 ACM, Inc. Included here by permission
increasingly common in VizSec applications in the years to come. Machines excel at pattern matching, humans excel at recognizing novel patterns. This approach allows for both machines and humans to do what they do best.
FlowTag, shown in Fig. 6, is a system to visualize network flows and to tag the data to support analysis and collaboration (Lee and Copeland, 2006). Tagging allows analysts to label key elements during the analytic process to reduce the cog-nitive burden of analysis and maintain context. Tagging can also be used for sharing and collaboration. Tagging has become popular recently with social networking and social bookmarking sites; adapting the concept to CND should be encouraged in all VizSec applications. FlowTag brings the popular concept of tagging to the problems of analyzing and sharing network security data.
3.2.3 Alert Visualizations
Fig. 6 FlowTag visualization showing flow connection information on a parallel coordinate plot of destination port on one axis and source IP address on the other organized in order of appearance; color represents the selection state. c2006 ACM, Inc. Included here by permission
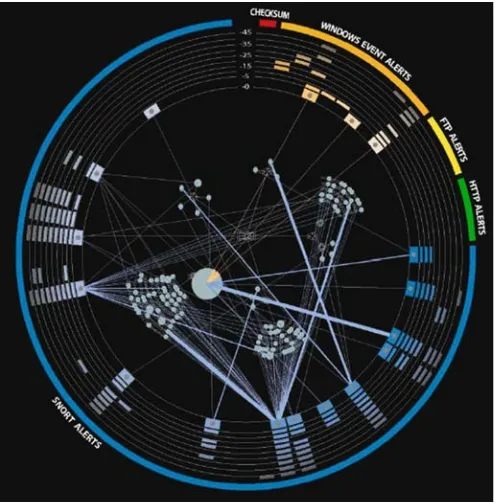
VisAlert is a flexible visualization that correlates multiple data sources, such as IDS alerts and system logs files (Livnat et al., 2005a, b). Correlation is based on the What, When and Where attributes of the data. VisAlert, shown in Fig. 7, inte-grates these into a single display depicting alerts as vectors between the perimeter, representing alert time (when) and type (what), and the interior, representing net-work topology (where), of a radial view. This system represents one of the more sophisticated and novel visualizations to solve the important problem of correlating disparate events. This is a significant example of a novel approach to support the integration of multiple data sources within a unified display.
Fig. 7 VisAlert visualization of correlated intrusion detection alerts showing alerts along outer rings and network topology maps in the center. c2005 IEEE, Inc. Included here by permission
4 Papers in This Volume
The papers collected in this volume were presented at the Fourth VizSec Workshop for Computer Security, held in conjunction with IEEE Vis and InfoVis in Sacra-mento, California in 2007. This collection presents the state of the art in VizSec research.
4.1 Users and Testing
Anita D’Amico and Kirsten Whitley open this volume with an invited chapter
enti-tled The Real Work of Computer Network Defense Analysts: The Analysis Roles
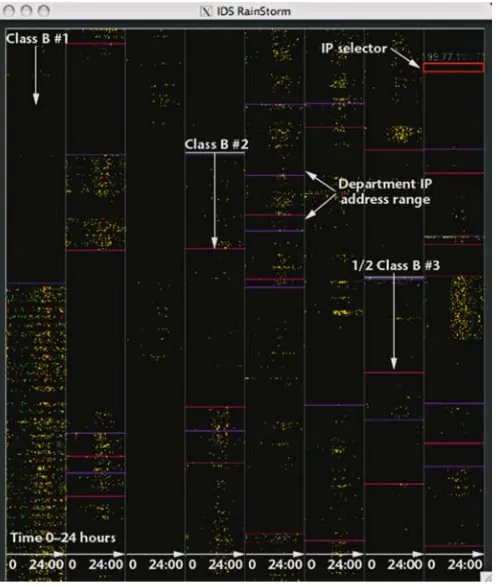
Fig. 8 IDS Rainstorm maps intrusion detection alerts to pixels in the overview visualization that wraps columns of IP address activity over a 24 h time period. c2006 IEEE, Inc. Included here by permission
description of the analysis roles in CND, and CND analysts’ workflow across orga-nizations. The authors conclude by linking their findings to visualization design; drawing valuable implications for future VizSec researchers and developers.
Jennifer Stoll, David McColgin, Michelle Gregory, Vern Crow, and W. Keith
Edwards apply a user-centered design method to VizSec inAdapting Personas for
Use in Security Visualization Design. The authors turn to human–computer interac-tion and participatory design research to solve the problem of requirements capture by using personas. Personas are an archetype description of a system’s target users that provide a framework for organizing requirements. Rather than approach users for feedback on design, designers can turn to the personas to simulate how well a design meets user requirements. This chapter demonstrates how user-centered design methodologies can be applied to VizSec software development.
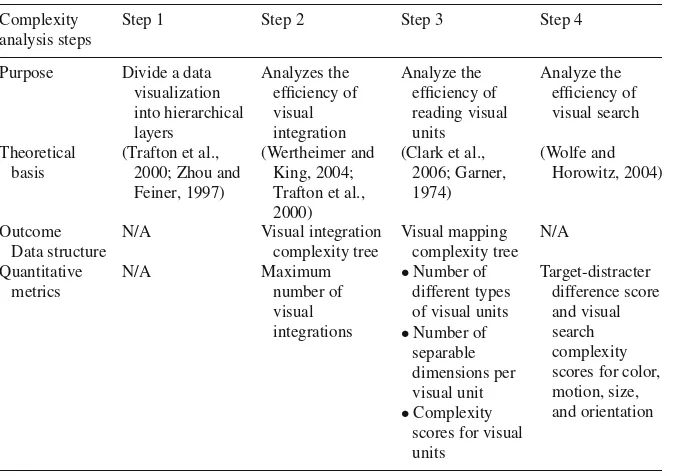
Xiaoyuan Suo, Ying Zhu, and G. Scott Owen focus on evaluating VizSec
soft-ware inMeasuring the Complexity of Computer Security Visualization Designs. The
that affect the ability of users to understand a visualization. Complexity is measured across several dimensions, including visual integration, separable dimensions for each visual unit, the complexity of interpreting the visual attributes, and the effi-ciency of visual search. The authors demonstrate the complexity analysis method with two VizSec applications, rumint and tnv, which were described in Sect. 3.2.1.
Tamara H. Yu, Benjamin W. Fuller, John H. Bannick, Lee M. Rossey, and Robert K. Cunningham address the difficulty of supporting network testbed
opera-tions inIntegrated Environment Management for Information Operations Testbeds.
Network testbeds are crucial in the design and testing of information operations software, but as testbeds become more realistic, they also become more complex to set up and manage. The authors present a visual interface that facilitates test specification, testbed control, and testbed monitoring through multiple information visualization techniques.
4.2 Network Security
Doantam Phan, John Gerth, Marcia Lee, Andreas Paepcke, and Terry Winograd
present a VizSec system called Isis inVisual Analysis of Network Flow Data with
Timelines and Event Plots, which was named the workshop’s Best Paper winner. Isis supports the analysis of network flow data through two visualization meth-ods, progressive multiples of timelines and event plots, to support the iterative investigation of intrusions. Isis combines visual affordances with structured query language (SQL) to minimize user error and maximize flexibility. Isis keeps a history of a user’s investigation, easily allowing a query to be revisited and a hypothesis to be changed. A detailed case study using anonymized data of a real intrusion demonstrates the features of Isis.
Teryl Taylor, Stephen Brooks, and John McHugh present another VizSec system
for network flow analysis inNetBytes Viewer: An Entity-Based NetFlow
Visualiza-tion Utility for Identifying Intrusive Behavior. NetBytes Viewer plots network flow data per port of an individual host machine or subnet on a network over time in 3D.
TheZ axis displays the ports, theX axis displays time, and theY axis displays the
magnitude of traffic (in flows, packets, or bytes) seen by the host (or subnet) in an hour.
Denis Lalanne, Enrico Bertini, Patrick Hertzog, and Pedro Bados describe a
visu-alization approach to support multiple user roles inVisual Analysis of Corporate
Jason Pearlman and Penny Rheingans take a service-oriented perspective to
visu-alizing network traffic in Visualizing Network Security Events Using Compound
Glyphs from a Service-Oriented Perspective. The authors present a node-link visu-alization in which each node is represented as a compound glyph that provides an indication of the node’s service usage. Time slicing is also used in these glyphs to provide an indication of time.
Barry Irwin and Nicholas Pilkington attempt to map large IP spaces using Hilbert
curves inHigh Level Internet Scale Traffic Visualization Using Hilbert Curve
Map-ping. Network telescope (also called DarkNets) are large collections of IP space with no hosts; all traffic collected on a network telescope is sent to a non-existant host. These dead end communications are never legitimate and provide indications of backscatter, scanning, and worm activity. The authors use Hilbert curves, a space filling curve that preserves locality (i.e., ordered data will remain ordered along the curve), to map the activity on large network telescopes.
4.3 Communication, Characterization, and Context
Stefano Foresti and James Agutter present their experience with the design of a
VizSec system in VisAlert: From Idea to Product. VisAlert, described above in
Sect. 3.2.3, is a VizSec system that can correlate data from multiple sources into a unified visualization. In this invited chapter, the authors describe the design process from the conception of rough visual sketches to the implementation and deployment of a production-ready software and the issues that the design team had to address to carry the project from concept to product.
Dino Schweitzer, Leemon Baird, and William Bahn present a visualization of
their security algorithm inVisually Understanding Jam Resistant Communication.
Their algorithm, BBC, is based on a new type of coding theory known as concur-rent codes that is resistant to traditional jamming techniques. The authors found it difficult to explain the formal definition and proofs to non-mathematicians, and so turned to visualization as a communication device to visually demonstrate the algorithm’s effectiveness.
Florian Mansman, Lorenz Meier, and Daniel A. Keim present an approach to
visualizing host behavior inVisualization of Host Behavior for Network Security.
The authors use a force-directed graph layout to look at changes in host behavior over time to assist in the detection of uncommon behavior. A node represents the state of one host for a specic interval and its position is determined by its state at that interval. So as hosts’ states change, their position also changes, allowing analysts to easily see changes over time.
William A. Pike, Chad Scherrer, and Sean Zabriskie focus on bringing context
into visualization in Putting Security in Context: Visual Correlation of Network
necessary analytic step, the authors demonstrate a system, called NUANCE, that creates behavior models for network entities at multiple levels of abstraction and fuses these models with contextual information on current threats and exploits from textual data sources.
4.4 Attack Graphs and Scans
Leevar Williams, Richard Lippmann, and Kyle Ingols present an elegant solution
to visualizing attack graphs inAn Interactive Attack Graph Cascade and
Reacha-bility Display. Attack graphs present potential critical paths that could be used by adversaries to compromise networked hosts based on their known vulnerabilities. Attack graphs are useful for understanding the vulnerability level of a network, but are often too complex to understand. The authors present a visual solution for attack graph comprehension based on treemaps. Multiple treemaps are used to cluster host groups in each subnet. Hosts within each treemap are grouped based on reachability, attacker privilege level, and prerequisites.
Chris Muelder, Lei Chen, Russell Thomason, Kwan-Liu Ma, and Tony Bartoletti combine machine learning and visualization to tackle the problem of classifying
scanning activity inIntelligent Classification and Visualization of Network Scans.
The authors present a system that uses associative memory learning techniques to compare network scans in order to create classifications. The classifications can be used with visualization to characterize the source of scans.
Barry Irwin and Jean-Pierre van Riel describe a 3D visualization for traffic
analysis in Using InetVis to Evaluate Snort and Bro Scan Detection on a
Net-work Telescope. Source IP address, destination IP address, and destination port are mapped to the three axes in InetVis for TCP and UDP traffic and a separate plane is shown below this cube (with no port information) for ICMP traffic. InetVis also incorporates textual filtering and querying using the powerful and flexible the Berkeley Packet Filter syntax. The authors use the visualization to examine the scan detection capabilities two IDSs to identify possible flaws in those scan detection algorithms.
5 Conclusion
References
Abdullah, K., Lee, C., Conti, G., Copeland, J.A., Stasko, J.: Ids rainstorm: Visualizing ids alarms. In: Proceedings of the IEEE Workshop on Visualization for Computer Security (VizSEC), pp. 1–10 (2005)
Ahlberg, C., Shneiderman, B.: Visual information seeking using the filmfinder. In: ACM Confer-ence Companion on Human Factors in Computing Systems (CHI), pp. 433–434. ACM, New York (1994)
Allen, J., Christie, A., Fithen, W., McHugh, J., Pickel, J., Stoner, E.: State of the prac-tice of intrusion detection technologies. Tech. Rep. CMU/SEI-99-TR-028, Carnegie Mellon University/Software Engineering Institute (1999)
Card, S.K.: Information visualization. In: Jacko, J.A., Sears, A. (eds.) The Human Computer Interaction Handbook, pp. 544–582. Lawrence Erlbaum Associates, Mawah, NJ (2003) Card, S.K., Mackinlay, J.D., Shneiderman, B. (eds.): Information Visualization: Using Vision to
Think. Morgan Kaufman, San Francisco, CA (1999)
Conti, G., Grizzard, J., Ahamad, M., Owen, H.: Visual exploration of malicious network objects using semantic zoom, interactive encoding and dynamic queries. In: Proceedings of the IEEE Workshop on Visualization for Computer Security (VizSEC), pp. 83–90 (2005)
Conti, G., Abdullah, K., Grizzard, J., Stasko, J., Copeland, J.A., Ahamad, M., Owen, H., Lee, C.: Countering security analyst and network administrator overload through alert and packet visualization. IEEE Computer Graphics and Applications26(2), 60–70 (2006)
Eick, S.G., Steffen, J.L., Eric, E., Sumner, J.: Seesoft-a tool for visualizing line oriented software statistics. IEEE Transactions on Software Engineering18(11), 957–968 (1992)
Goodall, J.R., Lutters, W.G., Rheingans, P., Komlodi, A.: Preserving the big picture: Visual net-work traffic analysis with tnv. In: Proceedings of the IEEE Workshop on Visualization for Computer Security (VizSEC), pp. 47–54. IEEE Press, New York (2005)
Goodall, J.R., Lutters, W.G., Rheingans, P., Komlodi, A.: Focusing on context in network traffic analysis. IEEE Computer Graphics and Applications26(2), 72–80 (2006)
Hofmeyr, S.A., Forrest, S., Somayaji, A.: Intrusion detection using sequences of system calls. Journal of Computer Security6(3), 151–180 (1998)
Lakkaraju, K., Yurcik, W., Lee, A.J.: Nvisionip: Netflow visualizations of system state for security situational awareness. In: Proceedings of the ACM Workshop on Visualization and Data Mining for Computer Security (VizSEC/DMSEC), pp. 65–72 (2004)
Lakkaraju, K., Bearavolu, R., Slagell, A., Yurcik, W.: Closing-the-loop: Discovery and search in security visualizations. In: Proceedings of the IEEE Workshop on Information Assurance and Security (IAW), pp. 58–63 (2005)
Lee, C.P., Copeland, J.A.: Flowtag: A collaborative attack-analysis, reporting, and sharing tool for security researchers. In: Proceedings of the ACM Workshop on Visualization for Computer Security (VizSEC), pp. 103–108. ACM, New York (2006)
Lee, W., Stolfo, S.J., Mok, K.W.: Adaptive intrusion detection: A data mining approach. Artificial Intelligence Review14(6), 533–567 (2000)
Livnat, Y., Agutter, J., Moon, S., Erbacher, R.F., Foresti, S.: A visualization paradigm for net-work intrusion detection. In: Proceedings of the IEEE Workshop on Information Assurance and Security (IAW), pp. 92–99 (2005a)
Livnat, Y., Agutter, J., Shaun, M., Foresti, S.A.F.S.: Visual correlation for situational awareness. In: Agutter, J. (ed.) IEEE Symposium on Information Visualization (InfoVis), pp. 95–102 (2005b) McHugh, J.: Intrusion and intrusion detection. International Journal of Information Security1(1),
14–35 (2001)
Shneiderman, B.: Tree visualization with tree-maps: 2-d space-filling approach. ACM Transactions on Graphics11(1), 92–99 (1992)
Shneiderman, B.: Treemaps for space-constrained visualization of hierarchies (2006). http://www. cs.umd.edu/hcil/treemap-history/
The Real Work of Computer Network
Defense Analysts
The Analysis Roles and Processes that Transform
Network Data into Security Situation Awareness
A. D’Amico and K. Whitley
AbstractThis paper reports on investigations of how computer network defense (CND) analysts conduct their analysis on a day-to-day basis and discusses the impli-cations of these cognitive requirements for designing effective CND visualizations. The supporting data come from a cognitive task analysis (CTA) conducted to base-line the state of the practice in the U.S. Department of Defense CND community. The CTA collected data from CND analysts about their analytic goals, workflow, tasks, types of decisions made, data sources used to make those decisions, cognitive demands, tools used and the biggest challenges that they face. The effort focused on understanding how CND analysts inspect raw data and build their comprehension into a diagnosis or decision, especially in cases requiring data fusion and correla-tion across multiple data sources. This paper covers three of the findings from the CND CTA: (1) the hierarchy of data created as the analytical process transforms data into security situation awareness; (2) the definition and description of different CND analysis roles; and (3) the workflow that analysts and analytical organizations engage in to produce analytic conclusions.
1 Introduction
As government and business operations increase their reliance on computer net-works and the information available on them, defending these valuable netnet-works and information has become a necessary organizational function. Risks have appeared from many sources. The online world is witnessing increasingly sophisticated tech-nical and social attacks from organized criminal operations. Moreover, an estimated
A. D’Amico
Secure Decisions division of Applied Visions, Inc.
K. Whitley
Department of Defense
120 countries are using the Internet for political, military or economic espionage (McAfee, 2007).
The broad area of cyber security encompasses policy and configuration decisions, virus scanning, monitoring strategies, detection and reaction. In the commercial world, the domain of expertise for securing and defending information resources is referred to as information security (InfoSec). U.S. governmental organizations use the synonymous terms computer network defense (CND) and defensive information operations (DIO).
This paper treats the topic of CND analysis from the perspective of the peo-ple working as professional CND analysts. We discuss how their user requirements should apply to the design of CND visualization tools. To describe the nature of CND analysis, we draw upon a cognitive task analysis (CTA) that we conducted in the 2004–2005 timeframe using mainly CND analysts working within U.S. Department of Defense (DOD) organizations. D’Amico et al. (2005) provides a pre-liminary report on that work. The research was designed to gain a full understanding of the daily CND analysis process. Three design considerations were: to understand both the similarities and differences in how network data was analyzed across differ-ent organizations; to include analysts whose responsibilities ranged from defending local networks to looking for attacks more broadly across a community (i.e., the notion of enclave, regional and community monitoring); and to include perspectives stemming from both tactical and strategic missions.
The CTA research was undertaken with several goals in mind, including to serve as foundation material for tool developers who do not have easy access to CND analysts and to provide requirements for the design of successful visualization for computer security. These goals also motivate this paper. This paper summarizes three findings from the CTA: (1) the hierarchy of data created as the analytical process transforms data into security situation awareness; (2) the definition and description of different CND analysis roles; and (3) the workflow that analysts and analytical organizations engage in to produce analytic conclusions. We pinpoint cognitive needs of CND analysts, rather than the software and system requirements. The analytic process is a joint (both human and machine) cognitive system, and the pipeline of CND analysis will not be automated in the near future. The needs of human analysts will remain a critical component of successful CND and should be considered when designing CND visualizations.
2 Related Work
The CND mission is succinctly summarized by Sami Saydjari: “Imagine that you lead an organization under computer attack on your critical information systems.
What questions are you likely to ask?Am I under attack; what is its nature and
To answer these questions, CND analysts are responsible for tasks such as col-lecting and filtering computer network traffic, analyzing this traffic for suspicious or unexpected behavior, discovering system misuse and unauthorized system access, reporting to the appropriate parties and working to prevent future attacks. CND ana-lysts consult the output of automated systems that provide them with network data that have been automatically collected and filtered to focus the analyst’s attention on data most likely to contain clues regarding attacks. These automated systems (such as firewalls, border gateways, intrusion detection systems (IDSs), anti-virus systems and system administration tools) produce log files and metadata that the analyst can inspect to detect suspicious activities.
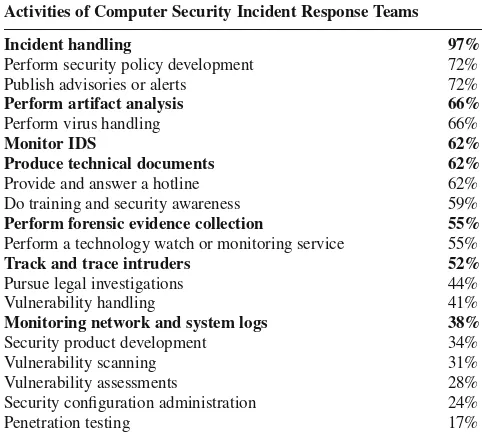
To gauge the missions and analytic tasks across the CND community, Carnegie Mellon University (Killcrece et al., 2003) conducted a study of 29 Computer Secu-rity Incident Response Teams (CSIRTs), of which 29% were military, and listed the major activities of the teams surveyed. A summary appears in Table 1 along with the percentage of organizations reporting these activities. The bold typeface high-lights those activities that were of interest to our CND CTA research. Our research focused on understanding how CND analysts inspect raw data and build their com-prehension into a diagnosis or decision, especially in cases requiring data fusion and correlation across multiple data sources. The CTA did not include the work of vulnerability assessments, penetration testing, insider threat or malware analysis.
The CMU study also categorized CND activities or functions into three groups: reactive, proactive, and security quality management. Reactive activities are trig-gered by a preceding event or request such as a report of wide-spreading malicious
Table 1 The major activities performed by CND analysts and percentages of organizations
reporting these activities (Killcrece et al., 2003)
Activities of Computer Security Incident Response Teams
Incident handling 97%
Provide and answer a hotline 62% Do training and security awareness 59%
Perform forensic evidence collection 55%
Perform a technology watch or monitoring service 55%
Track and trace intruders 52%
Pursue legal investigations 44% Vulnerability handling 41%
Monitoring network and system logs 38%
Security product development 34% Vulnerability scanning 31% Vulnerability assessments 28% Security configuration administration 24%
code or an alert identified by an IDS or network logging system. Looking to the past, reactive tasks include reviewing log files, correlating alerts in search of pat-terns, forensic investigation following an attack and identification of an attacker who has already penetrated the network. Looking to the future, proactive activities are undertaken in anticipation of attacks or events that have not yet manifested. Proac-tive tasks include identifying new exploits before they have been used against the defended network, predicting future hostile actions and tuning sensors to adjust for predicted attacks. Security quality management activities are information technol-ogy (IT) services that support information security but that are not directly related to a specific security event; these include security training, product evaluation, and disaster recovery planning. Killcrece et al. reported, and our CTA results support, the fact that most CND analysis work is reactive, not proactive. In the CND CTA, we looked for examples of proactive work; however, the majority of the analytic activity was reactive. In describing the analysis roles below, we note instances in which proactive tasks can occur.
Alberts et al. (2004) extended the work of Killcrece et al. in a report that advo-cates best-practice workflows for effective incident management. Their models represent what incident response should or could be and do not necessarily represent the actual experiences of most CND analysts. By comparison, our CTA studied the state of the practice, sought to understand the existing factors that impede success-ful analysis and identified opportunities to improve situation awareness. Biros and Eppich (2001) conducted a CTA of rapid intrusion detection analysts (which include triage and aspects of escalation analysis, as defined below) in the U.S. Air Force and identified four requisite cognitive abilities: recognizing non-local Internet Protocol (IP) addresses, identifying source IP addresses, developing a mental model of nor-mal, and sharing knowledge. We used their work as a starting point, but studied the larger range of CND analysis beyond triage analysis and beyond the Air Force.
3 Methods
processes and activities (cognitive, communicative and perhaps physical) that they engage in to reach those decisions.
During the CTA described in this paper, 41 CND professionals working in seven different organizations participated. Most were currently active analysts; a few were managers who were not performing analysis on a day-to-day basis. They varied in level of expertise and represented a variety of job titles and work roles, as defined by their organizations. We focused on CND analysts who look at network traffic and related data to determine whether the information assets are under attack and who the attacker is. To collect data, we used a combination of four knowledge capture techniques: semi-structured interviews, observations, review of critical incidents and hypothetical scenario construction. In semi-structured interviews, the researcher guided discussion with an analyst by using a checklist of questions, yet also used wide latitude to encourage the subject to describe the day-to-day work in detail. Observations involved watching analysts at work combined with asking questions to clarify the process. Review of critical incidents involved dissecting past incidents that challenged the analyst’s skills. The technique of scenario construction involved working with analysts to flesh out an imaginary analysis case of typical offensive actions taken by a sophisticated attacker and defensive actions taken by the CND analyst. Scenario construction allowed analysts to reveal the kinds of information they seek from available data sources, knowledge of adversary operations and tech-niques, and types of connections they make between seemingly disparate pieces of information.
4 Findings
While the organizations participating in the CTA differed in their stated mission (such as protecting a single network, identifying trends in computer attacks across the entire DOD, or performing CND services for customers outside one’s own orga-nization), they had much in common. This overlap, however, was obscured by the lack of standard terminology. Whereas various members of the community used
common terms (e.g.,eventandalert), they often used the terms differently or
on exceptional cases. In these findings, we use a standardized vocabulary, not in a prescriptive way, but as a way to illuminate the CND process data for the purpose of the CTA.
4.1 Data Transformation in CND Analysis
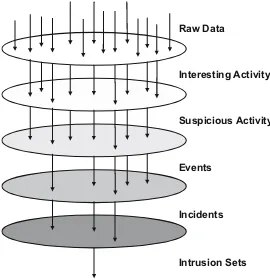
As a CND analyst works, data are filtered, sorted, retained or discarded based on the analyst’s responsibilities and expertise. Different responsibilities involve differ-ent data. For example, some analysts primarily review the newest packet traffic or sensor data; others concentrate on data that have already been identified as suspi-cious, but require further analysis and correlation with additional data sources. As we discussed this process with the analysts, we ascertained that, as analysis pro-ceeds, data are transformed as an analyst’s confidence in an analytic conclusion increases. The cognitive transformation can be seen as a hierarchy of data filters with the levels reflecting the increasing certainty that a reportable security violation has been identified (depicted in Fig. 1). It is worthwhile to note that the volume of data generally decreases from level to level.
Raw Data
Interesting Activity
Suspicious Activity
Events
Incidents
Intrusion Sets
Raw dataare the most elemental data in the hierarchy. At the start of the entire CND analytic workflow, the raw data can be network packet traffic, netflow data or host-based log data. Especially because the amount of raw data is so large, ana-lysts do not generally inspect all raw data. Instead, raw data are passed through an automated process (e.g., an IDS) that makes initial filtering decisions (e.g., based on attack signatures). The automated filtering results in a substantially reduced amount of data requiring human attention.
Interesting activityrefers to the data that has been flagged by the initial automated
filter and sent to a CND analyst for inspection. We heard it referred to asactivity,
alerts,alarms, data, logsandinteresting activity. Some analysts objected to the term
alertsbecause they felt strongly that activity is not an alert until a human analyst
has inspected and verified that the activity is worthy of further attention. Interest-ing activity might be presented to the CND analyst in the form of packet header data from TCPDUMP or as an IDS alert. Depending on the techniques employed by the automated filter, the interesting activity may be largely composed of false positives. Analysts perform triage on interesting activity, examining the alert details and related data, throwing out false positives and retaining the remainder for closer inspection.
Suspicious activity remains after the triage process because the CND analyst
believes that the activity is anomalous for the monitored network or because it adheres to a signature or attack pattern associated with malicious intent. Some CTA
participants called this type of activity an event, anomalyor suspicious activity.
Examples of suspicious activity include a series of scans from the same source IP address; an unusual increase in traffic to or from a server inside the network; virus infections on several workstations in a short time period; and misuse of the monitored network by employees downloading inappropriate content.
Event refers to suspicious activity that a CND analyst has a responsibility to
report, based on the organization’s mission and policies. For example, an organiza-tion might be charged to report only on certain types of intrusion attempts and not on employee policy violations (e.g., using unauthorized peer-to-peer software); in this case, a policy violation would not be escalated as an event.
At the level of events, the volume of data has been significantly reduced from that of raw data. It is also the point at which CND analysts begin grouping indi-vidual activity based on common characteristics (such as source and destination IP addresses, time, attack characteristics or attacker behavior). Along the analy-sis workflow, CND analysts are also expanding their understanding of the data by searching for and adding new facts that show the extent of the security viola-tion including the actors, machines, and informaviola-tion that has been compromised. The work for the CND analyst inspecting event data is to confirm that a security violation has occurred and to provide as full an understanding as possible of the violation.
Incidentis the point when a CND analyst(s) has confirmed the occurrence and
analyst prepares a formal report describing the incident. After any required approval, the incident report is released as an official analytic product. Some organizations have more than one type of reports (e.g., a rapid-release distribution mechanism to distribute early information as quickly as possible and a formal reporting mechanism which is the finalized incident description). Within the DOD, official incidents are assigned to the responsible party for incident handling. Incidents may be tagged with a category type or priority ranking. Currently, there is no international consensus on incident categories or how to measure incident severity.
Incident reports are distributed to interested parties based on factors like category type and official reporting chain. The topic of report distribution and data sharing is closely related to the fact that CND analysis is often done collaboratively across organizations. Monitoring often takes place at enclave, regional and community lev-els with formal or informal collaboration and sharing across levlev-els. For example, in the DOD, CND analysis occurs at individual military bases (i.e., enclave level), at the military service level (i.e., regional level) and across the entire DOD (i.e., com-munity level). Data and reports flow up and down this reporting chain. Currently, the Joint Task Force for Global Network Operations (JTF-GNO) provides DOD community-wide analysis. For state and local governments, US-CERT, operated by the Department of Homeland Security (DHS), provides the community level. In the commercial world, companies have corporate monitoring (i.e., enclave or regional level) and may also report to a community service (e.g., a financial institution may participate in the Financial Services Information Sharing and Analysis Center (FS-ISAC)). In the case of Managed Security Service Providers (MSSPs), incidents are reported to individual customers (i.e., enclave level); an MSSP might also perform trend analysis across its entire customer base.
The benefit of wider analysis at the community level is indisputable. Aside from individual enclave concerns about the sensitivity of their data, the value of grouping CND data stems from the fact that certain incidents cannot be fully understood within a single enclave. When protecting national interests, it is important to detect related activity and larger trends occurring across individual enclaves.
Intrusion sets are sets of related incidents. In the organizations we visited,
intrusion setsandproblem setswere essentially synonymous terms. Intrusion sets
4.2 CND Analysis Roles
We wanted to understand whether and how analysis duties are divided across ana-lysts and organizations. However, we were initially confronted with the lack of any
functional descriptions of jobs performed by the analysts. Job titles, such aslevel 1
analystorlead analyst, varied considerably across organizations. Furthermore, an
analyst with a single job title, such as lead analyst, often performed many roles,
such as rapid intrusion detection, consultation with other analysts and even training of junior analysts. In considering how to address this lack of common descriptions, we decided to categorize analytical function based on the actual tasks performed. The result of this exercise was a set of six broad analysis roles that accounted for all of the cognitive work observed: triage analysis, escalation analysis, correlation analysis, threat analysis, incident response and forensic analysis.
These roles represent categories of analysis; the roles do not directly map to job titles. An analyst with a single job title may perform work across more than one of the analysis roles. The roles illuminate the amount and types of data that the analyst is integrating and the goal of the analysis. The roles also reflect authority boundaries imposed by law and policy (e.g., relating to privacy). Some of the roles align closely with reactive analysis; some include aspects of proactive analysis.
Triage analysisis the first look at the raw data and interesting activity. The triage
decision is a relatively fast decision about whether the data warrants further analysis. Triage encompasses weeding out false positives and escalating interesting activity for further analysis, all within a few minutes of viewing the data. Commonly, an analyst inspects IDS alerts and the immediate associated traffic/flow metadata and/or packet contents.
The majority of analysts in the CND CTA performed triage analysis. It is also very common that novice CND analysts are first assigned the job of triage analysis and work under the guidance of more senior analysts. The triage cases that novices encounter provide on-the-job training that increases the range of security violations that they can easily recognize.
Triage analysis is reactive in nature, since it is based on reviewing and sorting activity that has already occurred. Within the CTA, we encountered the following
relevant CND job titles:level 1 analyst,first responderandreal-time analyst. For
the organizations in the CTA, analysts with these job titles spent the majority of their time performing triage analysis. In a small organization or at a remote site within a large organization (e.g., Air Force base), triage analysis may be performed, albeit in a limited way, by the system administrator or network manager.
Escalation analysis refers to the steps taken to investigate suspicious
A main goal of escalation analysis is to produce incident reports. Compared to triage analysis, escalation looks at related data over longer periods of time (e.g., over the last several months of collected data) and from multiple data sources (e.g., including information from threat reports). The time needed to process these data queries and to interpret and assemble the results accounts for the fact that esca-lation analysis takes longer than triage analysis. In triage analysis, emphasis is on speed; correspondingly, the analysis usually involves limited queries on a single data source. In the current practice of CND analysis, the combination of triage and escalation analysis is what is often referred to as a real-time monitoring capability (although it does not actually occur in real time).
Sometimes, escalation analysis is based on tip-offs received from colleagues in other analysis groups and from cooperating organizations. This situation occurs particularly for senior analysts who have good contacts throughout the CND com-munity.
Escalation analysis is largely reactive. Less commonly, escalation analysis involves proactive actions such as tuning sensors to look for predicted attacks or activity related to a current investigation. Within the CTA, we encountered the
following relevant CND job titles:level 2 analystandlead analyst.
Correlation analysisis the search for patterns and trends in current and
histor-ical data. At the community level, correlation analysis includes grouping data into intrusion sets; these investigations can take days to months. When conducted at the community level, correlation analysis is closely related to threat analysis.
Correlation tasks include retrospectively reviewing packet data, alert data or incident reports collected over weeks or months of CND monitoring, looking for unexplained patterns. Patterns may arise from different data attributes such as specific source or destination IP addresses, ports used, hostnames, timing character-istics, attack details and attacker behavior. By discovering patterns, CND analysts can uncover suspicious activity that was previously unnoticed. An analyst might not know what patterns they are looking for in advance; instead, the analyst might “know it when they see it.” When they encounter a pattern that they cannot explain, they form hypotheses about potential malicious intent, which they try to confirm or contradict via additional investigation.
In the CND CTA, we encountered few analysts whose primary role was corre-lation analysis. Only 5% of the CTA participants were primarily responsible for
community-wide correlation; another 5% were primarily responsible for thepost
hocreview, at the regional level, to search for anomalies or patterns not found during
triage and escalation analysis.
Correlation analysis is reactive when it focuses on discovery within existing data. It has the potential to be proactive if discovered patterns are used to make pre-dictions about next likely actions. Within the CTA, we encountered the following
relevant CND job titles:level 2 analyst, correlation analyst and site-specific
Threat analysisis intelligence analysis in support of CND. Threat analysis uses data sources beyond the monitored traffic (e.g., information published on hacker websites) to gain additional insight into the identity, motives and sponsorship of attackers and to forecast upcoming CND attacks. The additional data sources pro-vide a higher-level perspective than is possible by examining computer network traffic and host-based activity. The additional data sources are essential for under-standing an attacker’s true identity and intent; One of CTA participants explained, “Intelligence is the most important factor in doing prediction and attribution.”
Threat analysis may proceed in reaction to a specific attack. However, threat analysis is the most proactive of the analysis categories, since threat analysis can precede and uncover facts before a CND attack occurs. In the CTA, we found that
threat analysis was primarily linked with the job title ofthreat analyst.
Incident response analysisrecommends and/or implements a course of action in
reaction to a confirmed incident. Responses may be as straightforward as blocking a source IP address, or as complex as “caging” or “fish bowling” an attacker inside the network to observe the attacker in action. Incident response involves assessing the tradeoffs of potential responses and how the responses will impact organizational mission. Incident response analysis is, by definition, a reactive activity. Within the
CTA, we encountered the following relevant CND job titles:incident handlerand
incident responder.
Incident response, as well as forensic analysis, involves the issue of authority. Because of legal ramifications, only certain CND analysts are authorized to imple-ment a response. In the CTA, the majority of analysts was responsible for analysis and reporting and not authorized to take response actions.
Forensic analysisconsists of gathering evidence in support of a law enforcement
investigation instigated by an incident. Forensic analysis is especially concerned with evidence preservation and has increased need for host-based evidence collec-tion. Forensic analysis takes weeks to months to complete. Forensic analysis is, by definition, a reactive function.
In the DOD, forensic analysis is separated from the other aspects of CND analy-sis due to the issue of authority. Only certain analysts are authorized to collect and review cases involving U.S. citizens and to prepare this data for legal action. Foren-sic analysis is performed by members of a law enforcement organization, who may be assisted by incident handlers.
4.3 CND Analysis Workflow Across Organizations
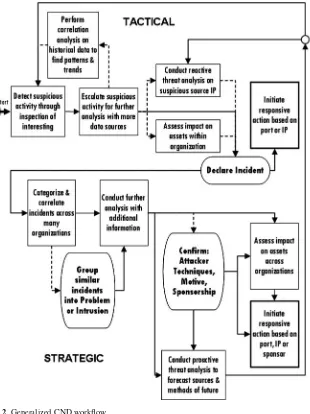
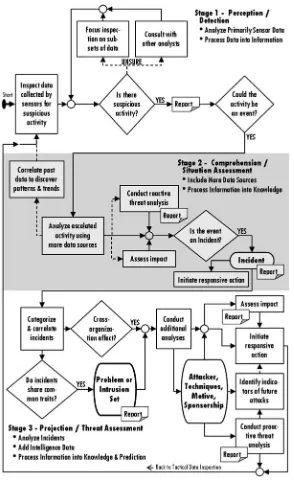
Each organization that participated in the CTA had its own workflow for analyz-ing CND data, which differed from the other organizations’ workflows. Nonethe-less, after capturing each process in a workflow diagram and comparing them, we found many commonalities. Figures 2 and 3 depict a synthesized workflow that encapsulates and abstracts observations from all seven organizations.
Fig. 2 Generalized CND workflow
Tactical analysis. The top half of Fig. 2, ending at the declaration of an incident and initiation of incident response, represents a tactical focus. The goal of tacti-cal analysis is to defend against an immediate, current attack and to maintain the operational status of the monitored networks. Tactical analysis is usually performed at enclave and regional levels. Analysis at the tactical level focuses on inspecting IDS alerts, flow data, firewall logs and TCPDUMP, with additional information drawn from open source and intelligence sources. The declaration of an incident is a definitive point in tactical analysis that initiates a series of incident response tasks. Incident response may be handled by the monitoring organization or by the enclave network administrator.
Strategic analysis. The bottom half of Fig. 2, beginning with the categoriza-tion and correlacategoriza-tion of confirmed incidents, represents a strategic focus. The goal of strategic analysis is to understand the broader implications of related attacks. Strategic analysis is an important function of the community level (e.g., JTF-GNO and FS-ISAC). Incidents declared across enclaves and regions are collected at the community level. At this strategic level, a community organization exam-ines all constituents’ incidents for patterns or trends. Such patterns may indicate a well-resourced, sophisticated attacker with motives beyond nuisance attacks on an individual workstation.
Analysis at the strategic level focuses on confirmed incidents; it may be aug-mented with data from community sensors, intelligence reports and packet-related data requested from an enclave location. The recognition of an intrusion set is a definitive point in strategic analysis that triggers additional analyses into attack attribution, techniques, motive and sponsorship.
Stages of situation awareness. The CND workflow (see Fig. 3) moves through the three stages of building situation awareness: perception, comprehension and projection (Endsley, 1995; Endsley et al., 2003). In CND, the three stages of sit-uation awareness also align with levels of data fusion. Specifically, analysts engage in detection, situation assessment and threat assessment, which are levels of data fusion identified by the Joint Directors of Laboratories (JDL) and recognized widely by the sensor data fusion community (Llinas and Hall, 1998, Waltz, 1998).
Stage 1: perception/detection. During the first stage, a CND analyst acquires data about the monitored environment, which is typical of the perceptual stage of situation awareness. As the analyst performs triage on interesting activity, compre-hension begins. An analyst assembles and integrates data to form a mental model of how the interesting activity might represent an attacker’s action. By testing hypothe-ses through additional data and input from colleagues, an analyst modifies and clarifies his mental model. By the end of the first stage, when the analyst decides whether to escalate, the focus shifts from perception to comprehension. The first CND stage is primarily concerned with initial data inspection and detection and, thus, aligns with JDL Level 1.