OPTIMIZATION OF CLOSE RANGE PHOTOGRAMMETRY NETWORK
DESIGN APPLYING FUZZY COMPUTATION
a Dept. of Geomatic Engineering, Islamic Azad University – South Tehran Branch, Piroozi Street, Abuzar Boulevard,
Dehhaghi Avenue, P. O. Box: 1777613651, Tehran, Iran - [email protected]
KEY WORDS: Close range photogrammetry, Fuzzy computation, Network Design
ABSTRACT:
Measuring object 3D coordinates with optimum accuracy is one of the most important issues in close range photogrammetry. In this context, network design plays an important role in determination of optimum position of imaging stations. This is, however, not a trivial task due to various geometric and radiometric constraints affecting the quality of the measurement network. As a result, most camera stations in the network are defined on a try and error basis based on the user's experience and generic network concept. In this paper, we propose a post-processing task to investigate the quality of camera positions right after image capturing to achieve the best result. To do this, a new fuzzy reasoning approach is adopted, in which the constraints affecting the network design are all modeled. As a result, the position of all camera locations is defined based on fuzzy rules and inappropriate stations are determined. The experiments carried out show that after determination and elimination of the inappropriate images using the proposed fuzzy reasoning system, the accuracy of measurements is improved and enhanced about 17% for the latter network.
1. INTRODUCTION
Achieving high quality and low cost in production and dimensional quality control processes is an important aspect of industrial measurements (Fraser, 1997). As a non-contact, flexible, and accurate technique, close range photogrammetry can be used to facilitate the measurements in various applications (Luhmann et al., 2004). A very most important issue which affects the accuracy of measurements is the design of an appropriate image capturing network. Many researchers have been performed in this area to prove the results close range photogrammetry procedure.
Olague and Mohr (2002) investigated on the problem of where to place the cameras in order to obtain a minimal error in the 3D measurements. He posed the problem in terms of an optimization design and a global optimization process to minimize this criterion. In another investigation, he used of genetic algorithms for automating the photogrammetric network design process (Olague, 2001). Saadatseresht et al., (2004) proposed a novel method based on fuzzy logic reasoning strategy for the camera placement. He designed a system to make use of human type reasoning strategy by incorporating appropriate rules. Dunn et al., (2005) presented a novel camera network design methodology based on the Parisian approach to evolutionary computation. His experimental results illustrate significant improvements, in terms of solution quality and computational cost, when compared to canonical approaches. Fehr et al., (2009) investigated on several considerations for improving camera placement with the goal of developing a general algorithm that can be applied to a variety of surveillance and inspection systems. He presented an algorithm for placement problem in the context of computer vision and robotics.
In practice, due to existing environmental constraints and for more speed, network design is not fully applied and image capturing is performed experimentally. Based on the rule “more
image, higher accurate”, many photogrammetrists prefer taking large number of images from objects, while many of which may not be necessary. Consequently, we will show that taking inappropriate images may lead to even decrease the accuracy of determined object points.
In this paper, a new fuzzy computation system is proposed that is able to determine unsuitable camera stations based on network design constraints that may have unfavorable effects on the result of the bundle adjustment. In this system, constraints related to distance are modeled based on fuzzy rules to decide whether or not a given image must be taken into account in bundle adjustment procedure. In the following, various fuzzy models developed in this paper are discussed and followed by experiments carried out to evaluate the accuracy of the results. The conclusions of the experiments are finally mentioned.
2. FUZZY MODELING OF NETWORK DESIGN CONSTRAINTS
Network design or camera placement involves with satisfaction of some vision constraints as well as optimization of measurement accuracy. On the other hand, one of the most important issues affected the quality of industrial photogrammetric network is image acquisition based on network design constraints (Atkinson, 1998). Image acquisition according these constraints leads to determination of the best accuracy on target positions of the object. Network design constraints have been shown in Figure 1. Network design constraints grouped in three classes of range, visibility, and accessibility-related constraints (Saadatseresht, 2004). Range or distance-related constraints include those applying to imaging scale, resolution, camera FOV, depth of field (DOF), number and distribution of points, and workspace. Visibility related constraints come from the visibility of a cluster of object points from a camera station which depends upon the constraints of target incidence angle, occluded areas, and camera FOV.
Accessibility-related constraints are typically dependent upon physical constraints of space, obstructions, and often the infeasibility of occupying certain geometrically favorable locations. Range constraints, as the most important constraints affected the results of close range procedure are divided in to two parts (Saadatseresht, 2004):
-Constraints related to minimum distance from camera to the object. These constraints determine minimum needed distance from each camera station. In other words, if the distance of the camera station is far from this value, appropriate accuracy of object coordinates in 3D modeling procedure is determined.
-Constraints related to maximum distance from camera to the object. These constraints determine maximum needed distance from each camera station. In other words, if the distance of the camera station is nearer from this value, appropriate accuracy of object coordinates in 3D modeling procedure is determined.
The most important factors affected the accuracy of exterior orientation of imaging stations and object coordinates are the distance between the camera and the object, and the angle between camera viewing direction and the object surface. Far distance between the image station and the object decreases the scale of the image and its resolution, consequently it makes recognizing the centre of the targets on the objects less accurate. Close distance of image capturing makes the targets blur in images, because the depth of field factor is decreases. Moreover, inappropriate distance and angle between camera station and the object deforms the targets seen in the image, consequently the centre of the targets is measured with error. These factors cause the exterior orientation of image stations and object coordinates having less accuracy in the bundle adjustment. According to the position of each camera station related to the object, for each constraint, a fuzzy value between 0 and 1 is specified. This value is specified according to the comparison between the distance of the station from object and the appropriate distance that is calculated from the constraint formula. Resultant of all specified fuzzy values defines the quality of the station and images captured from that. If the value is appropriate (usually more than 0.7), the images captured from that station are preserved, else (usually less than 0.7), the images are omitted from bundle adjustment procedure. In continue, fuzzy modeling procedure of mentioned constraints is introduced.
Figure 1. Constraints in photogrammetric network design
2.1 Applied Membership Functions
To fuzzy modeling of minimum distance constraints, "smf"
function is used (Menhaj, 1998). In this function, a value between 0 and 1 for distances around the minimum distance, value 1 for distances larger than this boundary and value 0 for distances less than this boundary is defined. To fuzzy modeling of maximum distance constraints, "zmf" function is used (Menhaj, 1998). In this function, a value between 0 and 1 for distances around the maximum distance, value 1 for distances less than this boundary and value 0 for distances larger than this boundary is defined. To combine these two constraint sets, "pimf" function is used (Menhaj, 1998). In this function, value 1 for distances in inner area, a value between 0 and 1 for distances in near boundaries and value 0 for distances in outer area is defined. An example of "smf', "zmf" and "pimf" functions have been shown in Figure 2.
Figure 2. An instance of “smf” (left), "zmf" (middle) and "pimf" (right) functions from the toolbox of Matlab
2.2 Fuzzy Modeling of Range Constraints
In details, range constraints are included as (Saadatseresht, 2004):
-Minimum distance constraints: camera depth of field, and number and distribution of targets
-Maximum distance constraints: image resolution, image scale, and camera field of view
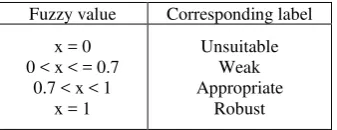
For each constraint, in addition to a value between 0 and 1, an attribute label is dedicated according to Table 1. Fuzzy modeling of each constraint is discussed in continue.
Fuzzy value Corresponding label
x = 0 0 < x < = 0.7
0.7 < x < 1 x = 1
Unsuitable Weak Appropriate
Robust
Table 1. Relation between fuzzy values and corresponding labels for each constraint
Camera Depth of Field Constraint: Camera depth of field
specified an area around the object that for a special distance between camera station and the object, a sharp image will be obtained (Saadatseresht, 2004). This constraint is appeared in equation (1):
) 1 (
. 2
stop HF
F f
D
HF D
f d
d Depth D
1 min
where
D
Depthmin = minimum depth of field distance,DHF = ultra-focal distance
d = initial distance between object and camera f = focal length
Number and Distribution of Targets Constraint: At least k targets that have suitable distribution in image is an appropriate attribute for number of targets constraint and solving unknowns in adjustment (Saadatseresht, 2004). Equation (2) defines the appropriate distance to appear at least k targets in each image:
)
where a = mean distance between targets in object space k = desired number of targets
f = focal length
d = frame size of the camera
Image Resolution Constraint: Image resolution constraint is
mentioned to the ability of identifying the targets in an image (Saadatseresht, 2004). Equation (3) defines maximum distance between object and camera due to the image resolution
T = minimum number of target pixels IRes = dimension of each target
Image Scale Constraint: Image scale constraint determines the maximum distance that the accuracy decreases for more than that distance (Saadatseresht, 2004). Equation (4) defines this constraint:
k = number of images captured in each station Sp = relative accuracy value of measuring D0 = maximum diameter of the object σi = error of image coordinate measurement q = network stability factor
Camera Field of View Constraint: This constraint specifies maximum distance between object and camera that all or a part of the object appears in image area and the object is not appeared in a part of image space (Saadatseresht, 2004). Equation (5) defines this maximum distance:
)
= angle between camera direction and object D0 = length of maximum diameter of the object d0 = minimum of the frame sizef = focal length in sequence
Combining all Constraints: In order to decide finally about the
quality of the camera positions, it is necessary to combine all mentioned constraints. For this reason, the appropriate image capturing area is obtained according to equation (6)
where Range = appropriate image capturing area
According to the final fuzzy value, the system is decided whether each image is suitable for using in final bundle adjustment procedure or not. Providing that there is any unsuitable station, related image must be eliminated in adjustment procedure.
3. INPUT AND OUTPUT DATA
Input data in this procedure includes a data file of coordinates, camera information, object information, target characteristics and network design information. Output data includes the result of fuzzy modeling and decision about each image.
3.1 Input Data
In complete, data input includes:
A position Data File: Targets position coordinates, Cameras
position coordinates.
Camera Characteristics: Focal length, F-stop parameter, Pixel
size, Dimension of sensor (number of rows and columns).
Object Characteristics: Maximum length of the object,
Expected accuracy on target positions.
Target Characteristics: Diameter of target, Number of pixels in each target, Number of expected targets in each image, Mean distance between each target.
Network Design Information: Network stability factor,
Minimum angle between camera optical direction and the object surface.
3.2 Output Data
Output data includes a decision about the quality of each image position after fuzzy modeling of each constraint. Output information in details includes: Displaying targets and camera station positions, Membership functions of each constraint, Fuzzy value of each constraint , Final decision whether the image is appropriate for using in bundle adjustment procedure or not.
4. EXPERIMENTS
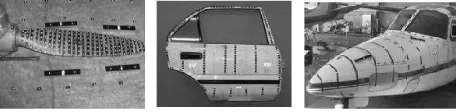
In three separate projects, a propeller of a plane (Amini, 2006), a car door (Opteka, 2004) and a nose of a plane (Amini, 2006) were modeled and measured by close range photogrammetry method that they have been shown in Figure 3.
In investigation of the propeller, 3D modeling of its surface was implemented. The purpose of the investigation was determining the deformation between its two wings (Amini, 2006). In this investigation, 19 images were captured and after bundle adjustment procedure, the mean accuracy of x, y and z coordinates of the targets were determined.
The standard deviation of exterior orientation values of each station are shown in Table 2. Moreover, the fuzzy computation system was tested on each station and the results are also shown in Table 2.
Station Fuzzy Value Exterior Orientation Error (mm)
1 0.7464 0.2799
2 0.7474 0.2792
3 0.6484 0.3088
4 0.9263 0.2060
5 0.9189 0.2057
6 0.7905 0.2259
7 0.8435 0.2507
8 0.8938 0.2443
9 0.7663 0.2626
10 0.8856 0.2254
11 0.8530 0.2296
12 0.9155 0.1976
13 0.9244 0.1978
14 0.7804 0.2256
15 0.8319 0.2250
16 0.8824 0.2151
17 0.8619 0.2215
18 0.7551 0.3536
19 0.7471 0.3513
Table 2. Exterior orientation errors and the result of fuzzy value of each station in measuring the propeller
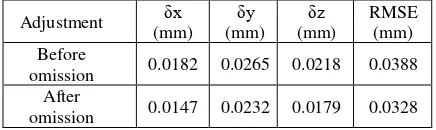
In Table 2, four maximum exterior orientation standard deviation values and four minimum fuzzy values are highlighted with the color of chromatic gray and also four minimum exterior orientation standard deviation values and four maximum fuzzy values are highlighted with the color of pallid gray. As Table 2 shows, the results for stations that have maximum/minimum exterior orientation standard deviation values are almost the same as the stations that have minimum/maximum fuzzy values. After omission of stations with low fuzzy values, bundle adjustment procedure was done with the rest of images. The result of bundle adjustment before and after omission of inappropriate images is shown in Table 3.
Adjustment δx (mm)
δy (mm)
δz (mm)
RMSE (mm) Before
omission 0.0182 0.0265 0.0218 0.0388 After
omission 0.0147 0.0232 0.0179 0.0328
Table 3. The results of bundle adjustment of the propeller before and after omission of images with low fuzzy values
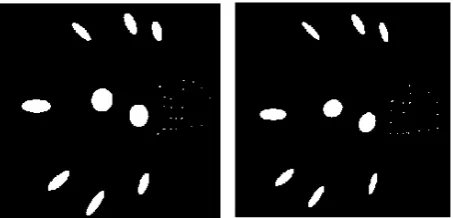
The result of Table 3 shows that the accuracy of bundle adjustment proves after omission of stations with low fuzzy values. Moreover, camera station error ellipsoids for the propeller before and after omission of improper images are shown in Figure 4 in the same scale of 500 greater. Figure 4 shows that after omission of improper images, the rest of error ellipsoids growing smaller.
Figure 4. Camera station error ellipsoids for propeller in scale of 500 before (left) and after (right) omission of improper images
In investigation of the car door (Opteka, 2004), 9 images were captured and after bundle adjustment procedure, the mean accuracy of x, y and z coordinates of the targets were determined. The standard deviation of exterior orientation values of each station are shown in Table 4. Moreover, the fuzzy computation system was tested on each station and the results are also shown in Table 4. In Table 4, three maximum exterior orientation standard deviation values and three minimum fuzzy values are highlighted with the color of chromatic gray and also three minimum exterior orientation standard deviation values and three maximum fuzzy values are highlighted with the color of pallid gray.
Station Fuzzy Value Exterior Orientation Error (mm)
1 0.6414 0.3510
2 0.5541 0.3981
3 0.7941 0.3133
4 0.5543 0.3925
5 0.7486 0.4214
6 0.8000 0.3602
7 0.7993 0.3145
8 0.7856 0.3359
9 0.7994 0.3170
Table 4. Exterior orientation errors and the result of fuzzy value of each station in measuring the car door
As Table 4 shows again, the results for the stations that have maximum/minimum exterior orientation standard deviation values are almost the same as the stations that have minimum/maximum fuzzy values. After omission of stations with low fuzzy values, bundle adjustment procedure was done with the rest of images. The result of bundle adjustment before and after omission of inappropriate images is shown in Table 5.
Adjustment δx (mm)
δy (mm)
δz (mm)
RMSE (mm) Before
omission 0.0099 0.0150 0.0148 0.0233 After
omission 0.0125 0.0111 0.0092 0.0207
Table 5. The results of bundle adjustment of the car door before and after omission of images with low fuzzy values
improper images are shown in the same scale of 700 greater. Figure 5 shows that after omission of improper images, the rest of error ellipsoids growing smaller.
Figure 5. Camera station error ellipsoids for car door in scale of 700 before (left) and after (right) omission of improper images
In the third investigation, 3D modeling of a plane nose was implemented (Amini, 2006). In this investigation, 26 images were captured and after bundle adjustment procedure, the standard deviation of exterior orientation values of each station was determined that are shown in Table 6.
Station Fuzzy Value Exterior Orientation Error (mm)
1 0.8000 0.3948
2 0.6948 0.6332
3 0.8000 0.3878
4 0.6279 0.5844
5 0.9631 0.2671
6 0.8180 0.2982
7 0.9738 0.2645
8 0.8000 0.3704
9 0.8000 0.4016
10 0.5636 0.7945
11 0.8005 0.3951
12 0.6240 0.7100
13 0.8000 0.4304
14 0.8000 0.5492
15 0.8454 0.3162
16 0.9521 0.2563
17 0.9740 0.2403
18 0.9744 0.2648
19 0.8033 0.3971
20 0.8068 0.4254
21 0.8000 0.4832
22 0.8000 0.5819
23 1.0000 0.2116
24 1.0000 0.1866
25 0.8095 0.3026
26 0.8129 0.3154
Table 6. Exterior orientation errors and the result of fuzzy value of each station in measuring the plane nose
Moreover, the fuzzy computation system was tested on each station and the results are also shown in Table 6. In Table 6, four maximum exterior orientation standard deviation values and four minimum fuzzy values are highlighted with the color of chromatic gray and also four minimum exterior orientation standard deviation values and four maximum fuzzy values are highlighted with the color of pallid gray. As Table 6 shows again, the results for the stations that have maximum/minimum exterior orientation standard deviation values are almost the same as the stations that have minimum/maximum fuzzy values. After omission of stations with low fuzzy values, the bundle adjustment procedure was done with the rest of images.
The result of bundle adjustment before and after omission of inappropriate images is shown in Table 7.
Adjustment δx (mm)
δy (mm)
δz (mm)
RMSE (mm) Before
omission 0.0550 0.0523 0.0424 0.0869 After
omission 0.0415 0.0497 0.0363 0.0702
Table 7. The results of bundle adjustment of the plane nose before and after omission of images with low fuzzy values
The result of Table 7 shows that the accuracy of bundle adjustment proves after omission of stations with low fuzzy values. Camera station error ellipsoids for plane nose before and after omission of improper images are shown in Figure 6 in the same scale of 1000 greater. As Figure 6 shows, after omission of improper images, rest of error ellipsoids growing smaller.
Figure 6. Camera station error ellipsoids for plane nose in scale of 1000 before (left) and after (right) omission of improper images
5. CONCLUSIONS
Close range photogrammetry is a suitable and efficient method in accurate modeling and measurement. The most important issue affected the accuracy in a close range photogrammetry procedure is an appropriate camera station network design. In practice, network design is not fully observed and image capturing is performed experimentally and consequently, some images may not suitable for using in bundle adjustment procedure. In this paper, a decision system is established based on fuzzy computation that can be able to specify unsuitable images based on network design constraints that may have unfavorable effect on the result of bundle adjustment. The program is experimented on three data sets determined from including a propeller of a plane, a car door, and a nose of a plane.
6. REFERENCES
Amini, A. Sh., 2006. Investigation of Dimensional Quality Control of Industrial Equipments with Close Range Photogrammetry Method. M. S. thesis, K.N. Toosi University of Technology, Tehran, Iran.
Atkinson, K. B., 1998. Close Range Photogrammetry and Machine Vision. Whittles Scotland Publishers.
Dunn, E., Olague, G. and Lutton, E., 2005. Automated Photogrammetric Network Design using the Parisian Approach. 7th European Workshop on Evolutionary Computation in Image Analysis and Signal Processing, Springer-Verlag.
Fehr, D., Fiore, L. and Papanikolopoulos, N., 2009. Issues and Solutions in Surveillance Camera Placement. In the Proceedings of the IEEE/RSJ International Conference on Intelligent Robots and Systems.
Fraser, C., 1997. Innovations in Automation for Vision Metrology Systems. Intl. J. PhotogrammetricRecord, 15: 901-911.
Luhmann, T., Robson, S., Kyle, S. and Harley, I., 2008. Close Range Photogrammetry: Principles, Methods and Applications, Whittles England Publishers.
Menhaj, M. B., 1998. Fuzzy Computation. Elmo San'at Iran Publishing, Iran.
Olague, G., 2001. Autonomous Photogrammetric Network Design using Genetic Algorithms. In the Proceedings of the Evo Workshops on Applications of Evolutionary Computing, Springer-Verlag.
Olague, G. and Mohr, R., 2002. Optimal Camera Placement for Accurate Reconstruction", Pattern Recognition, 35: 927-944.
Opteka, J., 2004. Precision Target Mensuration in Vision Metrology. PhD thesis, University of Wien.
Saadatseresht, M., 2004. Automatic Camera Placement in Vision Metrology Based on a Fuzzy Inference System, PhD thesis, University of Tehran, Tehran, Iran.