Lippo Karawaci
(LPKR IJ)
NDR feedback: Interesting, but wait and see
We hosted a two-day non-deal roadshow for
Lippo Karawaci’s ”LPKR)
between
October 23
rdand 25
thin Singapore and South Korea. Overall, the sentiment on
Indonesia’s property market seemed neutral. However, investors were intrigued by
LPKR’s flagship project, Meikarta, and the forthcoming developments.
Fully geared to Meikarta
During the roadshow, LPKR reiterated its focus on Meikarta, a mid/low-income
property development project
”please refer to our LPKR report
En route back to
property-centric business
for more details). The company’s 9M17 marketing sales
came in at IDR5.4tr, of which IDR4.9tr (90.7%) stemmed from Meikarta sales alone.
In 2Q17, the company sold IDR2.4tr worth of Meikarta units to internal employees,
and booked IDR2.5tr from public sales during 3Q17. Approximately 12,000
Meikarta units were sold during the period. Management estimated that margins
for the project will hover around 20% (gross), 15% (operating), and 10% (net). It is
worth noting that, despite the robust year-to-date marketing sales print, LPKR said
it would not revise up its full-year target of IDR3.2tr (excluding asset sales to REIT).
Going forward, the company expects slower marketing sales, as the momentum
from
the project’s launch and massive marketing efforts during 2Q-3Q should
slowly fade. The first handover is expected to be in December 2018, plus a 6-month
grace period. On another note, LPKR stated that the Meikarta project is to be built
on dormant land acquired long ago by the company; thus, rather than be left
dormant, it will be used for a low-end property development. LPKR will
subsequently develop higher-margin projects in other surrounding areas after the
Meikarta project, but only when there is visibility on the property market recovery.
We view this as a prudent and correct strategy to overcome current property
market conditions.
Less profitable SILO going forward
Meanwhile, management was somewhat downbeat on the outlook of the
healthcare business, Siloam International Hospitals (SILO IJ/Not rated). LPKR stated
that Siloam’s margins could remain squeezed given massive expansion efforts and
the larger contribution from BPJS patients—a view we echoed. Management
estimated the EBITDA margin for non-BPJS patients at 22% and for BPJS patients at
14.3%.
Investors seemingly take a wait-and-see stance
Despite the company’s aggressive promotion on Meikarta, we think investors
appear to be staying neutral on Indonesia’s broader property market. This is likely
because of the country’s sluggish economic growth momentum resulting from
consumers’ low purchasing intention.
Developer
Company Report
November 7, 2017
(Upgrade)
Buy
Target Price (12M, IDR)
865
Share Price (11/6/17, IDR)
645
Expected Return
34.1%
Consensus OP (17F, IDRtr) 2.1
EPS Growth (17F, %) 27.1
P/E (17F, x) 13.1
Industry P/E (17F, x) 13.3 Benchmark P/E (17F, x) 17.7 Market Cap (IDRbn) 15,000.5
Shares Outstanding (mn) 23,077.7
Free Float (mn) 20,134.6
Institutional Ownership (%) 35.4
Beta (Adjusted, 24M) 1.1
PT. Mirae Asset Sekuritas Indonesia
Property
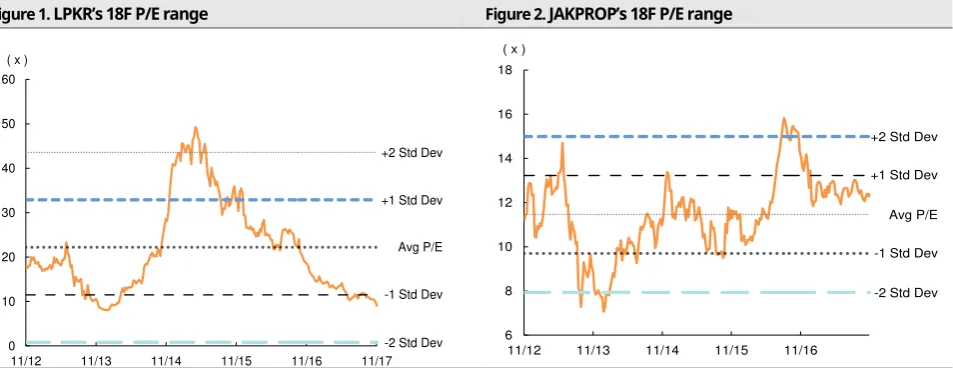
Valuations turn attractive; Upgrade to Buy
We upgrade our recommendation on LPKR to Buy (from Trading Buy) while maintaining our
TP of IDR865, as the recent share price plunge has widened the upside potential. Our
DCF-based target price implies a 2018F P/E of 12.2x and reflects a 5% perpetual growth rate,
1.165 beta, 5.5% market risk premium, and 10.2% WACC. We believe LPKR shares have been
oversold, widening the margin of safety as valuations get lower. LPKR is currently trading at
a 2018F P/E of 9x, less than -1 SD (11.5x) from its five-year average and a hefty discount to
the property index’s 2018F P/E of 12.4x (see Figures 1 and 2). From a P/B perspective, LPKR
is currently trading below its book value, at a 2018F P/B of only 0.44x, close to -2 SD (0.41x)
from its five-year average and also a sizable discount to the property index’s 2018F P/B of
1.27x (see Figures 3 and 4).
Figure 1.
LPKR’s 18
F P/E range
Figure 2.
JAKPROP’s 18F P/E range
Source: Mirae Asset Sekuritas Indonesia Research Source: Mirae Asset Sekuritas Indonesia Research
Figure 3.
LPKR’s 18
F P/B range
Figure 4.
JAKPROP’s 18
F P/B range
Source: Mirae Asset Sekuritas Indonesia Research Source: Mirae Asset Sekuritas Indonesia Research -1 Std Dev
Avg P/E +1 Std Dev
-2 Std Dev +2 Std Dev
0 10 20 30 40 50 60
11/12 11/13 11/14 11/15 11/16 11/17 ( x )
+1 Std Dev
-1 Std Dev +2 Std Dev
-2 Std Dev Avg P/E
6 8 10 12 14 16 18
11/12 11/13 11/14 11/15 11/16 ( x )
+1 Std Dev
-1 Std Dev +2 Std Dev
-2 Std Dev Avg P/E
1.0 1.2 1.4 1.6 1.8 2.0 2.2 2.4 2.6 2.8
11/12 11/13 11/14 11/15 11/16 ( x )
-1 Std Dev Avg P/E +1 Std Dev
-2 Std Dev +2 Std Dev
0.0 0.5 1.0 1.5 2.0 2.5 3.0
Figure 5
. Developers’ marketing
sales performance, 9M17
Figure 6
. Developers’ marketing sales growth,
3Q17
Source: Company data, Mirae Asset Sekuritas Indonesia Research Note: Targets at 2017 inception, excluding asset sales to REIT
Source: Company data, Mirae Asset Sekuritas Indonesia Research
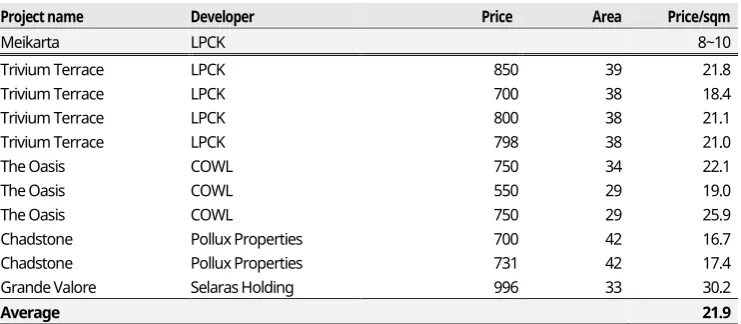
Table 1. Condominium pricing details in Cikarang area
(IDRmn, sqm)
Project name
Developer
Price
Area
Price/sqm
Meikarta
LPCK
8~10
Source: Rumah123.com, Mirae Asset Sekuritas Indonesia Research
Note: Lippo Cikarang (LPCK IJ/Not-rated, owned by LPKR), Cowell Development (COWL IJ/Not-rated).
Figure 7.
LPKR’s debt
-to-equity ratio performance and forecast
Figure 8.
LPKR’s net gearing ratio performance and forecast
Source: Company data, Mirae Asset Sekuritas Indonesia Research Source: Company data, Mirae Asset Sekuritas Indonesia Research 66.7
BSDE SMRA PWON LPKR CTRA PPRO
9M16 (L) 9M17 (L)
BSDE SMRA PWON LPKR CTRA PPRO 3Q16 (L) 3Q17 (L) YoY change (R)
2011 2012 2013 2014 2015 2016 2017F 2018F (x)
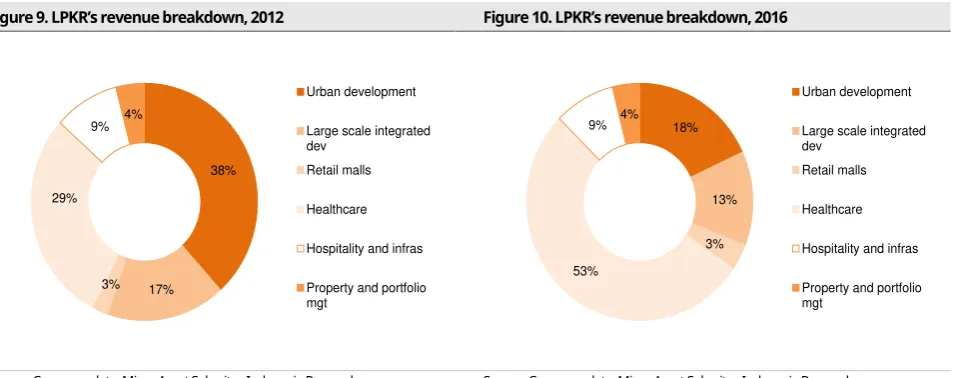
Figure 9.
LPKR’s
revenue breakdown, 2012
Figure 10.
LPKR’s revenue breakdown, 2016
Source: Company data, Mirae Asset Sekuritas Indonesia Research Source: Company data, Mirae Asset Sekuritas Indonesia Research Note: Excluding asset sales to REITs
Figure 11. SILO
’s hospital profile, 2013 and 9M
17
Figure 12
. SILO’s net profit margin performance
Source: Company data, Mirae Asset Sekuritas Indonesia Research Source: Company data, Mirae Asset Sekuritas Indonesia Research
Figure 13.
SILO and MIKA’s days of receivables performance
Figure 14. Percentage of SILO hospitals supporting BPJS patients
38%2010 2011 2012 2013 2014 2015 2016 9M17 Revenue (L) Net profit (L) NPM (R)
(IDRbn) (%)
2012 2013 2014 2015 2016 9M17
SILO MIKA
BPJS Non-BPJS BPJS % to total
Lippo Karawaci (LPKR IJ/Buy/TP IDR865)
Income Statement (Summarized)
Balance Sheet (Summarized)
(IDRbn)
12/16 12/17F 12/18F 12/19F
(IDRbn)12/16 12/17F 12/18F 12/19F
Revenue 10,538 12,350 13,835 16,955 Cash and equivalents 3,250 6,230 6,493 3,451 Cost of revenue -6,021 -6,748 -7,460 -9,263 Account receivables 1,823 1,570 1,758 2,155 Gross profit 4,517 5,602 6,375 7,692 Advances 6,275 7,354 8,238 10,096 Operating expenses -2,771 -3,314 -3,480 -4,264 Inventories 23,370 28,813 31,852 39,551 Operating profit 1,746 2,288 2,895 3,428 Other current assets 2,736 3,206 3,592 4,402 Interest expense -318 -318 -374 -443 Fixed assets 2,902 2,859 2,774 2,647
Interest income 77 104 200 208 Investment properties 625 624 618 608
Net non-operating losses (gains) 266 217 243 298 Other long-term assets 4,623 5,418 6,069 7,438 Pre-tax profit 1,771 2,291 2,965 3,491 Total assets 45,604 56,074 61,396 70,349
Tax expense -544 -763 -892 -994 Account payables 819 917 1,014 1,259
Net profit 1,227 1,528 2,073 2,497 Short-term debt 1,408 628 751 839
Minority interest -345 -404 -453 -555 Other short-term liabilities 4,639 5,437 6,091 7,465 Attributable net profit 882 1,124 1,620 1,942 Long-term debt 12,254 15,411 18,293 21,161 Other long-term liabilities 4,408 6,276 2,481 3,017 Growth (%)
12/16 12/17F 12/18F 12/19F
Total liabilities 23,529 28,670 28,630 33,741Revenue 18.3 17.2 12.0 22.6 Paid in capital 6,547 7,313 7,940 9,260
Cost of revenue 25.6 12.1 10.5 24.2 Additional paid in capital 4,081 7,181 10,181 10,181 Gross profit 9.7 24.0 13.8 20.7 Retained earnings 7,945 8,805 10,046 11,532 Operating expenses 15.9 19.6 5.0 22.6 Total equity attributable to majority 18,572 23,299 28,167 30,973 Operating profit 1.1 31.0 26.6 18.4 Non-controlling interest 3,503 4,105 4,599 5,636 Interest expense 22.0 0.0 17.4 18.7 Total shareholders' equity 22,075 27,404 32,766 36,608 Net non-operating losses (gains) -7.7 35.0 12.0 22.6
Pre-tax profit 18.7 29.4 29.4 17.7
Tax expense 16.3 40.4 16.9 11.5
Net profit 19.8 24.5 35.7 20.4
Minority interest -29.4 17.2 12.0 22.6 Attributable net profit 64.8 27.3 44.2 19.8
Key performance indicators
Cash Flow Statement (Summarized)
12/16 12/17F 12/18F 12/19F
(IDRbn)12/16 12/17F 12/18F 12/19F
Per share data Net profit 882 1,124 1,620 1,942
EPS (IDR) 38.8 49.3 71.2 85.3 Depreciation 472 544 591 637
EPS growth (%) 64.8 27.3 44.2 19.8 Changes in net working capital -457 -6,623 -3,624 -9,057
BVPS (IDR) 969.4 1203.4 1438.9 1607.6 Operating cash flow 898 -4,955 -1,413 -6,478
BVPS growth (%) 16.7 24.1 19.6 11.7 PP&E investing activities -614 -443 -443 -443
DPS (IDR) 1.7 11.6 16.7 20.0 I.P investing activities -237 -57 -57 -57
Key ratio Others investing activities -22 -795 -651 -1,369
ROE (%) 4.0 4.1 4.9 5.3 Investing cash flow -873 -1,295 -1,151 -1,869
ROA (%) 1.9 2.0 2.6 2.8 Non-current financing activities -891 5,025 -913 3,404 Gross profit margin (%) 42.9 45.4 46.1 45.4 Changes in equity 1,335 3,866 3,628 1,319 Operating margin (%) 16.6 18.5 20.9 20.2 Changes in minority interest 980 602 493 1,037
Net profit margin (%) 8.4 9.1 11.7 11.5 Dividend paid -39 -264 -380 -455
Net debt/equity (x) 0.5 0.4 0.4 0.5 Financing cash flow 1,385 9,230 2,828 5,305
Debt/equity (x) 0.6 0.6 0.6 0.6 Net worth adjustment 0 0 0 0
Assets/equity (x) 2.1 2.0 1.9 1.9 Net cash 1,410 2,980 264 -3,042
Current ratio (x) 5.5 6.8 6.6 6.2 Beginning balance 1,839 3,250 6,230 6,493
Quick ratio (x) 0.7 1.1 1.1 0.6 Ending balance 3,250 6,230 6,493 3,451
APPENDIX 1
Important Disclosures & Disclaimers
Stock Ratings Industry Ratings
Buy Relative performance of 20% or greater Overweight Fundamentals are favorable or improving Trading Buy Relative performance of 10% or greater, but with
volatility Neutral Fundamentals are steady without any material changes Hold Relative performance of -10% and 10% Underweight Fundamentals are unfavorable or worsening
Sell Relative performance of -10%
* Our investment rating is a guide to the relative return of the stock versus the market over the next 12 months.
* Although it is not part of the official ratings at Mirae Asset Sekuritas Indonesia, we may call a trading opportunity in case there is a technical or short-term material development.
* The target price was determined by the research analyst through valuation methods discussed in this report, in part based on the analyst’s estimate of future earnings.
The achievement of the target price may be impeded by risks related to the subject securities and companies, as well as general market and economic conditions.
Analyst Certification
Opinions expressed in this publication about the subject securities and companies accurately reflect the personal views of the Analysts primarily responsible for this report. PT. Mirae Asset Sekuritas Indonesia ” MiraeAsset Daewoo ) policy prohibits its Analysts and members of their
households from owning securities of any company in the Analyst’s area of coverage, and the Analysts do not serve as an officer, director or
advisory board member of the subject companies. Except as otherwise specified herein, the Analysts have not received any compensation or any other benefits from the subject companies in the past 12 months and have not been promised the same in connection with this report. No part of the compensation of the Analysts was, is, or will be directly or indirectly related to the specific recommendations or views contained in this report but, like all employees of Mirae Asset Daewoo, the Analysts receive compensation that is determined by overall firm profitability, which includes revenues from, among other business units, the institutional equities, investment banking, proprietary trading and private client division. At the time of publication of this report, the Analysts do not know or have reason to know of any actual, material conflict of interest of the Analyst or Mirae Asset Daewoo except as otherwise stated herein.
Disclaimers
This report is published by Mirae Asset Daewoo, a broker-dealer registered in the Republic of Indonesia and a member of the Indonesia Stock Exchange. Information and opinions contained herein have been compiled in good faith and from sources believed to be reliable, but such information has not been independently verified and Mirae Asset Daewoo makes no guarantee, representation or warranty, express or implied, as to the fairness, accuracy, completeness or correctness of the information and opinions contained herein or of any translation into English from the Indonesian language. In case of an English translation of a report prepared in the Indonesian language, the original Indonesian language report may have been made available to investors in advance of this report.
The intended recipients of this report are sophisticated institutional investors who have substantial knowledge of the local business environment, its common practices, laws and accounting principles and no person whose receipt or use of this report would violate any laws and regulations or subject Mirae Asset Daewoo and its affiliates to registration or licensing requirements in any jurisdiction shall receive or make any use hereof. This report is for general information purposes only and it is not and shall not be construed as an offer or a solicitation of an offer to effect transactions in any securities or other financial instruments. The report does not constitute investment advice to any person and such person shall not be treated as a client of Mirae Asset Daewoo by virtue of receiving this report. This report does not take into account the particular investment objectives, financial situations, or needs of individual clients. The report is not to be relied upon in substitution for the exercise of independent judgment. Information and opinions contained herein are as of the date hereof and are subject to change without notice. The price and value of the investments referred to in this report and the income from them may depreciate or appreciate, and investors may incur losses on investments. Past performance is not a guide to future performance. Future returns are not guaranteed, and a loss of original capital may occur. Mirae Asset Daewoo, its affiliates and their directors, officers, employees and agents do not accept any liability for any loss arising out of the use hereof.
Mirae Asset Daewoo may have issued other reports that are inconsistent with, and reach different conclusions from, the opinions presented in this report. The reports may reflect different assumptions, views and analytical methods of the analysts who prepared them. Mirae Asset Daewoo may make investment decisions that are inconsistent with the opinions and views expressed in this research report. Mirae Asset Daewoo, its affiliates and their directors, officers, employees and agents may have long or short positions in any of the subject securities at any time and may make a purchase or sale, or offer to make a purchase or sale, of any such securities or other financial instruments from time to time in the open market or otherwise, in each case either as principals or agents. Mirae Asset Daewoo and its affiliates may have had, or may be expecting to enter into, business relationships with the subject companies to provide investment banking, market-making or other financial services as are permitted under applicable laws and regulations.
No part of this document may be copied or reproduced in any manner or form or redistributed or published, in whole or in part, without the prior written consent of Mirae Asset Daewoo.
Disclosures
Distribution
United Kingdom: This report is being distributed by Mirae Asset Securities (UK) Ltd. in the United Kingdom only to (i) investment professionals
falling within Article 19”5) of the Financial Services and Markets Act 2000 ”Financial Promotion) Order 2005 ”the Order ), and (ii) high net worth
companies and other persons to whom it may lawfully be communicated, falling within Article 49(2)(A) to (E) of the Order (all such persons
together being referred to as Relevant Persons ). This report is directed only at Relevant Persons. Any person who is not a Relevant Person should
not act or rely on this report or any of its contents.
United States: This report is distributed in the U.S. by Mirae Asset Securities (USA) Inc., a member of FINRA/SIPC, and is only intended for major institutional investors as defined in Rule 15a-6(b)(4) under the U.S. Securities Exchange Act of 1934. All U.S. persons that receive this document by their acceptance thereof represent and warrant that they are a major institutional investor and have not received this report under any express or implied understanding that they will direct commission income to Mirae Asset Daewoo or its affiliates. Any U.S. recipient of this document wishing to effect a transaction in any securities discussed herein should contact and place orders with Mirae Asset Securities (USA) Inc., which accepts responsibility for the contents of this report in the U.S. The securities described in this report may not have been registered under the U.S. Securities Act of 1933, as amended, and, in such case, may not be offered or sold in the U.S. or to U.S. persons absent registration or an applicable exemption from the registration requirements.
Hong Kong: This document has been approved for distribution in Hong Kong by Mirae Asset Securities (HK) Ltd., which is regulated by the Hong Kong Securities and Futures Commission. The contents of this report have not been reviewed by any regulatory authority in Hong Kong. This report is for distribution only to professional investors within the meaning of Part I of Schedule 1 to the Securities and Futures Ordinance of Hong Kong (Cap. 571, Laws of Hong Kong) and any rules made thereunder and may not be redistributed in whole or in part in Hong Kong to any person. All Other Jurisdictions: Customers in all other countries who wish to effect a transaction in any securities referenced in this report should contact Mirae Asset Daewoo or its affiliates only if distribution to or use by such customer of this report would not violate applicable laws and regulations and not subject Mirae Asset Daewoo and its affiliates to any registration or licensing requirement within such jurisdiction.
Mirae Asset Daewoo International Network
Mirae Asset Daewoo Co., Ltd. (Seoul) Mirae Asset Securities (HK) Ltd. Mirae Asset Securities (UK) Ltd.
Global Equity Sales Team Mirae Asset Center 1 Building 26 Eulji-ro 5-gil, Jung-gu, Seoul 04539 Korea
Suites 1109-1114, 11th Floor Two International Finance Centre 8 Finance Street, Central Hong Kong
China
41st Floor, Tower 42 25 Old Broad Street, London EC2N 1HQ United Kingdom
Tel: 82-2-3774-2124 Tel: 852-2845-6332 Tel: 44-20-7982-8000
Mirae Asset Securities (USA) Inc. Mirae Asset Wealth Management (USA) Inc. Mirae Asset Wealth Management (Brazil) CCTVM
810 Seventh Avenue, 37th Floor New York, NY 10019
USA
555 S. Flower Street, Suite 4410, Los Angeles, California 90071 USA
Rua Funchal, 418, 18th Floor, E-Tower Building Vila Olimpia
Sao Paulo - SP 04551-060 Brasil
Tel: 1-212-407-1000 Tel: 1-213-262-3807 Tel: 55-11-2789-2100
PT. Mirae Asset Sekuritas Indonesia Mirae Asset Securities (Singapore) Pte. Ltd. Mirae Asset Securities (Vietnam) LLC
Equity Tower Building Lt. 50 Sudirman Central Business District
Jl. Jend. Sudirman, Kav. 52-53 Jakarta Selatan 12190
Indonesia
6 Battery Road, #11-01 Singapore 049909 Republic of Singapore
7F, Saigon Royal Building 91 Pasteur St.
District 1, Ben Nghe Ward, Ho Chi Minh City Vietnam
Tel: 62-21-515-3281 Tel: 65-6671-9845 Tel: 84-8-3911-0633 (ext.110)
Mirae Asset Securities Mongolia UTsK LLC Mirae Asset Investment Advisory (Beijing) Co., Ltd Beijing Representative Office
#406, Blue Sky Tower, Peace Avenue 17 1 Khoroo, Sukhbaatar District Ulaanbaatar 14240 Mongolia
2401B, 24th Floor, East Tower, Twin Towers B12 Jianguomenwai Avenue, Chaoyang District Beijing 100022
China
2401A, 24th Floor, East Tower, Twin Towers B12 Jianguomenwai Avenue, Chaoyang District Beijing 100022
China
Tel: 976-7011-0806 Tel: 86-10-6567-9699 Tel: 86-10-6567-9699 (ext. 3300)
Shanghai Representative Office Ho Chi Minh Representative Office
38T31, 38F, Shanghai World Financial Center 100 Century Avenue, Pudong New Area Shanghai 200120
China
7F, Saigon Royal Building 91 Pasteur St.
District 1, Ben Nghe Ward, Ho Chi Minh City Vietnam