Sr. No
Topic
1.
Scope of the Journal
2.
The Model
3.
The Advisory and Editorial Board
4.
Papers
First Published in the United States of America. Copyright © 2012
Foundation of Computer Science Inc.
International Journal of Computer Applications (IJCA) creates a place for publication of papers which covers the frontier issues in Computer Science and Engineering and their applications which will define new wave of breakthroughs. The journal is an initiative to identify the efforts of the scientific community worldwide towards inventing new-age technologies. Our mission, as part of the research community is to bring the highest quality research to the widest possible audience. International Journal of Computer Applications is a global effort to consolidate dispersed knowledge and aggregate them in a search-able and index-able form.
The perspectives presented in the journal range from big picture analysis which address global and universal concerns, to detailed case studies which speak of localized applications of the principles and practices of computational algorithms. The journal is relevant for academics in computer science, applied sciences, the professions and education, research students, public administrators in local and state government, representatives of the private sector, trainers and industry consultants.
Indexing
International Journal of Computer Applications (IJCA) maintains high quality indexing services such as Google Scholar, CiteSeer, UlrichsWeb, DOAJ (Directory of Open Access Journals) and Scientific Commons Index, University of St. Gallen, Switzerland. The articles are also indexed with SAO/NASA ADS Physics Abstract Service supported by Harvard University and NASA, Informatics and ProQuest CSA Technology Research Database. IJCA is constantly in progress towards expanding its contents worldwide for the betterment of the scientific, research and academic communities.
Topics
Open Review
International Journal of Computer Applications approach to peer review is open and inclusive, at the same time as it is based on the most rigorous and merit-based „blind’ peer-review processes. Our referee processes are criterion-referenced and referees selected on the basis of subject matter and disciplinary expertise. Ranking is based on clearly articulated criteria. The result is a refereeing process that is scrupulously fair in its assessments at the same time as offering a carefully structured and constructive contribution to the shape of the published paper.
Intellectual Excellence
includes members of research center heads, faculty deans, department heads, professors, research scientists, experienced software development directors and engineers.
Dr. T. T. Al Shemmeri, Staffordshire University, UK Bhalaji N, Vels University
Dr. A.K.Banerjee, NIT, Trichy Dr. Pabitra Mohan Khilar, NIT Rourkela
Amos Omondi, Teesside University Dr. Anil Upadhyay, UPTU
Dr Amr Ahmed, University of Lincoln Cheng Luo, Coppin State University Dr. Keith Leonard Mannock, University of London Harminder S. Bindra, PTU
Dr. Alexandra I. Cristea, University of Warwick Santosh K. Pandey, The Institute of CA of India
Dr. V. K. Anand, Punjab University Dr. S. Abdul Khader Jilani, University of Tabuk
Dr. Rakesh Mishra, University of Huddersfield Kamaljit I. Lakhtaria, Saurashtra University
Dr. S.Karthik, Anna University Dr. Anirban Kundu, West Bengal University of Technology
Amol D. Potgantwar, University of Pune Dr Pramod B Patil, RTM Nagpur University
Dr. Neeraj Kumar Nehra, SMVD University Dr. Debasis Giri, WBUT
Dr. Rajesh Kumar, National University of Singapore Deo Prakash, Shri Mata Vaishno Devi University
Dr. Sabnam Sengupta, WBUT Rakesh Lingappa, VTU
D. Jude Hemanth, Karunya University P. Vasant, University Teknologi Petornas
Dr. A.Govardhan, JNTU Yuanfeng Jin, YanBian University
Dr. R. Ponnusamy, Vinayaga Missions University Rajesh K Shukla, RGPV
Dr. Yogeshwar Kosta, CHARUSAT Dr.S.Radha Rammohan, D.G. of Technological Education
T.N.Shankar, JNTU Prof. Hari Mohan Pandey, NMIMS University
Dayashankar Singh, UPTU Prof. Kanchan Sharma, GGS Indraprastha Vishwavidyalaya
Bidyadhar Subudhi, NIT, Rourkela Dr. S. Poornachandra, Anna University Dr. Nitin S. Choubey, NMIMS Dr. R. Uma Rani, University of Madras
Rongrong Ji, Harbin Institute of Technology, China Dr. V.B. Singh, University of Delhi
Anand Kumar, VTU Hemant Kumar Mahala, RGPV
Prof. S K Nanda, BPUT Prof. Debnath Bhattacharyya, Hannam University
Dr. A.K. Sharma, Uttar Pradesh Technical University
Dr A.S.Prasad, Andhra University
Rajeshree D. Raut, RTM, Nagpur University Deepak Joshi, Hannam University
Dr. Vijay H. Mankar, Nagpur University Dr. P K Singh, U P Technical University Atul Sajjanhar, Deakin University RK Tiwari, U P Technical University
Navneet Tiwari, RGPV Dr. Himanshu Aggarwal, Punjabi University
Ashraf Bany Mohammed, Petra University Dr. K.D. Verma, S.V. College of PG Studies & Research
Totok R Biyanto, Sepuluh Nopember R.Amirtharajan, SASTRA University
Sheti Mahendra A, Dr. B A Marathwada University Md. Rajibul Islam, University Technology Malaysia Koushik Majumder, WBUT S.Hariharan, B.S. Abdur Rahman University
Dr.R.Geetharamani, Anna University Dr.S.Sasikumar, HCET
Rupali Bhardwaj, UPTU Dakshina Ranjan Kisku, WBUT
Gaurav Kumar, Punjab Technical University A.K.Verma, TERI Prof. B.Nagarajan, Anna University Vikas Singla, PTU
Dr H N Suma, VTU Dr. Udai Shanker, UPTU
Anu Suneja, Maharshi Markandeshwar University Prof. Rachit Garg, GNDU
Aung Kyaw Oo, DSA, Myanmar Dr Lefteris Gortzis, University of Patras, Greece.
Prof. Surendra Rahamatkar, VIT Prof. Shishir K. Shandilya, RGPV
M.Azath, Anna University Liladhar R Rewatkar, RTM Nagpur University R. Jagadeesh K, Anna University Amit Rathi, Jaypee University
Dr. Dilip Mali, Mekelle University, Ethiopia. Dr. Paresh Virparia, Sardar Patel University
Morteza S. Kamarposhti , Islamic Azad University of Firoozkuh, Iran
Dr. D. Gunaseelan Directorate of Technological Education, Oman
Dr. M. Azzouzi, ZA University of Djelfa, Algeria. Dr. Dhananjay Kumar, Anna University
Jayant shukla, RGPV Prof. Yuvaraju B N, VTU
Dr. Ananya Kanjilal, WBUT Daminni Grover, IILM Institute for Higher Education
Vishal Gour, Govt. Engineering College Monit Kapoor, M.M University
Dr. Binod Kumar, ISTAR Amit Kumar, Nanjing Forestry University, China.
Dr.Mallikarjun Hangarge, Gulbarga University Gursharanjeet Singh, LPU
Dr. R.Muthuraj, PSNACET Mohd.Muqeem, Integral University
Dr. Chitra. A. Dhawale, Symbiosis Institute of Computer Studies and Research
Dr.Abdul Jalil M. Khalaf, University of Kufa, IRAQ.
Dr. Rizwan Beg, UPTU R.Indra Gandhi, Anna University
V.B Kirubanand, Bharathiar University Mohammad Ghulam Ali, IIT, Kharagpur
Dr. D.I. George A., Jamal Mohamed College Kunjal B.Mankad, ISTAR
Raman Kumar, PTU Lei Wu, University of Houston – Clear Lake, Texas. G. Appasami , Anna University S.Vijayalakshmi, VIT University
Dr. Gurpreet Singh Josan, PTU Dr. Seema Shah, IIIT, Allahabad
Dr. Wichian Sittiprapaporn, Mahasarakham University, Thailand.
Chakresh Kumar, MRI University, India
Dr. Vishal Goyal, Punjabi University, India Dr. A.V.Senthil Kumar, Bharathiar University, India
Hybrid SWOT-AHP Analysis of Saudi Arabia E-Government Authors : Saleh Alshomrani, Shahzad Qamar
1-7
Sign Language Recognition in Robot Teleoperation using Centroid Distance Fourier Descriptors Authors : Rayi Yanu Tara, Paulus Insap Santosa, Teguh Bharata Adji
8-12
Energy Saving and Survival Routing Protocol for Mobile Ad Hoc Networks Authors : Baisakh, Nileshkumar R. Patel
13-17
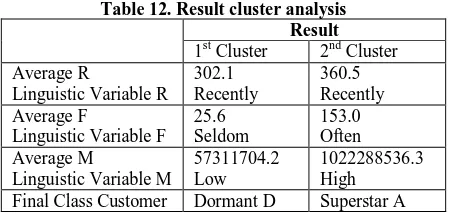
Combination of Adaptive Resonance Theory 2 and RFM Model for Customer Segmentation in Retail Company
Authors : I Ketut Gede Darma Putra, A. A. Kt. Agung Cahyawan, Dian Shavitri H.
18-23
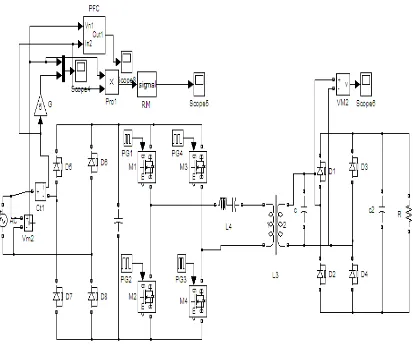
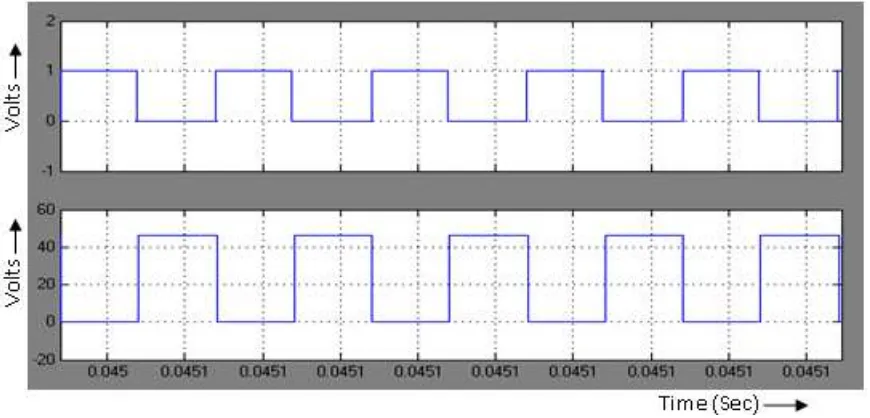
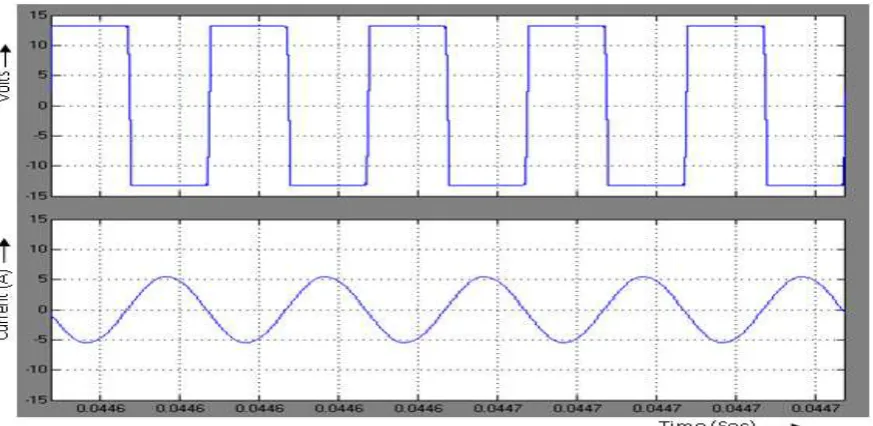
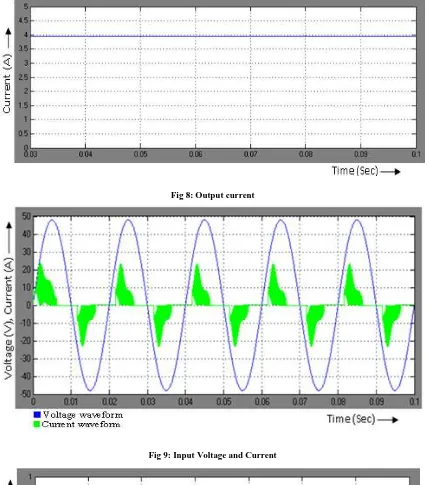
A Novel Bi-directional Series Parallel Resonant Converter for Power Factor Correction Authors : Sivachidambaranathan. V, Subhransu Sekhar Dash
24-29
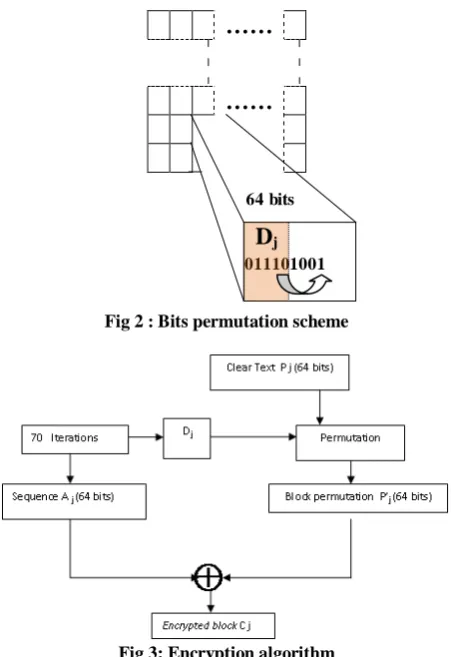
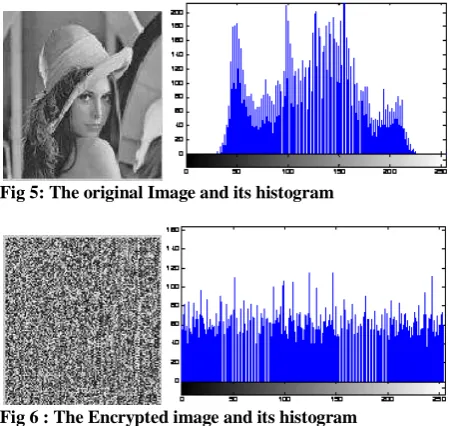
Combining Chaotic Encryption and Frequency Watermarking for Prior and Ahead Image Securing Authors : Hassen Seddik, Ben Braiek Ezzeddine
30-36
Shuffled Frog Leaping Algorithm based Voltage Stability Limit Improvement and Loss Minimization Incorporating FACTS Devices under Stressed Conditions
uthors : L. Jebaraj, C. Christober Asir Rajan, S. Sakthivel
37-44
Diagnosing Vulnerability of Diabetic Patients to Heart Diseases using Support Vector Machines Authors : G. Parthiban, A. Rajesh, S. K. Srivatsa
Hybrid SWOT-AHP Analysis of Saudi Arabia
E-Government
Saleh Alshomrani
Faculty of Computing and IT
King Abdulaziz University
Jeddah, Saudi Arabia
Shahzad Qamar
Faculty of Computing and IT
King Abdulaziz University
Jeddah, Saudi Arabia
ABSTRACT
E-government has become an important phenomenon which attracted every country toward itself. However e-government is facing challenges which have significant effects on its performance. In order to overcome these challenges good strategies are inevitable for the e-government implementation.
In this paper we analyzed Saudi Arabia’s e-government using strengths, weaknesses, opportunities and threats (SWOT) technique and identified the intensities of SWOT factors using analytic hierarchy process (AHP) technique. The prioritized SWOT factors are then used to formulate alternative implementation strategies using TOWS matrix. The results indicated that user centric strategy and bridging digital divide strategy followed by good communication strategy and citizen awareness strategy are the best strategies that should be implemented for successful implementation of e-government in Saudi Arabia.
Keywords
SWOT, AHP, TOWS, E-government
1.
INTRODUCTION
E-government [1] is not a new concept any more. After the successful implementation of the e-commerce, governments were under pressure to provide the public services using modern telecommunication technologies. E-government has been recognized as an important tool for providing public services effectively and efficiently not only to the citizens (G2C) but also to the businesses (G2B), government employees (G2E) and other governments (G2G). E-government utilize modern ICT technologies like internet, World Wide Web (WWW) and mobile technologies for better delivery of public services, improved interactions with businesses and industries, citizen participation and more efficient government management [2] which results in less corruption, increased transparency, revenue growth and reduce cost [3]. Along with these advantages, e-government is facing several political, technical,
Economical and social challenges [4] which restrict this prominent concept to be successfully implemented and if ignored it can results in wastage of government and stakeholders resources. Therefore keeping the challenges faced by the e-government in mind there should be simple, clear and understandable strategies before implementation of the system. E-government strategies are plan for government system and their supporting infrastructure to maximize the ability of the top level management to achieve organization objectives [5].
Strengths, Weaknesses, Opportunities and Threats (SWOT) is a well known strategic planning tool to evaluate the internal
strengths and weaknesses and external opportunities and threats related to the product, service, system and organization [6]. The concept of the SWOT is shown in table 1.
Table 1: SWOT Framework Internal Factors External Factors
Strengths
Available resources which can be effectively used to achieve the objectives.
Opportunities
Favorable situation in the external environment
Weaknesses
Limitations and faults that makes achieving
objectives difficult.
Threats
Unfavorable situation in the external environment
TOWS matrix was developed by Weihrich in 1982 as the next step of SWOT for developing alternative strategies [7]. TOWS matrix provides means to develop strategies based on logical combination of factors related to internal strengths or weaknesses with factor related to external opportunities or threats. TOWS matrix identifies four conceptually distinct strategic groups shown in table 2.
Table 2: TOWS Matrix Internal Strengths
(S)
Internal Weaknesses
(W) External
Opportunities (O)
SO: Maxi-Maxi Strategy
WO: Mini Maxi Strategy
External Threats
(T)
ST: Maxi Mini Strategy
WT: Mini Mini Strategy
matrix of weights, where the assigned relative weight enters into the matrix as an element and reciprocal of the entry goes to the opposite side of the main diagonal as shown in equation 1.
�= � =
1 1 1 2 … 1 �
2 1 2 2 …
. . . . . . . . . � 1 � 2 … � �
(1)
The rows in matrix A indicate ratios of weights of each factor with respect to all others (Eq. (1)). In the matrix when i=j, then aij = 1. Consistency should be checked for the above matrix A using the formula.
��= (� � − �) (� −1) (2)
��= �� �� (3)
CI is the consistency index and RI is random index. The matrix is considered consistent if CR ≤ 0.1 [8].
The purpose of this study is to investigate the combined usage of SWOT and AHP as analytical process for Saudi Arabia e-government strategic planning to overcome challenges faced by the Saudi e-government. In this study, factors that affecting Saudi e-government are determined and examined with SWOT analysis method and weighting of the factors are determined by AHP method.
The rest of the paper is organized as follows. The next section presents literature review of the concept upon which this research is based. Section III presents the methodology used in this research. Section IV discusses results of SWOT-AHP application for Saudi Arabia. The last section concludes the paper.
2.
LITERATURE REVIEW
SWOT (Strengths, Weaknesses, opportunities and Threats) is commonly used situational assessment method [9] which identifies the internal strengths and weaknesses and highlights external opportunities and threats to the product, technology, planning or management. The SWOT analysis popular framework and gained acceptance because of its simplicity and power for strategy development [10]. Researcher used SWOT analysis method in different areas. In [11], the authors applied SWOT analysis technique to e-government in Uttarakhand, India and argued good governance improve the process of decision making and the process by which decisions are implemented. In [12] and [13] the authors reviewed and evaluated the vision, objectives and strategic framework of e-government in Singapore and Iran using SWOT analysis respectively. The author in [14] has applied the SWOT analysis method to evaluate the e-government implementation in Ghana. Some researchers argued that SWOT analysis technique is oversimplified [15] and has a limitation that the importance of the identified factors in decision making cannot be measured quantitatively [16] therefore SWOT alone is insufficient for decision making. In this study Analytic Hierarchy Process (AHP) is combined with SWOT analysis which provides a quantitative measure of importance of identified factors on decision making.
The Analytic Hierarchy Process (AHP) is well known multi-criteria decision making method developed by Thomas Saaty
in 1970. AHP uses hierarchal structure to show the problem and then develop priorities for alternative based on the decision of the user [8]. The application of AHP is common in economic, social, military and management science [17].
As mentioned before, SWOT analysis is a simple and effective method to identify the internal and external factors but cannot measure the intensities of the identified factors. By combining SWOT with AHP it will be easy to evaluate SWOT factors and equate the intensities [18]. Few studies previously used SWOT-AHP combined model to evaluate the e-government. In [19], the authors carried out SWOT-AHP analysis to evaluate e-government stage model. In [20], the author evaluated the e-government of Turkey using SWOT and AHP combined model.
The mentioned literature dealt with prioritization of the SWOT factors, strategies were not included based on prioritized SWOT factors. In this study SWOT-AHP combined model is used to prioritize the internal and external factors and then followed by developing alternative strategies based on those prioritized factors in the form of TOWS matrix.
3.
METHODOLOGY
The methodology adopted for this research consists of the following four steps.
3.1
SWOT Analysis
The first step of the methodology consists of SWOT analysis. SWOT analysis is employed in this study to identify strengths (S), weaknesses (W), opportunities (O) and threats (T) of Saudi Arabia e-government. The SWOT factors are identified from the existing literature available on Saudi Arabia e-government.
Table 3 illustrates the SWOT analysis which identifies the strengths, weaknesses, opportunities and threats to e-government of Saudi Arabia.
Table 3: SWOT Analysis for Saudi Arabia e-government STRENGTHS (S) OPPORTUNITIES (O) S1: Political wiliness and
Public Policy [21]
S2: Citizens focused
policy [22]
S3: Good ICT
Infrastructure in Saudi Arabia [23]
S4: E-Government portal
and sub-portals availability [24]
O1: Strong Economy of
Saudi Arabia [25]
O2: Potential in growth in
ICT Infrastructure [23]
O3: Legal Framework i.e.
e-transaction law and IT Criminal Law [26]
O4: Participation of
academics to support ICT [27]
O5: Better opportunities of
employment for IT professionals [28]
WEAKNESSES (W) THREATS (T) W1: Lack of IT skills [23]
W2: Digital divide [29]
problems
W3: Common culture on
e-transactions [30]
T1: De-centralized
Internet Governance [20]
T2: Individual attitude and
social culture [31]
T3: Privacy and Security
of personal information [32]
3.2
Hierarchical Structure
The four levels hierarchical structure used in this study is shown in figure 1. The top level is the goal of analysis i.e. the evaluation of the Saudi Arabia e-government strategies. The second level is constituted by the evaluation strategies or e-government priority issues which need to be compared. In that context, three Saudi e-government priority issues are; SO1: Effective communication with all e-government stacks holders to increase citizen satisfaction. SO2: Education and Development and SO3: Value Management. Third level of the hierarchy is constituted by the four groups of factors as defined by the SWOT analysis technique: Strengths (S), Weaknesses (W), Opportunities (O) and Threats (T) and the lowest level is constituted by the factors included in each one
of the four groups of the previous level. Figure 1: Hierarchical Structure to Prioritize the SWOT factors of Saudi Arabia e-government
3.3
Pair wise Comparison
There is no standard way to evaluate pair wise comparison. In this study, the authors made a discussion group consist of the people who have the knowledge of e-government and strategic management. The group members discussed and compared two factors. There was a question of which of the two factors has a greater weight in the choice and how much greater, was the main question in the discussion. AHP then transforms each preference to a numerical value which can be compared and evaluated. The relative importance is given a value on a scale of 1–9 [8]. Pair-wise comparisons were made separately for each set of the hierarchy. For example, pair-wise comparisons of factors within each SWOT group are needed. The number of pair wise comparisons is dependent on the number of factors within the same hierarchy level. If there are n factors, the number of comparisons within the level are required based on the equation: � � −1) /2.
O 4 O 3
Goal (G)
Significant Objectives (SO)
SO1 SO2 SO3
Strengths (S)
Weaknesse
s (W)
Opportunit ies (O)
Threats (T)
S
1
S 2
S 3
S 4
W
1
W 3 W 2
O 2 O 1
T 4 T 2
T 3 T 1
Table 4: Factor priority scores and global priority scores for SWOT factors SWOT GROUP SCALING
FACTOR
SWOT FEATURES LOCAL PRIORITY
GLOBAL PRIORITY
Strengths (S) 0.49
S1: Political Willingness S2: Citizen focused policy S3: Good ICT Infrastructure S4: E-Government Portals availability
0.68 [1]
0.14 [2]
0.10 [3]
0.07 [4]
0.333 0.068 0.049 0.034 λmax = 4.208 CI = 0.0693 CR = 0.0770 Weaknesses (W) 0.06 W1: Lack of IT Skills W2: Digital Divide W3: Common culture on e-transactions 0.08 [3]
0.47 [1]
0.13 [2]
0.004 0.028 0.007 λmax = 3.11 CI = 0.06 CR = 0.096 Opportunities (O) 0.36 O1: Strong Economy O2: Potential growth in ICT O3: Legal Framework for e-gov O4: Participation of academics O5: Better employment opportunities for IT professionals 0.18 [3]
0.41 [1]
0.06 [4]
0.04 [5]
0.31 [2]
0.0648 0.1476 0.0216 0.0144 0.1116 λmax = 5.36 CI = 0.09 CR = 0.08 Threats (T) 0.10 T1: De-Centralized Internet Gov T2: Individual attitude T3: Privacy and Security T4: Use of Mobile technology 0.12 [3]
0.63 [1]
0.06 [4]
0.20 [2]
0.012 0.063 0.006 0.02
λmax = 4.26 CI = 0.0889 CR = 0.098
3.4
Strategy formulation using TOWS
Matrix
A successful implementation of the e-government required a comprehensive strategy which is benched marked on global best practices and also applicable to country particular political, economic and social conditions. Several strategies can be proposed for e-government, but the selection or adoption of best strategies is important. This can easily be done by using combined SWOT-AHP method. In order to draw out best strategies, the SWOT table has to be searched for logical combinations. The formulation of those alternative strategies starts with finding those combinations. The TOWS matrix draws four logical combinations (strategies); First, SO-strategies, secondly WO-SO-strategies, thirdly, ST-strategies and fourthly WT-strategies. Table 5 shows the TOWS matrix for Saudi Arabia e-government.
Table 5: TOWS Matrix for Saudi Arabia e-government STRENGHTS WEAKNESSES O
P P O R T U N I T Y
SO Strategies: Maxi-Maxi
Strategy-1: User
Centric Strategy (S2/S4/03/04)
Strategy -2: Legal
framework for e- governance. (S2/03)
WO Strategies: Mini-Maxi
Strategy -3: Bridging
Digital Divide Strategy (W2/W4/O4/O5)
Strategy -4: Human
Capacity Building Strategy (W1/O3/O4)
T H R E A T S
ST strategies: Maxi-Mini
Strategy -5: Centralized
e- government System Strategy (S1/S3//T1/T3)
Strategy -6: Pro-active
Communication Strategy (S3/S4/T3)
WT Strategies: Mini-Mini
Strategy -7: Citizen
Awareness Strategy (W2/W3//T2/T3)
Strategy -8: Internet and
4.
DISCUSSION
This study intended to introduce a simple, acceptable and systematic methodology for e-government of Saudi Arabia. The ultimate success of e-government is dependent on the accuracy of effective SWOT analysis. But the problem in SWOT analysis is that it does not analytically determine the importance of factors. In order to eliminate this drawback, SWOT is combined with AHP which give priorities to the SWOT factors and compared them pair wise. In this study the two techniques were combined to analyze the Saudi Arabia e-government and developed strategies e-e-government in Saudi Arabia.
It can be seen that the values of Saudi Arabia e-government strengths and opportunities are higher than weaknesses and threats. Saudi Arabia e-government strengths are 7.04 times more important than weaknesses (0.480/0.068 = 7.04) and 6.07 times more important than threats (0.480/0.079 = 6.07). Similarly Saudi e-government opportunities are 8.220 times more important than weaknesses and 6.946 times than threats. If we compare the Saudi e-government strengths and opportunities, it is clear from analysis that both factors have almost same importance. Many opportunities are there for Saudi e-government to improve and provide best possible services to citizens and businesses. The data from table 4 is represented by the figure 2.
Figure 2: Pair wise comparison of SWOT features with respect to significant objectives
In Table 5, we suggested some strategies for Saudi e-government. User centric strategy and bridging digital divide strategy followed by good communication strategy and citizen awareness strategy should have adopted by Saudi Arabia for successful implementation and adoption of e-government.
The ultimate aim of the e-government implementation is to provide best possible services to citizens therefore Saudi government should give prime importance to user centric strategy. The advantage of adopting this strategy would be that the citizens will get governmental services any time without any physical location restriction; it will be economical both for citizen and government; citizens will get efficient services and the whole system will be transparent.
Another important strategy that should be adopted by the Saudi Arabia is bridging digital divide. Digital divide is a social issue which is linked to the difference in the level of information between citizens [32]. Some of the factors which cause digital divide in Saudi Arabia are unequal access to information, lack of proper ICT infrastructure in rural areas, senior citizens who have no or low knowledge of modern technologies and low adoption of technology. The strategy for bridging or narrowing the digital divide in Saudi Arabia should include the characteristics like; to provide equal information to the citizen in non-discriminative fashion, develop the ICT infrastructure in the rural areas of the
country, to educate the population especially of the rural areas and to promote ICT skills especially in old age and uneducated people.
Good communication strategy is also must for the success of the e-government. Because of this strategy citizens will be aware of the new ways of getting the governmental services online. The social culture and individual attitude are the two most important threats to the Saudi e-government. This strategy will be helpful in eliminating the negative perception from the minds of people. Citizen awareness is also related to good communication strategy. Saudi government should encourage the people to use the online services and should adopt different means like print, radio and television advertisements to make the citizens aware of the new system.
Security and privacy of personal information and people trust also play an important role in the success of the e-government adoption. Lack of trust in the e-government is the severe hindrance to its growth. Saudi Arabia government should develop a good legal framework for the e-government. A comprehensive legal framework should cover the overall aspects of the e-government from the delivery of service and provision of information to business process re-engineering within the different levels of government and its institutions.
5.
CONCLUSION
For successful implementation and adoption of e-government projects, good strategies are inevitable. Without comprehensive strategies it is difficult to get maximum benefits from the e-government system. In this research we thoroughly studied the e-government in Saudi Arabia. Using SWOT technique, a situational analysis was conducted in order to find out the strengths, weaknesses, opportunities and threats to the e-government of Saudi Arabia. The outcome of the SWOT technique was qualitative and subjective therefore we could not identify that which factors were more important than others. In order to solve this problem the SWOT technique was integrated with AHP technique in order to find quantitative strengths, weaknesses, opportunities and threats for the Saudi Arabia e-government. Based on the numeric results of the SWOT-AHP integration we developed strategies using TOWS method for Saudi Arabia e-government which will support better decision making by the higher authorities of Saudi Arabia e-government project.
In this research the strategies for the Saudi e-government were identified but did not evaluated to find out which strategies should be given importance and should be implemented first. In the future work we can evaluate these strategies using technique like Quantitative Strategies Planning Matrix (QSPM), in order to find the importance of individual strategy quantitatively.
6.
REFERENCES
[1] UN government Survey 2010: Leveraging e-government at the time of financial and economic crisis.
Available from:
http://unpan1.un.org/intradoc/groups/public/documents/u n-dpadm/unpan038853.pdf [Last Accessed on 15th March, 2012]
[2] Government of India. “Promoting e-governance: The
smart way forward”. Available online at:
[3] World Bank e-government.. http://go.worldbank.org/M1JHE0Z280 [Last Accessed on 15th march, 2012]
[4] M. Al-Sebie and Z. Irani: , 2005.,Technical and organisational challenges facing transactional e-government systems: an empirical study, Electronic Government, an International Journal 2005 - Vol. 2, No.3 pp. 247 - 276.
[5] A. Rabaiah and E. Vandijck. 2009. A Strategic Framework of e-Government: Generic and Best Practice, Electronic Journal of e-Government Volume 7 Issue 3, pp. 241 – 258,
[6] A. Avny. 2007. SWOT analysis of e-Government / Annals of University of Bucharest, Economic and Administrative Series, Nr. 1, pp. 43-54.
[7] H. Weihrich. 1982. The TOWS matix- A tool for situational analysis. Long Range Planning. Vol 15, 2. pp. 54-66.
[8] T.L. Saaty. 2008. Decision making with the analytic hierarchy process. International Journal of Service Sciences. Vol 1, No 1.
[9] H.H. Cheng and W.C. Huang. 2006. Application of
quantification SWOT analytical method”. Mathematical
and Computer Modelling. Vol 43, 1-2. pp. 158-169.
[10] D. W. Pickton and S. Wright. 1998. What's swot in strategic analysis?. Strategic Change, vol 7, pp. 101-109.
[11] K. Vaisla and M. Bisht. 2010. SWOT Analysis of e-Initiative in Uttarakhand. International Journal of Computer Applications, Volume 12– No.5, pp. 5-14. [12] H. Ha ., K. Coghill. 2006. .E-Government in Singapore -
A SWOT and PEST Analysis, Asia-Pacific Social Science Review Vol.6 (2), pp.103-130.
[13] F. Rezazadeh. 2011. A SWOT and PEST analysis of e-government in Iran, in proc. of 5thSymposim on advances in science and technology.
[14] F. K. Andoh-Baidoo, and L. Agyepong. 2011 Examining the Preparedness of an Emerging Economy Towards E-Government Implementations: SWOT Analysis. South West Decision Sciences Institute Conference, Houston, TX.
[15] E. K. Valentin. 2005. Away With SWOT Analysis: Use Defensive/Offensive Evaluation Instead. The Journal of Applied Business Research. Vol 21, No 2.
[16] L. Zhaohui. 2011. Marketing Outsourcing of Chinese Sports Clubs, in proc. of IEEE 4th International Conference on Business Intelligence and Financial Engineering.
[17] J. Yang and P. Shi. 2002. “Applying Analytic Hierarchy
process in Firm’s overall performance evolution: A case study of China”, International Journal of Business. Vol 7, Issue 1.
[18] V. Wickramasinghe and S. Takano. 2009 Application of Combined SWOT and Analytic Hierarchy Process (AHP) for Tourism Revival Strategic Marketing
Planning: A Case of Sri Lanka Tourism. Journal of the Eastern Asia Society for Transportation Studies, Vol.8,
[19] S. M. Shareef. Analysis of the e-Government stage model evaluation using SWOT-AHP method”. Available from: roar.uel.ac.uk/jspui/handle/10552/1314 [Last Accessed on 20th February 2012]
[20] Kahraman, C., Demirel, N. C., and Demirel, T. 2007. Prioritization of e-Government strategies using a SWOT-AHP analysis: the case of Turkey, European Journal of Information Systems, Vol. 16, No.3, pp. 284-298.
[21] A. Al-Solbi and S. Al-Harbi. 2008. An exploratory study of factors determining e-government success in Saudi Arabia. Communications of the IBIMA. Volume 4.
[22] A. Abanumy and P. Mayhew. 2005. M-government Implications For E-Government In Developing Countries: The Case of Saudi Arabia, in the proc. of Mobile Government Consortium International.
[23] M. Alshehri and S. Drew. 2010. Challenges of e-Government Services Adoption in Saudi Arabia from an e-Ready Citizen Perspective, World Academy of Science, Engineering and Technology, vol 66.
[24] H. A. Al-Nuaim, 2011. An Evaluation Framework for Saudi E-Government, Journal of e-Government Studies and Best Practices, . Available from: www.ibimapublishing.com/journals/JEGSBP/2011/.../82 0912.pdf [Last Accessed: 20th February 2012]
[25] International Monitory Fund (IMF), http://www.imf.org/external/pubs/ft/survey/so/2011/int09 2111b.htm [Last Accesses 10th March, 2012]
[26] Yesser Program Saudi Arabia. www.yesser.gov.sa [Last Access: 20th February 2012]
[27] Cisco Systems Inc, “Saudi Arabia University Deploys
Advanced IT to Support New Education Model”.
Available from:
http://www.cisco.com/en/US/prod/collateral/switches/ps 5718/ps708/32023_PMU.pdf [Last Accessed: 22th February 2012]
[28] Council of Foreign Relations., 2011. Saudi Arabia in the New Middle East, [Last Accessed: 22th February 2012]
[29] F. Al-Sobhi and V. Weerakkody., 2010. The role of intermediaries in facilitating e-government diffusion in Saudi Arabia, in proc. of European and Mediterranean Conference on Information Systems.
[30] Regional Profile 2009. Information Society Portal for the
ESCWA Region.
http://isper.escwa.un.org/Default.aspx?TabId=65&item= 23 [Last Accessed 10th March, 2012]
[31] M. Alanezi., A.K.Mahmood and Shuib Basari. 2011. Review of e-Government Policy and Outcomes in the Kingdom of Saudi Arabia. International Journal of Computer Science and Information Security., vol 9, No 8.
[33] P.K. Sarkar and M. Singh., 2008. Narrowing the digital divide: the Australian situation. International Journal on Computer Science and Information Systems. Vol. 3, No. 2, pp. 27-35.
Saleh Alshomrani is a faculty member in the Information
Systems Department at King Abdulaziz University, Saudi Arabia. He is also serving as the Vice-Dean of Faculty of Computing and Information Technology, and the Head of Computer Science Department – North Jeddah branch at King Abdulaziz University. He earned his Bachelor degree in Computer Science (BSc) from King Abdulaziz University, Saudi Arabia in 1997. He received his Master degree in Computer Science from Ohio University, USA in 2001. He did his Ph.D. in Computer Science from Kent State University, Ohio, USA in 2008 in the field of Internet and Web-based Distributed Systems. Currently he is actively working in the area of Web and Internet Systems.
Shahzad Qamar is working as a Lecturer in Faculty of
Computing and IT at King Abdulaziz University Saudi Arabia. Shahzad Qamar has done his MS in Wireless and Mobile Networks from Bournemouth University UK.
Shahzad Qamar’s research focus is on the new emerging
technologies like e-government, M-government, Green and Cloud Computing, QoS in WiMAX and WiFi Networks.
Appendix A: Pair wise comparisons matrices for SWOT factors
Strengths S1 S2 S3 S4 Local Weights S1: Political wiliness and Public Policy 1 7 7 7 0.68 S2: Citizens focused policy 1/7 1 2 2 0.14 S3: Good ICT Infrastructure in Saudi Arabia 1/7 1/2 1 2 0.10 S4: E-Government portal and sub-portals 1/7 1/2 1/2 1 0.007
availability
Total 1.43 9 10.50 12 1 λmax = 4.208 CI = 0.0693 CR = 0.0770
Weaknesses W1 W2 W3 Local Weights W1: Lack of IT skills 1 1/7 1/3 0.08 W2: Digital divide 7 1 5 0.72 W3: Common culture on e-transactions 3 1/5 1 0.19 Total 11 1.34 6.33 1 λmax = 3.11 CI = 0.06 CR = 0.09
Opportunities O1 O2 O3 O4 O5 Local weights O1: Strong Economy of Saudi Arabia 1 1/5 3 5 1 0.18
O2: Potential in growth in ICT Infrastructure 5 1 7 7 1 0.41 O3: Legal Framework 1/3 1/7 1 2 1/7 0.06 O4: Participation of academics to support ICT 1/5 1/7 1/2 1 1/7 0.04 O5: Better opportunities of employment for 1 1 7 7 1 0.31
IT professionals
Total 7.53 2.49 18.5 22 3.29 1
λmax = 5.36 CI = 0.09 CR = 0.08
Threats T1 T2 T3 T4 Local Weights T1: De-centralized Internet Governance 1 1/5 3 1/3 0.12
Sign Language Recognition in Robot Teleoperation
using Centroid Distance Fourier Descriptors
Rayi Yanu Tara
1, Paulus Insap Santosa
2, Teguh Bharata Adji
3EE & IT Department, Gadjah Mada University
Yogyakarta, Indonesia
ABSTRACT
Commanding in robot teleportation system can be done in several ways, including the use of sign language. In this paper, the use of centroid distance Fourier descriptors as hand shape descriptor in sign language recognition from visually captured hand gesture is considered. The sign language adopts the American Sign Language finger spelling. Only static gestures in the sign language are used. To obtain hand images, depth imager is used in this research. Hand image is extracted from depth image by applying threshold operation. Centroid distance signature is constructed from the segmented hand contours as a shape signature. Fourier transformation of the centroid distance signature results in fourier descriptors of the hand shape. The fourier descriptors of hand gesture are then compared with the gesture dictionary to perform gesture recognition. The performance of the gesture recognition using different distance metrics as classifiers is investigated. The test results show that the use of 15 Fourier descriptors and Manhattan distance-based classifier achieves the best recognition rates of 95% with small computation latency about 6.0573 ms. Recognition error is occurred due to the similarity of Fourier descriptors from some gesture.
Keywords
Hand Gesture, Sign Language, Fingerspelling, CeFD, Fourier Descriptor.
1.
INTRODUCTION
Hand gesture recognition provides a natural way to communicate with machines (e.g. robot). The use of robot, especially in teleoperation, can reduce the risk factor of task failures and human harms during several activities such as hazardous material handling [1]. Sign language is often used as input method in teleoperation system. Several works that employ visually captured hand gesture in robot teleoperation system has been researched since last decade. Color camera was used to acquire hand image, and the acquired image was processed with Artificial Neural Network (ANN) [2], Fuzzy C-means clustering (FCM) [3], or Support Vector Machine (SVM) [4] to classify the meanings of each hand gesture.
In a sign language, hand shape can give information of hand gestures. Recognizing gestures through hand shape is a challenging process. Some sign language has the similar hand shape, and similar hand shape can be interpreted as different sign because of different viewpoint. Due to its complexity, the research of hand gesture recognition based on hand shape is continuously performed. Recognition of hand posture using two different shape descriptors had been conducted in [5]. Fourier descriptors and hu moments were compared in this research. This experiment used 64 fourier coefficients. Two databases of gestures were used in this experiment (i.e. Triecsch database [6] and self-made database). The result of
this experiment showed that fourier descriptors give very good recognition rate rather than hu moments. Performance comparison of fourier descriptors and geometric moment invariants was presented [7]. The comparison was used ASL database to analyze discrimination and feature invariance of hand images. The results showed that both descriptors are unable to differentiate some classes in ASL. Another shape descriptor comparison in hand posture recognition from video was also presented in [8]. The research compares: 1) Hu moments, 2) Zenike moments, 3) Fourier descriptors (common set), and 4) Fourier descriptors (complete set). The recognition also evaluated the use of several classifiers to measure similarity of hand posture with the stored hand posture in the database. Bayesian classifier, support vector machine, k-nearest neighbor, and Euclidean distance were evaluated. Overall result of the presented research showed that the common set fourier descriptors has the highest recognition rate when combined with k-nearest neighbor, reaching 100% in classifiying learning set, and 88% in test set. An application of real time hand gesture recognition system using fourier descriptors was presented in [9]. The presented system uses 56 fourier descriptors from 64 fourier coefficients, and linear combination of Hidden Markov Models (HMM) and Recurrent Neural Network (RNN). With real time processing rates of 22 frames per second and 91.9% correct classification; the presented system achieved good performance. Another approach of hand gesture recognition using fourier descriptors and hidden markov models was also introduced [10]. The system was able to recognize 20 different gestures with average recognition rate of above 90%. All of the research in [5], [7], [8], [9], and [10] were used the same shape signature (i.e. complex coordinate) in fourier descriptors calculation and used hand image from color camera.
An evaluation of the use of different shape signature in fourier descriptors calculation for shape retrieval was presented [11]. The research compared four shape signatures: 1) complex coordinate, 2) centroid distance, 3) curvature signature, and 4) cumulative angular function. Euclidean distance was used as similarity measurement. To measure the effect of each shape signature in representing a shape, precision and recall ratio were used. The result showed that the use of centroid distance signature in calculating fourier descriptors is significantly better than other shape signature. The centroid distance fourier descriptors is robust and information preserving. This is due to the centroid distance, which captures both local and global features of the shape.
depth imager is utilized to acquire hand image. The centroid distance fourier descriptors are used as the feature vector of inputted gesture. To perform recognition, the fourier descriptors of inputted hand image are compared with the fourier descriptors of each character stored in the gesture dictionary. To obtain the best recognition rate, different classifiers will be evaluated. The following section will clearly explain our research methodology.
2.
METHODOLOGY
An overview about the methodology of this research is illustrated in Figure 1.
This research employs depth imager to acquire hand image from the human signers. The use of depth imager has benefit in segmenting hand image. Rather than color-based segmentation, segmentation in depth image is more robust since the lighting variation does not affect the image quality. Contour of the segmented hand image is then used to generate centroid distance signature. Hand contour coordinates are arranged into centroid distance signature with equal arc-length point sampling, results in N sampled signature point. Fourier transform of the centroid distance signature yields fourier descriptors, which represent feature of each hand gesture. Generally, this research is separated into two phases: dictionary build phase and classification phase. In the dictionary build phase, the fourier descriptors of each character are stored into a database to develop gesture dictionary. The gesture dictionary and comparison method are derived from [12]. The classification phase has the similar step, except that the fourier descriptors are compared with the dictionary using distance metric as classification methods. The result of classification phase is the meaning of the acquired gesture sign.
3.
FEATURES EXTRACTION
3.1
Hand Segmentation
Microsoft KinectTM is utilized as depth imager in this research [13]. Human hand is assumed as the closest object in the
imager field of view. The closer the object distance to the imager, the lower the voxel (depth pixel) value is. Threshold operation is applied to the image with a threshold value. The threshold value is acquired by summing the hand depth and the closest object distance. This method is adopted from [14]. Figure 2 shows the original image and the segmented hand image.
Figure 2. Depth image (top) and the segmented hand image (bottom)
3.2
Centroid Distance Signature
Shape signature is used to represent shape contour of an object. The shape signature itself is a one-dimensional function that is derived from shape contour coordinate. Centroid distance signature is one of several types of shape signature. In this research, the segmented hand image is processed with canny edge detection to extract the hand contour. Afterward, the centroid distance signature of hand images is generated from the hand contour. Three hand shapes with same gesture and their centroid distance signature are shown in Figure 3. The centroid distance signature r(t) is computed from the coordinates of each contour sequence by applying Equation (1) and Equation (2).
21 2 2
)
(
)
(
)
(
t
x
t
x
cy
t
y
cr
(1))
(
1
),
(
1
t
y
L
y
t
x
L
x
c
c
(2)Depth Image Acquisition
Hand Segmentation
Hand Contour Extraction
Centroid Distance Signature
Centroid Distance Fourier Descriptor Classification
Classified Gesture
Gesture Dictionary
Figure 1. Research methodology
(a) (b) (c) (d)
Figure 3. Three hand images with same gesture and its centroid distance signature (d); original (a-blue), scaled up 50%
where xc and yc are the centroid coordinate of hand shape, x(t)
and y(t) are the coordinates of each contour, L is the contour length, and t is the contour index. As shown in Figure 3, the centroid distance signature r(t) has the translation invariant property. Rotation of the hand image causes circular shift, and scaling of hand image changes the signature value linearly.
3.3
Centroid Distance Fourier Descriptors
Centroid distance Fourier Descriptors (CeFD) was empirically proven for having higher performance rather than other fourier descriptors [11], [15]. In general, the CeFD is obtained by applying fourier transform on a centroid distance signature. The discrete fourier transform of centroid distance signature r(t) is given in Equation (3).
N
nt
j
t
r
N
a
N t n
2
exp
)
(
1
1 0, n=0, 1, …, N-1 (3)
N is the total number of sampled points from the signature, and an is the fourier descriptor. This research assigns 64 as the
N value. The sampling points of centroid distance signature are obtained by applying equal-arc length sampling, which is done by dividing the total contour length L by N. Since the centroid distance signature is real value, there are only N/2 different frequencies in the fourier transform. To make the fourier descriptors invariant to scaling, rotation, and translation, Equation (4) is employed to normalize the fourier descriptors. 0 2 / 0 3 0 2 0 1
,...,
,
,
a
a
a
a
a
a
a
a
CeFD
N, (4)
where CeFD is the normalized fourier descriptors. The descriptors use only the magnitude values since the phase values are variant to rotation. The dc-component (i.e. a0) is
used to normalize the remaining fourier descriptors to achieve scale invariant.
Figure 4 shows the fourier descriptors of three images from Figure 3.
Figure 4. Fourier descriptors of three images in Figure 3
According to the illustration, the normalized fourier descriptors of each character have small deviation. The normalized FDs are proven invariant to translation, rotation, and scaling. When used in shape retrieval, the retrieval precision degrades when using 10 FDs and does not improve significantly when using 15 FDs [16]. Thus, only the first 15 fourier descriptors is employed in this research.
4.
GESTURES CLASSIFICATION
4.1
Gesture Dictionary
Five gestures are employed as gesture vocabulary. These gestures are adopted from ASL fingerspelling. The character similarity graph in [7] is considered when choosing each character, which will be used as the five gestures. The similarity distance of FDs between each character in sign language is essential since it can reduce the possibility of false recognition. Table 1 shows the gesture vocabulary. Fingerspelling illustration in the gesture vocabulary is obtained from [17].
Table 1. Gesture vocabulary
Fingerspelling Meaning
Turn Right
Turn Left
Forward
Stop
Backward
In the gesture dictionary, each character has 15 fourier descriptors as features. To develop reliable gesture dictionary, each character is represented by five signers. Each of signer gives two hand poses with different conditions. The total training dataset is 50 gestures, 10 gestures for each character. Having 10 variations of gesture data for each character is enough since the fourier descriptors themselves have the invariant property. The dictionary GD is represented in a matrix, as shown in Equation (5).
ij i i jFD
FD
C
FD
C
FD
C
FD
FD
FD
C
GD
...
...
...
...
...
...
...
...
...
...
...
...
...
...
1 31 3 21 2 1 12 11 1, (5)
where FDij is the jth fourier descriptors of ith fingerspelling
gestures, and Ci is the character of ith fingerspelling gesture.
between the complete gesture dictionary and the reduced gesture dictionary will be covered in Section 5.
4.2
Gesture Classifier
Classifying hand gesture is performed using similarity degree matching. Euclidean distance, Manhattan distance, and Canberra distance are evaluated in this research. In similarity degree matching with distance metric, the smallest distance is considered as a match. Thus, the smallest FDs distance between a character in gesture dictionary and inputted gesture is taken as a classified gesture sign. Equation (6) can be used to calculate both Euclidean distance and Manhattan distance.
y
i
y ij i
j
FD
GD
D
1
, (6)where Dj is the distance between inputted gesture and j th
character in dictionary. Euclidean distance calculation is performed by using 2 as y, and using 1 as y for Manhattan distance. For the Canberra distance calculation, Equation (7) is used. Canberra distance CDj is very sensitive to small
variation in input value.
i i ij
ij i j
GD
FD
GD
FD
CD
, (7)5.
EXPERIMENT AND RESULT
Several experiments are conducted to measure overall performance of the classifier. Testing dataset is created by acquiring 90 gestures for each character from five different signers, having a total of 450 gestures as testing dataset. Both training dataset and testing dataset are used in this experiment. When using the training dataset and complete gesture dictionary, the recognition rate achieves 100% with three different distance metrics (i.e. Euclidean distance, Manhattan distance, and Canberra distance). Nonetheless, the use of reduced gesture dictionary gives lower recognition rates of: 1) 95.7% with Euclidean distance; 2) 97.2% with Manhattan distance; and 3) 92.8% with Canberra distance. Good recognition result with training dataset is very common, since the training dataset is used to build the dictionary. Further test using the testing dataset is conducted to validate the performance of each classifier with the gesture dictionary. Recognition results of three classifiers using both datasets are shown in Table 2.
Table 2. Recognition results with complete data set
Gesture Complete Dictionary Reduced Dictionary
ED MD CD ED MD CD
B 97 97 68 97 97 64 L 87 92 84 86 92 90 5 99 98 99 99 98 99 S 100 100 96 100 100 96 1 91 88 82 90 88 83
Average 94,8 95 85,8 94,4 95 86,4
From the results, the Manhattan distance achieves the highest average recognition rate of 95% in classifying the complete dataset, whilst the Canberra distance has the lowest average recognition rate. The Euclidean distance has the lowest recognition rate in recognizing gesture “L”. Meanwhile, the
Canberra distance has the same problem for gesture “3” and
“5”. Overall, the Manhattan distance slightly outperforms Euclidean and Canberra distances. The use of different gesture dictionary gives no significant effect to the recognition rate. For three different distance metrics, slight variation under 1% occurs when the reduced dictionary is employed.
Table 3 shows the confusion matrix for recognition using Manhattan distance that explicitly details the recognition rate result. Gesture “S” obtains the best recognition rate of 100%. Recognition of gesture “1” gets the lowest recognition rate of 88%. Thus, the recognition is often misclassified as gestures
“B” and “1”. Gesture “L” has the most ambiguous gesture sign over another gesture even though having 92% recognition rate. The “L” gesture is often recognized as gestures “5”, “S”, and “1”.
Table 3. Confusion matrix for recognition using Manhattan distance and complete dictionary
B L 5 S 1
B 97 2 0 0 1
L 0 92 4 2 2
5 0 0 98 2 0
S 0 0 0 100 0
1 9 3 0 0 88
This experiment also evaluates the computation latency. Different image resolutions are used to approximate the actual computation loads. This test uses square images from Figure 3.a with resolutions of: 1) 400 pixels; 2) 600 pixels; and 3) 800 pixels. This experiment utilizes a PC with Ubuntu OS, 2.0 GHz dual core processors, and 3 GB RAM. Table 4 shows the computation latency test. It explains that the total computation load is significantly raised when the image resolution increases in the process of contour extraction and CeFD calculation. Segmentation and classification are less affected with the variation of image sizes. Classification process is the fastest process among the processes done in this research. This occurs since it only calculates the distance between feature set of inputted gesture with feature set in gesture dictionary. With computation time of 6.0573 ms, this method has the capability to process an 800 x 800 pixels image of 165 frames per second.
Table 4. Computation latency test result
Process Image 1 (ms)
Image 2 (ms)
Image 3 (ms)
Segmentation 2,7841 2,8043 2,8869 Contour
extraction 0,6972 1,5398 2,8752 CeFD 0,0874 0,1684 0,2917 Classification
(dictionary) 0,0045 0,0034 0,0035
Total 3,5732 4,5159 6,0573
6.
CONCLUSION AND FUTURE WORK
is built as the reference of each sign character. Comparison is performed by measuring fourier descriptor similarities between inputted gesture and the gesture dictionary which results in recognized gesture sign. Recognition of gesture sign using three different distance metrics (i.e. Euclidean, Manhattan, and Canberra) and two dictionary sets (i.e. complete, and reduced) is evaluated. Five persons are involved to develop gesture dataset of 100 images per gesture signs. Hence, the total images are 500 images. The dataset is separated into two datasets (i.e. 50 for training dataset and 450 for testing dataset). From the experimental results, the classification of inputted gesture achieves the best recognition with Manhattan distance metric. With average recognition rate of 95%, the accuracy of Manhattan distance metric in classifying gesture sign based on its feature vector (i.e. centroid distance fourier descriptors) is considered high in this area of research. Total computation latency in processing square image of 800 pixels in each side is 6.0573 ms, which is equal to 165 processes per second. Moreover, with computation latency of less than 10 ms, this method is fast enough to be employed in real time application because some imager only has acquisition rate of less than 100 frames per second (e.g. Kinect sensor has 30 FPS). Future work will aim at improving the recognition rate by applying other classification methods and developing more reliable gesture dataset. Another issue will be the stability evaluation of the current method when applied in real time application.
7.
REFERENCES
[1] Kwok, K. 1999. Research on the use of robotics in hazardous environments at Sandia National Laboratories. 8th International Topical Meeting on Robotics and Remote System, Pittsburgh.
[2] Ariyanto, G. 2007. Hand gesture recognition using Neural Networks for robotic arm control. National Conference on Computer Science & Information Technology, Indonesia.
[3] Wachs, J. 2007. Real-time hand gesture telerobotic system using the Fuzzy C-Means clustering, Fifth Biannual World Automation Congress.
[4] Liu, Y., Gan, Z., and Sun, Y. 2008. Static hand gesture recognition and its application based on Support Vector Machines. Ninth ACIS International Conference on Software Engineering, Artificial Intelligence, Networking, and Parallel / Distributed Computing.
[5] Conseil, S., Bourennane, S., and Martin, L. 2007. Comparison of fourier descriptors and hu moments for hand posture recognition. European Signal processing Conference (EUSIPCO).
[6] Triesch, J. and Malsburg, C.v.d. 1996. Robust classification of hand postures against complex backgrounds. IEEE International Conference on Automatic Face and Gesture Recognition, 1996, pp. 170-175.
[7] Barczak, A.L.C., Gilman, A., Reyes, N. H., and Susnjak, T. 2011. Analysis of feature invariance and discrimination for hand images: Fourier descriptors versus moment invariants. International Conference Image and Vision Computing New Zealand IVCNZ2011.
[8] Bourennane, S., and Fossati, C. 2010. “Comparison of shape descriptors for hand posture recognition in
video.” Signal Image and Video Processing, 2010: 1-11. [9] Wah Ng, C. 2002. “Real-time gesture recognition system
and application.” Image and Vision Computing 20.13-14, 2002: 993-1007.
[10]Chen, F. 2003. “Hand gesture recognition using a real -time tracking method and hidden Markov
models.” Image and Vision Computing 21.8 2003: 745-758.
[11]Zhang, D., and Lu, G. 2002. A comparative study of fourier descriptors for shape representation and retrieval. Proceedings of Fifth Asian Conference on Computer Vision. 2002: 1-6.
[12]Santosa, P.I., and Tara, R.Y. 2012. Dictionary of basic hand gesture sign language. 2012 International Conference on Future Information Technology and Management Science & Engineering (FITMSE 2012), Hongkong.
[13]Microsoft Kinect. http://en.wikipedia.org/wiki/Kinect. 2012.
[14]Tara, R.Y., Santosa, P.I., and Adji, T.B. 2012. “Hand Segmentation from Depth Image using Anthropometric
Approach in Natural Interface Development”,
International Journal of Scientific and Engineering Research Vol: 3-5, May 2012.
[15]Shih, F.Y. 2008. Image Processing and Pattern Recognition: Fundamentals and Techniques, Wiley and Sons, Canada.
[16]Zhang, D. 2002. Image Retrieval Based on Shape. PhD Thesis, Monash University.
Energy Saving and Survival Routing Protocol for Mobile
Ad Hoc Networks
Baisakh
Department of Computer Science and Engineering,
Jaypee University of Engineering and Technology,
Guna, Madhya Pradesh, India
Nileshkumar R. Patel
Department of Computer Science and Engineering,
Jaypee University of Engineering and Technology,
Guna, Madhya Pradesh, India
ABSTRACT
In this paper we propose a method to enhance the life time as well as improve the performance of the mobile ad hoc networks (MANET). Since MANET consists of devices that run on batteries, having limited amount of energy and due to the self-configuring and dynamic change of topology, all operations are performed by the node itself. More ever if any new technology and advancement are introduced in the MANET then the overhead of computation will also be performed by the individual nodes. All these computation will consume a lot of battery energy during the process of communication between sources to destination. In such scenario, we have considered DSR routing protocol as our base protocol and we attempt to make some modification on it which acts into an efficient energy saving and survival DSR (ESSDSR). We have considered DSR because it is one of the protocol which does not take energy into account and once the dedicated path is established between source to destination then it will keep sending through that path until the link is broken due to any of the intermediate node dies out of energy or mobility of the node away from its neighbor nodes and so it is considered as one of the unconventional routing protocol. Whereas ESSDSR acts not only as an energy efficient routing protocol but also shows an energy survival instinct. It establishes a path from source to destination where packet transmission can be sent for a longer period of time through the nodes having high level of residual battery power. It also informs the source node if any node has low battery energy, so that a new path can be discovered for the same destination prior the path get disconnected and data transmission get affected. And so the number of packet drops and retransmission can be reduced. Hence we can conclude that our proposed method enhances the performance of the networks as well as enhances the network life time. We have implemented our proposed protocol in ns-2.34 and evaluated
the life time of the networks as well as the node’s life time has
been improved as compare to traditional DSR with a higher ratio.
General Terms
Mobile Ad Hoc NetworksKeywords
MANET, Energy Consumption in MANET, DSR, ESSDSR.
1.
INTRODUCTION
Ad Hoc Network is a multi-hop wireless networks which consists of autonomous mobile nodes interconnected by means of wireless medium without having any fixed infrastructure. It’s quick and easy deployment in a situation
where it’s highly impossible to set up any fixed infrastructure
networks, has increased the potential used in different applications in different critical scenarios. Such as battle
fields, emergency disaster relief, conference and etc. A mobile ad hoc network [MANET] can be characterized by the mobile nodes which have freedom to move at any direction and have the ability of self-configuring, self-maintaining and self-organizing themselves within the network by means of radio links without any fixed infrastructure like based station, fixed link, routers, and centralized servers. And so the whole functionality along with routing mechanisms are incorporated in every node which indeed consume a lot of battery power. Other process like topological updation when a node moves out of the network, sending and receiving packets, processing packets and routing the packet through their neighboring node also make use of heavy power consumption [1, 2]. So we assume in MANET the power gets consumed in mainly two ways. First, due to transmitting data to a desired recipient. Secondly, mobile node might offer itself as an intermediate forwarding node in the networks. The power level of the node are also getting affected the ease with which route can be established between two end points.
1.1
Energy Consumption in MANET
The routing protocols play a significant role in mobile ad hoc networks as the nodes are dynamic in nature and each node can participate in routing the data packets. In such scenario, energy efficient routing protocols are needed for Ad Hoc networks, especially when there are no routers, no base stations and no fixed infrastructure [3, 4]. So to establish the correct and efficient routes from a source to destination is not the ultimate aim of any routing protocols, rather to keep the networks functioning as long as possible without any interruption and with less battery consumption at each node level, should also be the objective for these routing protocols.
These goals can be accomplished by minimizing mobile
node’s energy during both the active as well as inactive
communications. Active communication is when all the nodes of the route are participating in receiving and forwarding of data. Minimizing the energy during active communication is possible through two different approaches.
Transmission power Control
Load distribution
routing path instead of considering shortest path like in the traditional DSR protocol use.
These metrics are:
Energy consumed per packet
Time to network partition
Variation in node power level is:
Cost per packet
Maximum node cost
The tradeoff between frequency of route update dissemination and battery power utilization is one of the major design issues of ad hoc network protocols. In ad hoc networks, mainly the routing protocols are classified into two types on the basis of the routing information update mechanism the protocols are divided into two types:
Table driven (proactive) Protocol
On-demand (reactive) Protocol
In the reactive protocol every individual node maintains the route for the entire networks whereas in reactive protocol, a route to a certain destination is established when there is a demand from a source for that particular destination. And so the source initiates it by invoking the Route Discovery Method. Dynamic Source Routing (DSR) protocol belongs to the reactive protocol class.
As the MANET nodes are operated by limited battery power,
this power