Use of denaturing gradient gel electrophoresis for
the identification of mixed oral yeasts in human
saliva
Manjula M. Weerasekera,
1,2Chris H. Sissons,
1Lisa Wong,
1Sally Anderson,
1Ann R. Holmes
3and Richard D. Cannon
3Correspondence M. M. Weerasekera [email protected]
Received 25 July 2012 Accepted 8 October 2012
1Dental Research Group, School of Medicine and Health Sciences, University of Otago, Wellington 6242, New Zealand
2Department of Microbiology, Faculty of Medical Sciences, University of Sri Jayewardenepura, Nugegoda 10250, Sri Lanka
3Department of Oral Sciences, Faculty of Dentistry, University of Otago, Dunedin 9016, New Zealand
A PCR-denaturing gradient gel electrophoresis (DGGE) method was established for the simultaneous presumptive identification of multiple yeast species commonly present in the oral cavity. Published primer sets targeting different regions of theSaccharomyces cerevisiae26– 28S rRNA gene (denoted primer sets N and U) and the 18S rRNA gene (primer set E) were evaluated with tenCandidaand four non-Candidayeast species, and twentyCandida albicans isolates. Optimized PCR-DGGE conditions using primer set N were applied to presumptively identify, by band matching, yeasts in the saliva of 25 individuals. Identities were confirmed by DNA sequencing and compared with those using CHROMagarCandidaculture. All primer sets yielded detectable DGGE bands for all species tested. Primer set N yielded mainly single bands and could distinguish all species examined, including differentiatingCandida dubliniensisfromC. albicans. Primer set U was less discriminatory among species but yielded multiple bands that distinguished subspecies groups withinC. albicans. Primer set E gave poor yeast discrimination. DGGE analysis identified yeasts in 17 of the 25 saliva samples. Six saliva samples contained two yeast species: three containedC. albicansand threeC. dubliniensis. C. dubliniensiswas present alone in one saliva sample (total prevalence 16 %). CHROMagar culture detected yeasts in 16 of the yeast-containing saliva samples and did not enable identification of 7 yeast species identified by DGGE. In conclusion, DGGE identification of oral yeast species with primer set N is a relatively fast and reliable method for the simultaneous presumptive identification of mixed yeasts in oral saliva samples.
INTRODUCTION
Yeasts, predominantly
Candida
spp., are part of the normal
microbial flora of the human oral cavity.
Candida albicans
is the most common species, followed by
Candida
tropicalis
,
Candida glabrata
,
Candida parapsilosis
,
Candida
guilliermondii
,
Candida krusei
and
Candida dubliniensis
(Cannon
et al.
, 1995; Martins
et al.
, 2010). The oral
carriage rate of
Candida
in healthy humans ranges from
40 to 60 % (Samaranayake, 2009). The non-
Candida
yeasts
Pichia ohmeri
,
Geotrichum
spp.,
Trichosporon
spp.,
Rhodotorula
spp.,
Cryptococcus
spp. and
Saccharomyces
cerevisiae
are found occasionally (Cannon
et al.
, 1995;
Gonc¸alves
et al.
, 2006). In addition, multiple yeast species
are frequently present (Soysa
et al.
, 2006).
Candida
spp. are
opportunistic pathogens causing a variety of oral
pathol-ogies (Williams & Lewis, 2011).
C. albicans
possesses
adhesive, acidogenic and proteolytic properties that are
characteristic of caries pathogens, and it is associated with
caries and periodontal disease (Beighton
et al.
, 1995; Klinke
et al.
, 2011).
Downloaded from www.microbiologyresearch.org by IP: 36.72.116.125
2005). As a consequence,
C. dubliniensis
is likely to be
under-reported and misidentified using most of the
available phenotypic identification methods, including
culture on chromogenic media, which is used widely in
clinical laboratories for presumptive yeast identification
(Campanha
et al.
, 2005; Madhavan
et al.
, 2011).
Molecular techniques provide more accurate methods for
identifying and fingerprinting micro-organisms (Borman
et al.
, 2008; Kuba, 2008; Neppelenbroek
et al.
, 2006; Sidrim
et al.
, 2010; Trtkova & Raclavsky, 2006), and have been
used widely to identify and type yeast. Techniques include
PCR, real-time PCR, electrophoretic karyotyping,
restric-tion fragment length polymorphism, fluorescence
in situ
hybridization, randomly amplified polymorphic DNA
analysis, multilocus sequence typing and pyrosequencing
(Dassanayake & Samaranayake, 2003; Moter & Go¨bel,
2000; Trtkova & Raclavsky, 2006). However, each
tech-nique has its own advantages and limitations, with many
requiring a culture step to isolate the target species
(Trtkova & Raclavsky, 2006). Hence, culture bias and the
loss of minor species can occur. Real-time PCR methods
have been developed to detect medically important
Candida
spp. in clinical samples (Fricke
et al.
, 2010; Hsu
et al.
, 2003; Khan
et al.
, 2009; Pryce
et al.
, 2003; White
et al.
,
2004) using species-specific (Hsu
et al.
, 2003) and
pan-fungal (White
et al.
, 2004) primers, and combinations of
primers in multiplex real-time PCR methods (Carvalho
et al.
, 2007). Although these novel techniques are sensitive,
specific and rapid for
Candida
detection and estimation,
they also have their own limitations. Generation of
false-negative results can be an issue (White
et al.
, 2004). The
main limitation is their specificity for particular species or
groups of species in a situation where multiple and/or
unpredicted species may occur. The use of PCR together
with denaturing gradient gel electrophoresis (DGGE) as
described here enables detection of the presence of such
species and frequently their presumptive identification,
even if they are present as minor populations.
DGGE based on 16S and 26–28S rRNA gene sequences has
been used to characterize complex microbial communities,
including those in saliva, dental plaque and plaque
microcosms (Ledder
et al.
, 2006; Li
et al.
, 2006; Rasiah
et al.
, 2005; Zijnge
et al.
, 2003). It has also been applied to
monitor fungal communities in complex ecosystems such
as soil, and in wine and food fermentations (Cocolin
et al.
,
2000; Meroth
et al.
, 2003; Muccilli
et al.
, 2011; Oros-Sichler
et al.
, 2006; Vilela
et al.
, 2010). The use of this technique to
identify yeasts in the oral cavity has potential both as a
diagnostic tool and as a method to advance our
understanding of these complex ecosystems.
This study had two aims: firstly, to develop a rapid and
reliable DGGE method to detect and identify yeast species
in human saliva samples where multiple species may be
present by evaluating primer sets based on different regions
of
S. cerevisiae
rRNA genes (Cocolin
et al.
, 2000;
Oros-Sichler
et al.
, 2006; Van Elsas
et al.
, 2000); and secondly, to
compare the performance of DGGE with CHROMagar
Candida
culture medium in identifying yeasts from the
saliva of different individuals.
METHODS
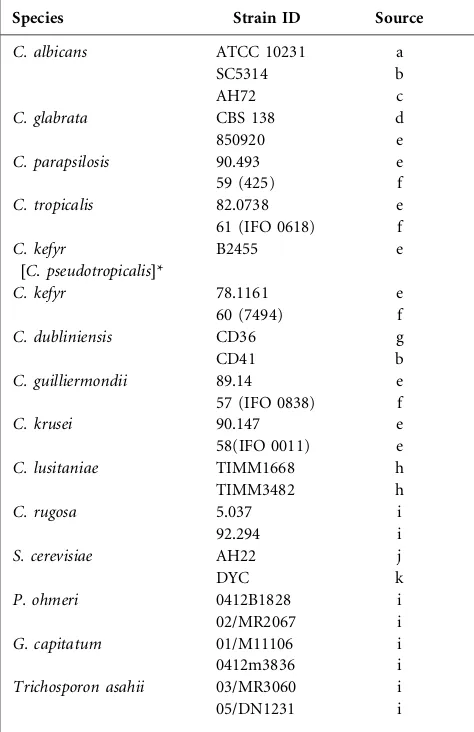
Yeast strains and culture.The yeast strains used as controls for the standardization of DGGE protocols, and to evaluate the level of discrimination between and within species, are listed in Table 1 (see also Fig. 2B). They were cultured in yeast peptone glucose (YPG) broth[10 g Bacto yeast extract (BD) l21, 20 g Bacto peptone (Difco Laboratories) l21, 20 g D-(+)-glucose (Merck) l21] at 30uC with shaking (200 r.p.m.) and maintained on YPG 1 % agar.
Saliva collection.Saliva was collected with informed consent from 25 healthy donors and with ethical approval from the Wellington Ethics Committee (WGT/04/02/003). Donors abstained from oral hygiene for 24 h prior to saliva collection. The chewing of chicle gum was used to stimulate salivary flow and increase plaque abrasion. Portions (1 ml) of each saliva sample were centrifuged at 11 760gfor
10 min and the pellets stored at280uC until analysed.
Analysis of yeasts in saliva by culture.Saliva (50ml) was spread
on CHROMagarCandidaplates in triplicate and incubated at 35uC for 48–72 h (Beightonet al., 1995). Colony counts (c.f.u. ml21) were recorded. Presumptive identification by colony morphology and colour was recorded as:C. albicans, blue–light green/leaf green colour;
C. tropicalis, dark blue–grey hue with purple halo in the agar;C.
krusei, large rough colonies with pale pink colour; andC. dubliniensis,
dark green (Colemanet al., 1997). C. albicans and C. dubliniensis appeared as different shades of green.
Nucleic acid extraction.Nucleic acid was extracted from 24 h YPG yeast cultures and from the 1 ml saliva pellets using a modification of a published bead-beater extraction procedure (Walter et al., 2000). From the yeast cultures, a 100ml portion was transferred to a
sterile bead-beater tube (BioSpec Products) containing 0.3 g sterile zirconium beads (0.1 mm diameter; BioSpec Products) and 900ml
sterile distilled water. Saliva pellets were resuspended in 1 ml sterile distilled water by vortexing prior to nucleic acid extraction. TN150 buffer[10 mM Tris/HCl (pH 8), 150 mM NaCl](1 ml) was added to the samples in the bead-beater tubes, which were then vortexed and centrifuged at 11 760g for 5 min at 4uC. The supernatant was
discarded and the pellets washed again with 1 ml TN150 buffer. Another 1 ml TN150 buffer was added to the washed pellets, which were processed in a mini bead beater (model 3110BX; BioSpec Products) at 480 r.p.m. for 3 min. The tubes were immediately cooled on ice and then centrifuged at 11 760gfor 5 min at 4uC. The
supernatant (300ml) was placed in a sterile 2 ml microcentrifuge
tube containing 400ml Phase Lock Gel Heavy (Qiagen) and
extracted twice with 200ml UltraPure buffer-saturated phenol
(pH 8; Bio-Rad) and 200ml chloroform : isoamyl alcohol (24 : 1),
followed by a final extraction with 400ml chloroform : isoamyl
alcohol (24 : 1). The upper phase was transferred to a sterile microcentrifuge tube, and 1 ml cold ethanol (100 %) and 50ml
3 M sodium acetate was added, and the nucleic acid precipitated at 220uC for 18 h. The solution was centrifuged at 11 760g for
20 min at 25uC and the nucleic acid pellet air dried and then dissolved in 30ml TE buffer[10 mM Tris/HCl (pH 8), 1 mM EDTA].
Each extraction batch included a negative control lacking the sample/organisms. The bead beating extraction procedure was compared with direct DNA extraction after enzymic lysis of the cell wall using two commercial kits: a High Pure PCR template preparation kit (Roche Diagnostics) and a Master Pure yeast DNA purification kit (Epicentre Biotechnologies).
M. M. Weerasekera and others
DNA extracted using kits and total nucleic acid extracted using bead beating were quantified by measuring absorbance (at 260 and 280 nm) using a NanoDrop spectrophotometer (NanoDrop Technologies) and evaluated by electrophoresis. Nucleic acid extracted using the bead-beater method was tested for possible PCR inhibition, for example by RNA. No inhibition occurred. Hence, in
further PCR-DGGE optimization steps, extracted nucleic acid was used. For electrophoresis, extracted nucleic acid (4ml) was mixed
with 1ml 2 % gel loading dye[0.5 % (w/v) bromophenol blue sodium
salt (Sigma), 2 % (w/v) 0.5 % xylene cyanol (Sigma), 70 % (v/v) glycerol]and separated by electrophoresis in 16TAE[40 mM Tris/ HCl (pH 8), 20 mM acetic acid, 1 mM EDTA]for 1 h at 120 V on a 1.5 % (w/v) agarose gel, stained with 16 SYBR Safe gel stain (Invitrogen) and viewed by UV transillumination in a Syngene ChemiGenius bio-imaging system using GeneSnap version 6.00.19 software (Synoptics) to quantify the DNA.
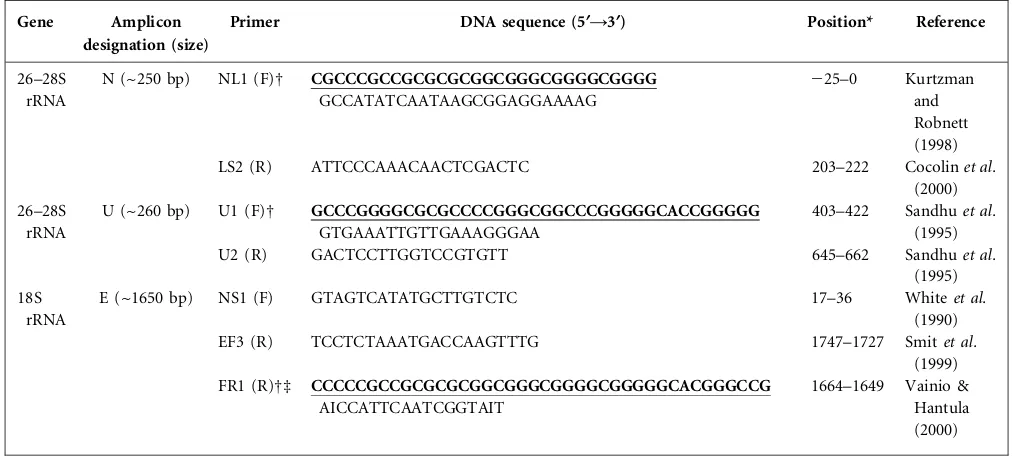
PCR conditions.Three primer sets, designated N, U and E (Table 2) were evaluated. Primer set N comprised primer NL1 (Kurtzman & Robnett, 1998) and LS2 (Cocolinet al., 2000), and targeted the D1 region of the 26–28S rRNA gene, yielding amplicons of ~250 bp. Primer set U comprised primers U1 and U2, and also targeted the 26–28S rRNA gene, yielding amplicons of ~260 bp (Sandhu et al., 1995). Primer set E comprised primer NS1 (Whiteet al., 1990), EF3 (Smitet al., 1999) and FR1 (Vainio & Hantula, 2000), which were used in a semi-nested PCR to amplify the V1–V9 region of the 18S rRNA gene, yielding a product of ~1650 bp (Oros-Sichler et al., 2006).
PCR was performed in 0.2 ml tubes using a Hybaid Px2 thermal cycler. For direct PCR, the 50ml reaction mixture consisted of PCR
buffer (5ml) supplemented with 4 mM MgCl2(FastStart TaqDNA polymerase kit; Roche Applied Science), 0.2 mM each dATP, dCTP, dGTP and dTTP (0.4ml; Invitrogen), 0.1mM each primer
(Invitrogen), 2.5 U FastStartTaqDNA polymerase (Roche Applied Science) and 2ml template nucleic acid (~20 ng). The reactions were
performed for 30 cycles for DNA from pure cultures and 35 cycles for DNA from saliva. Following an initial 4 min denaturation at 95uC, the PCR cycle consisted of 95uC for 30 s, 53uC for 45 s and 72uC for 60 s, with a final extension at 72uC for 7 min. These optimized PCR conditions were then used for all the results for primer sets N and U described in this study.
Semi-nested PCR was performed by modification of a published procedure (Oros-Sichler et al., 2006). The first amplification step involved 25 PCR cycles with the NS1 and EF3 primers. The 25ml
reaction mixture consisted of 2ml template nucleic acid (~20 ng),
PCR buffer (5ml) supplemented with 4 mM MgCl2(Roche Applied
Science), 2 % (w/v) DMSO, 0.2 mM each dATP, dCTP, dGTP and dTTP (Invitrogen), 0.2mM each primer (Invitrogen) and 2.5 U
FastStartTaqDNA polymerase (Roche Applied Science). Reactions were performed with an initial denaturation at 94uC for 5 min, followed by 25 cycles of 94uC for 30 s, 47uC for 45 s and 3 min at 72uC, with a final extension at 72uC for 10 min. Diluted amplicons comprising 2ml (1 : 10) of the first step reaction were then used as
template for the second amplification, which involved 20 PCR cycles with NS1 and the GC-clamped primer FR1. The cycle parameters were as for the first amplification except that the annealing temperature was 48uC. All PCR experiments included a negative (no DNA) control. PCR products (4ml) were visualized on a 1.5 %
(w/v) agarose gel as described above.
Optimization of PCR protocol
PCR additives.The effects of adding betaine (0.8, 1.2 or 1.6 %, w/v),
DMSO (1, 5 or 10 %, v/v) or formamide (1.25, 5 or 10 %, v/v) on PCR amplification were evaluated.
Thermocycling parameters for primer sets N and U.The annealing
temperatures for C. albicans PCRs were optimized by testing temperatures between 50 and 60uC. Different MgCl2 concen-trations (1–4 mM) were also tested. The PCR cycle number was varied: 30, 35, 40, 42, 45 and 50 cycles were examined.
Table 1.Yeast species and sources
The original sources of the yeast species were: a, American Type Culture Collection, Manassas, VA, USA; b, Department of Molecular & Cell Biology, Institute of Medical Sciences, University of Aberdeen, UK; c, A. Cassone, Instituto Superiore di Sanita, Rome, Italy; d, Centraalbureau voor Schimmelcultures, Utrecht, The Netherlands; e, Department of Health, National Institute, Porirua, New Zealand; f, M. Niimi, Kagoshima University, Japan; g, D. C. Coleman, Dublin Dental University Hospital, Ireland; h, Institute of Medical Mycology, Teikyo University, Japan; j, A. Fink, Massachusetts Institute of Technology, Cambridge, MA, USA; k, wild-type baker’s yeast, DYC Foods, Auckland, New Zealand, i, K. Rogers, Mycology Laboratory, Auckland Hospital, New Zealand. J. Schmid, Massey University, Palmerston North, New Zealand, supplied all theC. albicansisolates listed in Fig. 2.
Species Strain ID Source
C. albicans ATCC 10231 a
SC5314 b
AH72 c
C. glabrata CBS 138 d
850920 e
PCR inhibition by DNA samples. Equal volumes of extracted template nucleic acid from three replicate DNA extractions from saliva (one donor) were pooled and serially diluted tenfold in sterile TE buffer. A 10ml portion of each dilution was mixed with 0.5 ngC.
albicansATCC 10231 DNA in 2ml TE buffer, and PCR was performed
using primer set N. The PCR products were stained and visualized by UV transillumination and were considered positive if the expected ~250 bp amplicons were detected.
DGGE conditions
The DCode universal mutation detection system (Bio-Rad) was used for DGGE analysis. For the N and U primer sets, electrophoresis was performed using a 1.0 mm polyacrylamide gel [ratio of 8 % (w/v) acrylamide to bis-acrylamide, 37.5 : 1] with a 35–50 % denaturing gradient[100 % denaturant was 7 M urea and 40 % (v/v) formamide], which increased in the direction of electrophoresis. The gels were prepared and run with 16TAE buffer at a constant voltage of 130 V at 60uC for 4.5 h. The PCR products (10ml) were mixed with 10ml
2 % gel loading dye. After electrophoresis, the gels were stained at room temperature for 30 min in 16 SYBR Safe gel stain and visualized by UV transillumination. A range of denaturant concen-trations (0–80 %) and different durations of electrophoresis (3.5–5 h) were tested for primer sets N and U, resulting in 35–50 % denaturant being used as the standard condition except for primer set E. For primer set E, DGGE was performed using published conditions: a 7.5 % polyacrylamide gel, with an 18–38 % denaturing gradient and run with 16TAE at a constant voltage of 170 V for 18 h at 58uC (Oros-Sichleret al., 2006).
DGGE analysis of saliva from 25 donors using primer set N.DGGE
was performed as described with PCR products (35ml) mixed with
15ml 2 % gel loading dye and electrophoresis as described above.
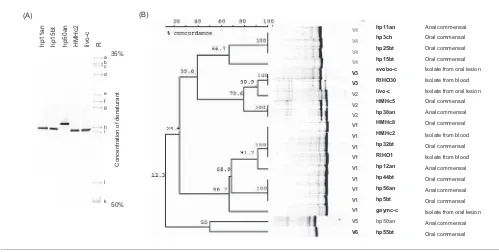
Development of a yeast DGGE reference profile.To standardize
among the DGGE gels and to facilitate identification of oral yeast
species by band matching, a DGGE reference panel was developed. Yeast species that were known to be oral commensals and pathogens that generated rRNA gene amplicons with different mobilities on a denaturing gel were used as the reference panel. The species (strains) were: Candida rugosa(5.037), Geotrichum capitatum (01/M11106),
C. tropicalis (82.0738), C. parapsilosis (90.493), C. guilliermondii
(89.14), Candida kefyr (78.1161), C. glabrata (850920), C.
dubliniensis (CD36), C. albicans (ATCC 10231), P. ohmeri (02/
MR2067) and C. krusei (90.147). DNA from each species was amplified separately with primer set N and then mixed in equal volumes in order to ensure a reproducible reference ladder standard. A variable yield of the DNA of each species resulted if a mixture of DNA from the reference species was amplified, possibly due to template competition and PCR amplification bias. The reference mixture (10ml) was combined with 15ml gel loading dye and loaded
to gels flanking the samples.
Sequence analysis of DGGE bands. The middle portion of the
selected DGGE band was taken by inserting a sterile pipette tip into the polyacrylamide gel and removing a piece of the gel, which was transferred to a sterile tube containing 50ml sterile
DNase/RNase-free water and incubated overnight at 40uC. The eluted DNA was amplified with the respective GC-clamped primer set (N or U) and the products visualized on a DGGE gel with the original sample as a reference to confirm that the reamplified product migrated to the original position. The eluted DNA from the original band was then reamplified using primers without the GC clamp. The resulting PCR products were purified using a GENECLEAN Turbo PCR purification kit (Q.BIOgene) according to the manufacturer’s protocol and quantified by measuring absorbance (at 260 and 280 nm) using a NanoDrop ND-1000 spectrophotometer and software (NanoDrop Technologies). PCR amplicons were sequenced in both directions using the PCR primers as sequencing primers (at the Allan Wilson Centre, Massey University, New Zealand).
Fig. 2.(A) DGGE profiles obtained from the indicatedC. albicansstrains with primer set N. Lane R shows the yeast reference profile: a,C. rugosa; b,G. capitatum; c,C. tropicalis; d,C. parapsilosis; e,C. guilliermondii; f,C. kefyr; g,C. glabrata; h,
Downloaded from www.microbiologyresearch.org by IP: 36.72.116.125
Reproducibility, specificity and limit of detection (sensitivity) of
DGGE forC. albicans.To evaluate the reproducibility of DGGE, two
saliva samples from two different donors were split into three aliquots (1 ml each) and extracted in parallel, followed by DGGE with both N and U primer sets. The detection limit for yeast was evaluated by tenfold dilutions of an overnight culture ofC. albicans(ATCC 10231) containing 108cells ml21in 1 % peptone water and processed for DNA extraction, PCR and DGGE using both sets of primers. Twenty strains
ofC. albicans(listed in Fig. 2B) were used to determine the specificity of
the DGGE system using the N and U primer sets. Each of these 20C.
albicansstrains had been isolated from a different individual and had
been fingerprinted by probingEcoRI digests of total DNA with the repetitive sequence Ca3 to determine the genetic relationships (Schmid
et al., 1990), and were representative of all the major clades
documented by Schmidet al.(1995). They comprised 14 commensal strains isolated from the oral cavity (9 isolates) or from anal specimens (5 isolates), 3 blood isolates and 3 isolates from oral lesions.
Statistical analysis.DGGE banding patterns were assessed by cluster analysis with a Dice similarity coefficient constructed using UPGMA within the BioNumerics program version 4 (Applied Maths).
RESULTS
Nucleic acid extraction and optimization of PCR
procedures
Large and reproducible amounts of intact nucleic acid (up
to 400 ng
ml
21) were obtained from pure yeast cultures and
from saliva using the bead-beating method. The two
commercial kits tested were quick and simple but the DNA
yields were low (up to 25 ng
ml
21in 30
ml). PCR using
either the N or U set of primers failed to amplify yeast
DNA from saliva samples with 30 cycles. However, with 35
cycles, bands were visible. From single-species DNA,
multiple bands appeared after 42 or more amplification
cycles, probably due to non-specific amplification. The
optimal concentration of MgCl
2for PCR was 4 mM. The
addition of PCR additives showed no detectable
amplifica-tion change, or improvement, when N and U primer sets
were used with 35 PCR cycles. Saliva-extracted nucleic acid
was not inhibitory to
C. albicans
PCR amplification.
DGGE analysis of yeast species
The N, U and E sets of primers were evaluated based on
their ability to distinguish 14 different yeast species by
DGGE. A range of DGGE conditions was tested to
determine the best separation and clarity of PCR products
obtained from pure yeast cultures. Optimized DGGE
conditions in 8 % (w/v) polyacrylamide for N and U
primer sets were 35–50 % denaturant with a run time of
4.5 h. PCR fragments generated from all yeast species
tested showed a distinct band in DGGE gels with all three
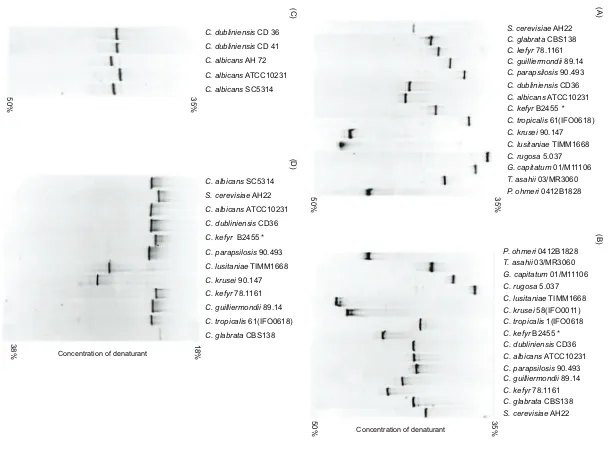
primer sets (Fig. 1A, B, D). With primer set N, agarose gel
electrophoresis showed no detectable differences in
mobil-ity among species and hence in amplicon size. With primer
set U, there was some mobility variation, particularly
evident with the non-
Candida
spp.
Primer set N yielded the best band separation by DGGE for
individual species. Bands for the 14 yeast species migrated
Table 2.S. cerevisiae-derived rRNA gene primers used in this study
Gene Amplicon
designation (size)
Primer DNA sequence (5§A3§) Position* Reference
26–28S rRNA
N (~250 bp) NL1 (F)D CGCCCGCCGCGCGCGGCGGGCGGGGCGGGG GCCATATCAATAAGCGGAGGAAAAG
225–0 Kurtzman and Robnett (1998)
LS2 (R) ATTCCCAAACAACTCGACTC 203–222 Cocolinet al.
(2000) 26–28S
rRNA
U (~260 bp) U1 (F)D GCCCGGGGCGCGCCCCGGGCGGCCCGGGGGCACCGGGGG GTGAAATTGTTGAAAGGGAA
403–422 Sandhuet al. (1995)
U2 (R) GACTCCTTGGTCCGTGTT 645–662 Sandhuet al.
(1995) 18S
rRNA
E (~1650 bp) NS1 (F) GTAGTCATATGCTTGTCTC 17–36 Whiteet al.
(1990)
EF3 (R) TCCTCTAAATGACCAAGTTTG 1747–1727 Smitet al.
(1999) FR1 (R)Dd CCCCCGCCGCGCGCGGCGGGCGGGGCGGGGGCACGGGCCG
AICCATTCAATCGGTAIT
1664–1649 Vainio & Hantula (2000)
F, Forward primer; R, reverse primer.
*Relative to the start of the rRNA ORF of the gene.
DA GC clamp (bold, underlined) was added to primers NL1, U1 and FR1 for DGGE analysis.
dInosine nucleotides (I) were present at positions 2 and 17 of the primer. M. M. Weerasekera and others
at different positions on the gel (Fig. 1A). Duplicate strains
of the same yeast species, except for the strains designated
C. rugosa
, yielded bands on the gel in the same position
(data not shown). DGGE using primer set N differentiated
C. albicans
and
C. dubliniensis
(Fig. 1A, lanes 6 and 7).
Apart from strain hp50an (Fig. 2A, lane 3), bands from the
other 19
C. albicans
strains migrated in the same position
as the band from the reference
C. albicans
strain. The strain
hp50an amplicon had 99 % sequence identity with
C.
albicans
strain TA62 (GenBank accession no. AF156537.1)
and 98 % sequence identity with
C. dubliniensis
(GenBank
accession no. AB363780.1).
Primer set U did not provide adequate separation of
amplicons from different yeast species (Fig. 1B).
C. albicans
(ATCC 10231),
C. glabrata
,
S. cerevisiae
,
C. parapsilosis
and
C. dubliniensis
yielded bands of different mobilities but
they were very close to each other in a relatively narrow
area of the upper gel. The two
C. kefyr
bands, including
strain B2455 formerly identified as
Candida
pseudotropica-lis
, were at a similar position in the lower part of the gel.
Each strain of
C. albicans
,
Candida lusitaniae
,
C.
para-psilosis
,
C. guilliermondii
and
C. rugosa
shown in Table 1
migrated differently (data not shown).
S. cerevisiae
(DYC),
C. krusei
(90.147) and
C. rugosa
(5.037) yielded multiple
bands, and bands from
C. albicans
ATCC 10231 migrated
differently from those from
C. albicans
strains SC5314 and
AH72 (Fig. 1C, lanes 3–5).
C. albicans
SC5314 and AH72
bands were separated from the
C. dubliniensis
bands,
but those from
C. albicans
strain ATCC 10231 and
C.
dubliniensis
(Fig. 1C, lanes 1, 2 and 4) co-migrated.
DGGE analysis of the 20
C. albicans
strains yielded
different multiple banding patterns in six groups, V1–V6
(Fig. 2B). The major cluster, V1, contained nine
pre-dominantly commensal strains. The second major cluster,
V4, contained four commensals. Overall, the commensal
strains showed more variation than the strains isolated
from clinical samples.
C. albicans
strain hp50an, which
produced a band with primer set N that migrated
differently from bands from other
C. albicans
strains, also
yielded a different migration pattern with primer set U
(designated group V5). Thus, DGGE using primer set U
could differentiate between some
C. albicans
strains but
was not suitable for use in identifying individual yeast
species, especially in mixed yeast populations.
Semi-nested PCR with primer set E generated bands with
poor separation between several species, and most bands
were found in a narrow range on the gel (Fig. 1D). This was
probably due to the high molecular mass of the PCR
products (~1650 bp). Primer set E was not studied further.
Detection limit for
C. albicans
and the
reproducibility of DGGE
C. albicans
ATCC 10231 at a concentration of 10
3cells
ml
21produced visible bands on the DGGE gel, whilst no
bands were detected with a concentration of 10
2cells ml
21,
although products were detected on agarose gels following
PCR. This gave a limit of detection under optimal
conditions of 10
3cells (as 1 ml of sample was processed
to release nucleic acids), which was equivalent to DNA
from 13 cells in the DGGE well, due to additional dilution
steps. Identical triplicate DGGE patterns were generated
from each of two saliva donors, indicating the
reproducib-ility of the DGGE (data not shown).
Comparison of CHROMagar
Candida
and
PCR-DGGE identification of yeasts in saliva
Using primer set N, DGGE was applied to examine the
yeast populations in saliva samples from 25 donors (Fig. 3),
and compared with isolation and presumptive
identi-fication by CHROMagar
Candida
culture (Table 3).
Presumptive identification by DGGE was based on
comparing the migration distances of bands in the
DGGE gels with those of strains in the yeast reference
panel (Fig. 3), and was confirmed by sequencing the
individual bands (Table 3). Seventeen of the twenty-five
saliva samples gave a positive result for yeast by PCR (Fig.
3). Six samples (35 %) contained more than one yeast
species (Fig. 3, lanes 3, 6, 13, 14, 16 and 17). Fourteen
samples contained
C. albicans
, including saliva sample 12,
which was negative by culture.
Culture analysis yielded positive results for 16 of the 25
saliva samples. Only two (numbers 6 and 16) showed
evidence of multiple yeast strains.
C. albicans
was
presumptively identified in 13 samples by its characteristic
colony morphology of a light green to dark green colour
(Table 3). Saliva sample 5 yielded pale pink colonies with a
distinctively large rough shape and irregular edges, typical
of
C
.
krusei
, which were identified as
C. krusei
by DGGE
(Fig. 3, lane 5) and confirmed by sequencing.
DGGE identified
C. dubliniensis
in four samples (Fig. 3,
lanes 3, 13, 15 and 17), three of which also contained
C.
albicans
. However, no
C. dubliniensis
was detected in
samples 3, 13, 15 or 17 by CHROMagar
Candida
; only
C.
albicans
was detected in three of these samples (numbers 3,
13 and 17), indicating that the
C. dubliniensis
was
misidentified on CHROMagar as
C. albicans
. In the fourth
sample (number 15), an unidentified yeast (yeast C; see
below) isolated on CHROMagar
Candida
was shown to be
C. dubliniensis
by DGGE and sequencing.
Downloaded from www.microbiologyresearch.org by IP: 36.72.116.125
lane 6) but was in fact found to be
Candida pararugosa
by
sequencing. The two additional non-
Candida
yeasts (yeasts
A and D in saliva samples 2 and 16) that were unidentified
on CHROMagar yielded unmatched DGGE bands and
were identified by sequencing as
S. cerevisiae
and
Hanseniaspora uvarum
, respectively. A further unmatched
DGGE band in saliva sample 14 (yeast E), undetected on
CHROMagar, was identified by sequencing as
Pichia
guilliermondii
.
DISCUSSION
DGGE using primer set N under the optimized conditions
that were established in this study enabled the
simultan-eous presumptive identification of multiple oral yeast
species. It yielded species-specific amplicons that were
generally well separated and gave better species
discrim-ination than those generated by primer sets U and E. It
clearly separated
C. dubliniensis
from
C. albicans
, except for
strain hp50an, which had atypical properties and has an
uncertain taxonomic relationship to
C. albicans
(Schmid
et al.
, 1990).
The DGGE analysis of 25 saliva samples showed that
primer set N is suitable for identifying yeast communities
in the oral cavity in which multiple species are present at
significant frequency. This study is believed to be the first
to describe DGGE yeast analysis of human samples. A
report that stated that yeast DGGE had been applied to
vaginal biofilms in fact described application of simple
yeast-specific PCR and bacterial DGGE to these biofilms
(Devillard
et al.
, 2005). The present analysis was performed
using saliva samples and is likely to be similarly applicable
to dental plaque and other human-associated biofilms.
Primer set U was unsuitable for mixed yeast analysis
because multiple banding patterns were observed in some
species, resulting in ambiguous identification or
misiden-tification of species. Several strains of
C. albicans
also
co-migrated with
C. dubliniensis
. The different groups of
C.
albicans
banding patterns observed with primer set U may
be due to the highly variable nature of the 26–28S rRNA
gene region and/or due to multiple copies of 26–28S rRNA
R 1 2 3 4 5 6 7 8 9 10 11 R 12 13 14 15 16 17 R 35%50%
Concentration of
denaturant
Fig. 3.DGGE profiles of PCR products obtained from the nucleic acid extracted directly from saliva using primer set N. Lanes: 1–17, saliva samples; R, yeast reference profile (see Fig. 2). Yeast samples labelled A, E and D were species that did not correspond to any in the reference lane.
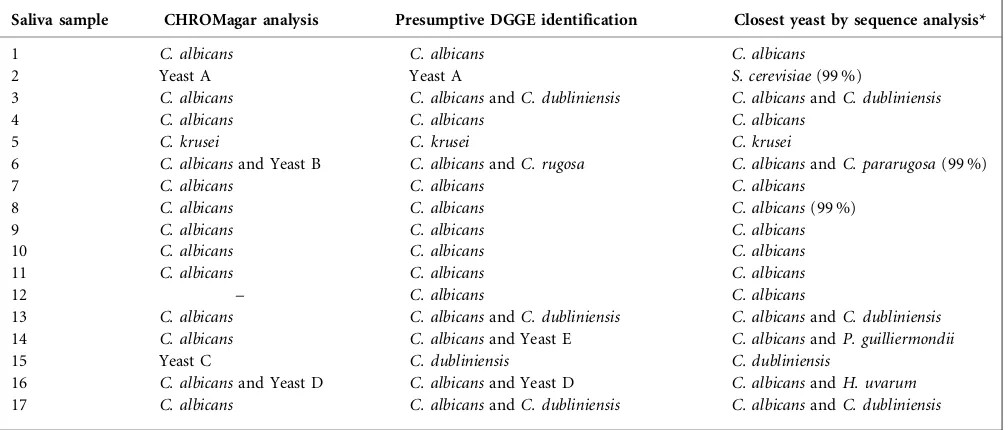
Table 3.Presumptive yeast identification by CHROMagarCandida and DGGE, and confirmation of DGGE (primer set N) band
species by sequence analysis for the 17 of the 25 saliva samples positive for yeast by PCR
Saliva sample CHROMagar analysis Presumptive DGGE identification Closest yeast by sequence analysis*
1 C. albicans C. albicans C. albicans
2 Yeast A Yeast A S. cerevisiae(99 %)
3 C. albicans C. albicansandC. dubliniensis C. albicansandC. dubliniensis
4 C. albicans C. albicans C. albicans
5 C. krusei C. krusei C. krusei
6 C. albicansand Yeast B C. albicansandC. rugosa C. albicansandC. pararugosa(99 %)
7 C. albicans C. albicans C. albicans
8 C. albicans C. albicans C. albicans(99 %)
9 C. albicans C. albicans C. albicans
10 C. albicans C. albicans C. albicans
11 C. albicans C. albicans C. albicans
12 – C. albicans C. albicans
13 C. albicans C. albicansandC. dubliniensis C. albicansandC. dubliniensis
14 C. albicans C. albicansand Yeast E C. albicansandP. guilliermondii
15 Yeast C C. dubliniensis C. dubliniensis
16 C. albicansand Yeast D C. albicansand Yeast D C. albicansandH. uvarum
17 C. albicans C. albicansandC. dubliniensis C. albicansandC. dubliniensis
*Sequence identity of the DGGE band: all were 100 % identical to the yeast sequence found in GenBank, except for those where 99 % identity is shown.
M. M. Weerasekera and others
genes within a single strain possessing sequence diversity
(Marshall
et al.
, 2003). The advantage of this primer set is
its potential to identify intra-species variation within
C.
albicans
. With further evaluation, this might assist with the
identification of particular strains associated with disease
(Romeo & Criseo, 2011).
Primer set E showed poor discrimination among yeast
species. The 18S rRNA gene region amplified by primer set
E targets a region of the gene that is highly conserved in the
reference yeast species and yields amplicons longer than
those optimal for DGGE analysis, probably accounting for
its poor level of discrimination, which has been observed
previously (Kowalchuk
et al.
, 1997).
The comparison of DGGE with culture analysis applied to
the total yeast community in saliva samples illustrated the
strengths and weaknesses of each approach. Culturable
yeast species can be characterized according to
morpho-logical and physiomorpho-logical characteristics, but this requires
2–3 days of culture, does not detect minor or uncultivable
yeast species, and may also underestimate the number and
diversity of the total oral yeast community present.
CHROMagar
Candida
could presumptively identify only
three
Candida
species (
C. albicans
,
C. krusei
and
C.
tropicalis
) by colony colour. Both
C. albicans
and
C.
dubliniensis
strains give variable shades of green on
CHROMagar plates, and it was not possible to
differ-entiate accurately between these two species. Although
CHROMagar
Candida
is sometimes used to differentiate
these two species, the results are usually uncertain
(Campanha
et al.
, 2005; Ellepola
et al.
, 2003).
C.
dubliniensis
,
C. parapsilosis
and
C. glabrata
are frequently
isolated from human immunodeficiency virus-infected
patients and have different susceptibilities to azole
antifungals; hence, accurate identification of these species
is important. The development of this DGGE method
using primer set N could be applied as a tool for their
detection.
DGGE yeast analysis also has strengths and limitations. The
technique requires specialist equipment and expertise. Its
major strength is the detection of a wide range of yeast
species in mixtures, identifiable by band matching, with
further confirmation possible by sequencing. Due to
potential PCR amplification bias, band quantification does
not necessarily relate directly to microbial abundance. The
likelihood of bias associated with differential and
non-specific amplification during PCR (Polz & Cavanaugh,
1998) was reduced by optimizing the PCR and is of
reduced importance where detection only of the presence
of a species is sought. Using band matching, DGGE can
only presumptively identify species. DNA from dead or
uncultivable or low-prevalence cells is also likely to be
amplified and visualized. Nucleic acid extraction by bead
beating effectively takes 1 working day with a further day
required for DGGE analysis, comparable with the time
required for CHROMagar culture. Faster DNA isolation
procedures would allow the analysis in 1 working day,
although the extraction kits tested gave low yields. In
practice, about 15 samples per gel, allowing for 3 sets of
reference standards, can be analysed reliably. The detection
limit was 10
3cells ml
21in the original saliva, a
concentration found in some colonized individuals (R.D.
Cannon, unpublished observations). Yeast was detected in
17 out of 25 saliva samples, one more than by CHROMagar
culture.
Yeast population dynamics of the oral cavity
The prevalence of
Candida
spp. in the oral cavity has
been documented as 40–60 % among healthy humans
(Samaranayake, 2009).
C. albicans
can be detected in the
mouths of between 20 and 60 % of healthy individuals
(Samaranayake, 2009). Given that most studies of the
incidence of yeasts and
C. albicans
carriage in the mouth
are culture based and cross-sectional, not longitudinal, this
is probably an underestimation.
In this study, DGGE identified yeasts in the saliva of 17 out
of 25 donors (68 %). Six had multiple yeast species present.
CHROMagar
Candida
culture found yeasts in only 16 of
the 25 donors (64 %), and only 2 were identified as having
multiple yeast species. Despite the small sample number,
and the random convenience samples of apparently healthy
adult donors, this overall yeast carriage rate in saliva, most
commonly
C. albicans
, agrees with reported findings
(Ellepola & Samaranayake, 2000; Samaranayake, 2009).
The second most common yeast identified by DGGE was
C. dubliniensis
(16 %), which was present at a much higher
frequency than in previous reports from healthy
popula-tions (~3 %; Loreto
et al.
, 2010). Our isolation of
C.
dubliniensis
together with
C. albicans
is in agreement with
previous reports (Willis
et al.
, 2000). This apparently high
prevalence of
C. dubliniensis
may reflect
misidentifi-cation in some earlier studies, as in the present study
C. dubliniensis
could not be identified reliably by
CHROMagar
Candida
.
C. dubliniensis
is often present at
higher frequencies in human immunodeficiency
virus-positive patients and patients with diabetes, and its
pathogenic specificity is still uncertain (Moran
et al.
,
2012). Hence, it is important to distinguish it from other
Candida
spp. (Loreto
et al.
, 2010).
Downloaded from www.microbiologyresearch.org by IP: 36.72.116.125
2004).
C. pararugosa
is rarely isolated from the human
oral cavity – it was isolated from one healthy denture
wearer (Giammanco
et al.
, 2004).
C. rugosa
is isolated
more frequently, especially in diabetes mellitus patients
(Gonc¸alves
et al.
, 2006).
C. pararugosa
has been isolated
from raw milk and milk products (Cocolin
et al.
, 2002;
Seiler & Busse, 1990). Hence, this particular isolate of
C.
pararugosa
could be food associated.
H. uvarum
, which was
identified in saliva sample 16, is also rarely isolated from
the oral cavity (Emmanouil-Nikoloussi
et al.
, 1994), but
is also associated with food (Hierro
et al.
, 2006).
P.
guilliermondii
, a teleomorph of
C. guilliermondii
, is
routinely isolated from sputum (San Milla´n
et al.
, 1997),
and may also be derived from processed food (Nielsen
et al.
,
2008) and wine grapes (Li
et al.
, 2010).
In conclusion, DGGE analysis of yeast species associated
with the oral cavity (saliva) using primer set N can be used
for their presumptive identification in mixtures in a single
analysis. It is a promising, effective and relatively fast
method of obtaining species differentiation without the
need to perform conventional culture and time-consuming
phenotypic characterization, which can underestimate the
diversity of yeast species present. It was applied successfully
for the presumptive identification of mixed yeasts in
human saliva samples and could probably be applied to the
detection of yeasts in human-associated biofilms.
ACKNOWLEDGEMENTS
M. M. Weerasekera was supported by a NZAID (New Zealand Aid Programme) Commonwealth Scholarship 2005–2008. This research was funded by the Health Research Council and Wellington Medical Research Foundation, New Zealand. We thank Dr Jan Schmid for providingC. albicans strains and Karen Rogers, Auckland Hospital, Auckland, New Zealand, for providing several yeast species.
REFERENCES
Beighton, D., Ludford, R., Clark, D. T., Brailsford, S. R., Pankhurst, C. L., Tinsley, G. F., Fiske, J., Lewis, D., Daly, B. & other authors
(1995).Use of CHROMagarCandidamedium for isolation of yeasts
from dental samples.J Clin Microbiol33, 3025–3027.
Borman, A. M., Linton, C. J., Miles, S. J. & Johnson, E. M. (2008).
Molecular identification of pathogenic fungi.J Antimicrob Chemother 61(Suppl. 1), i7–i12.
Campanha, N. H., Neppelenbroek, K. H., Spolidorio, D. M.,
Spolidorio, L. C. & Pavarina, A. C. (2005).Phenotypic methods and
commercial systems for the discrimination betweenC. albicansandC.
dubliniensis.Oral Dis11, 392–398.
Cannon, R. D., Holmes, A. R., Mason, A. B. & Monk, B. C. (1995).Oral
Candida: clearance, colonization, or candidiasis?J Dent Res74, 1152–
1161.
Carvalho, A., Costa-De-Oliveira, S., Martins, M. L., Pina-Vaz, C.,
Rodrigues, A. G., Ludovico, P. & Rodrigues, F. (2007). Multiplex
PCR identification of eight clinically relevantCandidaspecies.Med
Mycol45, 619–627.
Cocolin, L., Bisson, L. F. & Mills, D. A. (2000).Direct profiling of the
yeast dynamics in wine fermentations.FEMS Microbiol Lett189, 81–87.
Cocolin, L., Aggio, D., Manzano, M., Cantoni, C. & Comi, G. (2002).
An application of PCR-DGGE analysis to profile the yeast popula-tions in raw milk.Int Dairy J12, 407–411.
Coleman, D., Sullivan, D., Harrington, B., Haynes, K., Henman, M., Shanley, D., Bennett, D., Moran, G., McCreary, C. & O’Neill, L. (1997).
Molecular and phenotypic analysis ofCandida dubliniensis: a recently identified species linked with oral candidosis in HIV-infected and AIDS patients.Oral Dis3(Suppl. 1), S96–S101.
Dassanayake, R. S. & Samaranayake, L. P. (2003). Randomly
amplified polymorphic DNA fingerprinting: the basics.Methods Mol
Biol226, 117–122.
Devillard, E., Burton, J. P. & Reid, G. (2005).Complexity of vaginal
microflora as analyzed by PCR denaturing gradient gel electrophoresis in a patient with recurrent bacterial vaginosis. Infect Dis Obstet
Gynecol13, 25–30.
Ellepola, A. N. & Samaranayake, L. P. (2000). Oral candidal
infections and antimycotics.Crit Rev Oral Biol Med11, 172–198.
Ellepola, A. N., Hurst, S. F., Elie, C. M. & Morrison, C. J. (2003).Rapid
and unequivocal differentiation of Candida dubliniensis from other
Candidaspecies using species-specific DNA probes: comparison with
phenotypic identification methods.Oral Microbiol Immunol18, 379–388.
Ells, R., Kock, J. L. & Pohl, C. H. (2011).Candida albicansorCandida
dubliniensis?Mycoses54, 1–16.
Emmanouil-Nikoloussi, E., Kanellaki-Kyparissi, M., Papavassiliou, P., Koliakos, K., Dermentzopoulou, M. & Foroglou, C. (1994).
‘‘Hanseniaspora uvarum’’ the ultrastructural morphology of a rare
ascomycete, isolated from oral thrush. Bull Group Int Rech Sci
Stomatol Odontol37, 13–17.
Fricke, S., Fricke, C., Schimmelpfennig, C., Oelkrug, C.,
Scho¨nfelder, U., Blatz, R., Zilch, C., Faber, S., Hilger, N. & other
authors (2010). A real-time PCR assay for the differentiation of
Candidaspecies.J Appl Microbiol109, 1150–1158.
Giammanco, G. M., Melilli, D. & Pizzo, G. (2004).Candida pararugosa
isolation from the oral cavity of an Italian denture wearer. Res
Microbiol155, 571–574.
Gonc¸alves, R. H., Miranda, E. T., Zaia, J. E. & Giannini, M. J. (2006).
Species diversity of yeast in oral colonization of insulin-treated diabetes mellitus patients.Mycopathologia162, 83–89.
Hierro, N., Gonza´lez, A., Mas, A. & Guillamo´n, J. M. (2006).Diversity
and evolution of non-Saccharomycesyeast populations during wine fermentation: effect of grape ripeness and cold maceration. FEMS
Yeast Res6, 102–111.
Hospenthal, D. R., Beckius, M. L., Floyd, K. L., Horvath, L. L. &
Murray, C. K. (2006).Presumptive identification ofCandidaspecies
other than C. albicans, C. krusei, and C. tropicalis with the chromogenic medium CHROMagar Candida. Ann Clin Microbiol
Antimicrob5, 1.
Hsu, M.-C., Chen, K.-W., Lo, H.-J., Chen, Y.-C., Liao, M.-H., Lin, Y.-H. &
Li, S.-Y. (2003).Species identification of medically important fungi by
use of real-time LightCycler PCR.J Med Microbiol52, 1071–1076.
Khan, Z., Mustafa, A. S. & Alam, F. F. (2009).Real-time LightCycler
polymerase chain reaction and melting temperature analysis for identification of clinically important Candida spp. J Microbiol
Immunol Infect42, 290–295.
Klinke, T., Guggenheim, B., Klimm, W. & Thurnheer, T. (2011).
Dental caries in rats associated withCandida albicans.Caries Res45, 100–106.
Kowalchuk, G. A., Gerards, S. & Woldendorp, J. W. (1997).Detection
and characterization of fungal infections of Ammophila arenaria (marram grass) roots by denaturing gradient gel electrophoresis of specifically amplified 18S rDNA.Appl Environ Microbiol 63, 3858– 3865.
M. M. Weerasekera and others
Kuba, K. (2008).[Molecular and immunological methods applied in diagnosis of mycoses].Wiad Parazytol54, 187–197 (in Polish).
Kurtzman, C. P. & Robnett, C. J. (1998).Identification and phylogeny
of ascomycetous yeasts from analysis of nuclear large subunit (26S) ribosomal DNA partial sequences.Antonie van Leeuwenhoek73, 331–371.
Ledder, R. G., Gilbert, P., Pluen, A., Sreenivasan, P. K., De Vizio, W. &
McBain, A. J. (2006). Individual microflora beget unique oral
microcosms.J Appl Microbiol100, 1123–1131.
Li, Y., Saxena, D., Barnes, V. M., Trivedi, H. M., Ge, Y. & Xu, T. (2006).
Polymerase chain reaction-based denaturing gradient gel electro-phoresis in the evaluation of oral microbiota.Oral Microbiol Immunol 21, 333–339.
Li, S.-S., Cheng, C., Li, Z., Chen, J.-Y., Yan, B., Han, B.-Z. & Reeves, M.
(2010).Yeast species associated with wine grapes in China.Int J Food
Microbiol138, 85–90.
Linton, C. J., Borman, A. M., Cheung, G., Holmes, A. D., Szekely, A., Palmer, M. D., Bridge, P. D., Campbell, C. K. & Johnson, E. M. (2007).
Molecular identification of unusual pathogenic yeast isolates by large ribosomal subunit gene sequencing: 2 years of experience at the United Kingdom Mycology Reference Laboratory.J Clin Microbiol45, 1152–1158.
Lo´pez-Martı´nez, R. (2010). Candidosis, a new challenge. Clin
Dermatol28, 178–184.
Loreto, E. S., Scheid, L. A., Nogueira, C. W., Zeni, G., Santurio, J. M. &
Alves, S. H. (2010). Candida dubliniensis: epidemiology and
phenotypic methods for identification.Mycopathologia169, 431–443.
Madhavan, P., Jamal, F., Chong, P. P. & Ng, K. P. (2011).
Identification of local clinical Candida isolates using CHROMagar
CandidaTM as a primary identification method for variousCandida
species.Trop Biomed28, 269–274.
Marshall, M. N., Cocolin, L., Mills, D. A. & VanderGheynst, J. S.
(2003). Evaluation of PCR primers for denaturing gradient gel
electrophoresis analysis of fungal communities in compost. J Appl
Microbiol95, 934–948.
Martins, M., Henriques, M., Ribeiro, A. P., Fernandes, R., Gonc¸alves,
V., Seabra, A., Azeredo, J. & Oliveira, R. (2010).OralCandidacarriage
of patients attending a dental clinic in Braga, Portugal.Rev Iberoam
Micol27, 119–124.
Meroth, C. B., Hammes, W. P. & Hertel, C. (2003).Identification and
population dynamics of yeasts in sourdough fermentation processes by PCR-denaturing gradient gel electrophoresis. Appl Environ
Microbiol69, 7453–7461.
Moran, G. P., Coleman, D. C. & Sullivan, D. J. (2012). Candida
albicans versus Candida dubliniensis: why is C. albicans more
pathogenic?Int J Microbiol2012, 205921.
Moter, A. & Go¨bel, U. B. (2000).Fluorescence in situ hybridization
(FISH) for direct visualization of microorganisms. J Microbiol
Methods41, 85–112.
Muccilli, S., Caggia, C., Randazzo, C. L. & Restuccia, C. (2011).Yeast
dynamics during the fermentation of brined green olives treated in the field with kaolin and Bordeaux mixture to control the olive fruit
fly.Int J Food Microbiol148, 15–22.
Neppelenbroek, K. H., Campanha, N. H., Spolidorio, D. M.,
Spolidorio, L. C., Seo´, R. S. & Pavarina, A. C. (2006). Molecular
fingerprinting methods for the discrimination between C. albicans
andC. dubliniensis.Oral Dis12, 242–253.
Nielsen, D. S., Jacobsen, T., Jespersen, L., Koch, A. G. & Arneborg,
N. (2008). Occurrence and growth of yeasts in processed meat
products – implications for potential spoilage.Meat Sci80, 919–926.
Oros-Sichler, M., Gomes, N. C., Neuber, G. & Smalla, K. (2006).A
new semi-nested PCR protocol to amplify large 18S rRNA gene
fragments for PCR-DGGE analysis of soil fungal communities.
J Microbiol Methods65, 63–75.
Polz, M. F. & Cavanaugh, C. M. (1998).Bias in template-to-product
ratios in multitemplate PCR. Appl Environ Microbiol 64, 3724– 3730.
Pryce, T. M., Kay, I. D., Palladino, S. & Heath, C. H. (2003).Real-time
automated polymerase chain reaction (PCR) to detect Candida
albicansand Aspergillus fumigatusDNA in whole blood from
high-risk patients.Diagn Microbiol Infect Dis47, 487–496.
Rasiah, I. A., Wong, L., Anderson, S. A. & Sissons, C. H. (2005).
Variation in bacterial DGGE patterns from human saliva: over time, between individuals and in corresponding dental plaque microcosms.
Arch Oral Biol50, 779–787.
Romeo, O. & Criseo, G. (2011). Candida africana and its closest
relatives.Mycoses54, 475–486.
Samaranayake, L. (2009).Commensal oralCandidain Asian cohorts.
Int J Oral Sci1, 2–5.
San Milla´n, R. M., Wu, L. C., Salkin, I. F. & Lehmann, P. F. (1997).
Clinical isolates ofCandida guilliermondiiincludeCandida fermentati.
Int J Syst Bacteriol47, 385–393.
Sandhu, G. S., Kline, B. C., Stockman, L. & Roberts, G. D. (1995).
Molecular probes for diagnosis of fungal infections.J Clin Microbiol 33, 2913–2919.
Schmid, J., Voss, E. & Soll, D. R. (1990).Computer-assisted methods
for assessing strain relatedness inCandida albicansby fingerprinting with the moderately repetitive sequence Ca3. J Clin Microbiol 28, 1236–1243.
Schmid, J., Hunter, P. R., White, G. C., Nand, A. K. & Cannon, R. D.
(1995). Physiological traits associated with success of Candida
albicans strains as commensal colonizers and pathogens. J Clin
Microbiol33, 2920–2926.
Seiler, H. & Busse, M. (1990).The yeasts of cheese brines.Int J Food
Microbiol11, 289–303.
Sidrim, J. J., Costa, A. K., Cordeiro, R. A., Brilhante, R. S., Moura, F. E.,
Castelo-Branco, D. S., Neto, M. P. & Rocha, M. F. (2010).Molecular
methods for the diagnosis and characterization of Cryptococcus: a review.Can J Microbiol56, 445–458.
Smit, E., Leeflang, P., Glandorf, B., Van Elsas, J. D. & Wernars, K.
(1999). Analysis of fungal diversity in the wheat rhizosphere by
sequencing of cloned PCR-amplified genes encoding 18S rRNA and temperature gradient gel electrophoresis.Appl Environ Microbiol65, 2614–2621.
Soysa, N. S., Samaranayake, L. P. & Ellepola, A. N. (2006).Diabetes
mellitus as a contributory factor in oral candidosis.Diabet Med23, 455–459.
Trtkova, J. & Raclavsky, V. (2006).Molecular-genetic approaches to
identification and typing of pathogenicCandidayeasts.Biomed Pap
Med Fac Univ Palacky Olomouc Czech Repub150, 51–61.
Vainio, E. & Hantula, J. (2000). Direct analysis of wood-inhabiting
fungi using denaturing gradient gel electrophoresis of amplified ribosomal DNA.Mycol Res104, 927–936.
Van Elsas, J. D., Duarte, G. F., Keijzer-Wolters, A. & Smit, E. (2000).
Analysis of the dynamics of fungal communities in soil via fungal-specific PCR of soil DNA followed by denaturing gradient gel electrophoresis.J Microbiol Methods43, 133–151.
Vilela, D. M., Pereira, G. V., Silva, C. F., Batista, L. R. & Schwan, R. F.
(2010). Molecular ecology and polyphasic characterization of the
microbiota associated with semi-dry processed coffee (Coffea arabica
L.).Food Microbiol27, 1128–1135.
Walter, J., Tannock, G. W., Tilsala-Timisjarvi, A., Rodtong, S., Loach,
Downloaded from www.microbiologyresearch.org by IP: 36.72.116.125
of gastrointestinalLactobacillusspecies by using denaturing gradient gel electrophoresis and species-specific PCR primers.Appl Environ
Microbiol66, 297–303.
White, T. J., Bruns, T., Lee, S. & Taylor, J. W. (1990).Amplification and
direct sequencing of fungal ribosomal RNA genes for phylogenetics. In
PCR Protocols – a Guide to Methods and Applications, pp. 315–322.
Edited by M. Innis, D. H. Gelfand, J. J. Sninsky & T. J. White. San Diego, CA: Academic Press.
White, P. L., Williams, D. W., Kuriyama, T., Samad, S. A., Lewis, M. A.
& Barnes, R. A. (2004).Detection of Candida in concentrated oral
rinse cultures by real-time PCR.J Clin Microbiol42, 2101–2107.
Williams, D. & Lewis, M. (2011).Pathogenesis and treatment of oral
candidosis.J Oral Microbiol3, 1–11.
Willis, A. M., Coulter, W. A., Sullivan, D. J., Coleman, D. C., Hayes, J.
R., Bell, P. M. & Lamey, P. J. (2000).Isolation ofC. dubliniensisfrom
insulin-using diabetes mellitus patients.J Oral Pathol Med29, 86–90.
Yang, Y. L. (2003).Virulence factors ofCandidaspecies.J Microbiol
Immunol Infect36, 223–228.
Zijnge, V., Harmsen, H. J., Kleinfelder, J. W., Van der Rest, M. E.,
Degener, J. E. & Welling, G. W. (2003). Denaturing gradient gel
electrophoresis analysis to study bacterial community structure in pockets of periodontitis patients.Oral Microbiol Immunol18, 59–65. M. M. Weerasekera and others