Conference Proceedings
October, 2014
Osaka, Japan
AISEIT
Annual International Symposium on Educational
and Information Technology
ICBITM
International Conference on Business Innovation
and Technology Management
IACSS
AISEIT
Annual International Conference on Eudcational and Information Technology
ISBN 978-986-90827-8-5
ICBITM
International Conference on Business Innovation and Technology Management
ISBN 978-986-90827-5-4
IACSS
Content
Conference Schedule ... 6
Osaka International House Foundation﹝2F﹞ ... 9
Conference Venue Information ... 10
General Information for Participants ... 11
International Committee Board ... 13
Special Thanks to Session Chairs ... 14
Keynote Speech ... 15
Electrical Engineering &Technology ... 221
Marketing & Mgt ... 271
Communication & Info Technology ... 405
AISEIT-19... 407
Society & Culture II ... 477
IACSS-124 ... 478
Banking & Finance II ... 510
IACSS-153 ... 511
IACSS-206 ... 512
IACSS-209 ... 534
IACSS-247 ... 541
ICBITM-43 ... 542
Political & Law ... 543
IACSS-9 ... 544
IACSS-154 ... 545
IACSS-228 ... 559
IACSS-64 ... 560
Business & Management ... 567
IACSS-28 ... 568
IACSS-55 ... 569
IACSS-73 ... 587
IACSS-106 ... 598
ICBITM-18 ... 616
Education III ... 628
IACSS-111 ... 629
IACSS-186 ... 630
IACSS-227 ... 656
IACSS-292 ... 669
Psychology ... 675
IACSS-139 ... 677
IACSS-205 ... 685
IACSS-202 ... 686
IACSS-15 ... 687
IACSS-262 ... 688
IACSS-103 ... 700
IACSS-174 ... 711
Poster Sessions–October 16th ... 713
Fundamental and Applied Sciences /Applied Sciences / Education / Politics & Law / Society & Culture /Psychology Marketing / Business & Management... 713
ICBITM-22 ... 715
IACSS-130 ... 716
IACSS-120 ... 725
IACSS-89 ... 727
IACSS-213 ... 742
IACSS-107 ... 757
359
IACSS-232
Is Animal-Protein-Food Consumption Still Sensitive to Price Change?
Empirical Evidence from D.I. Yogyakarta Province, Indonesia
Mujtahidah Anggriani Ummul Muzayyanah
a*, Eko Priyotomo
ba
Faculty of Animal Science, Universitas Gadjah Mada, Indonesia.
b
Researcher on Agricultural Economics, Indonesia.
*Corresponding Author: [email protected]
ABSTRACT
Consumption of animal protein in Indonesia is dominated by livestock products food. Among
livestock products, beef, chicken and egg are the main animal-protein food in Indonesia. This
study examines the affecting of household`s factors in the consumption of beef, chicken, and
egg and the expenditure and quantity analysis of these foods. Household expenditure data in
urban and rural area of D.I Yogyakarta Province (here after DIY Province) are used in this
study with Engel's theory as basic method. The empirical results show that total expenditure,
as proxy of income, and regional factors have significant effect to expenditure and demand of
beef, chicken, and egg, while gender of household head was found to have no significant
impact on the expenditure and quantity of these foods, and as household-size increases, the
expenditure and quantity of chicken, and egg consumed increased. Urban household spend
less in chicken and egg, and spend more on beef relative to household in rural. Compare to
urban household, rural household was more elastic on beef and chicken consumption based
on income and quantity elasticity. Increasing income will be more effective way than
decreasing its price to achieve substantial improvements and enhance animal protein
consumption.
360
1. Introduction
Indonesian animal protein food consumption is dominated by livestock products such as meat,
egg and milk. Some reference noted that poultry meat, beef and egg are consumer
preferences of animal protein consumption (Bond et al, 2007; INSTATE, 2004). Chicken in
particular is the meat of choice. DGLS (2007) reported that during 2004-2006, chicken meat
is the highest consumption among meat product consumption of Indonesian people (about
3.81 kg/cap/year from 4.8 kg/cap/year of the total fresh meat consumption), and chicken egg
is also highest among egg products (about 90 percent from total egg product). It is indicate
that chicken and egg consumption is main source of animal protein source which have cheap
price and people keep consuming chicken meat and egg.
Livestock products, as high-value-food, in developing country like Indonesia have generally
higher responsiveness than do cereals. These foods are responsive to the change of price and
or income.
Sunarto (2000), for instance, presents animal protein consumption analysis in West Java,
Indonesia, that is change in prices of fish and egg effects to the food consumption since these
two items high price elasticity. Hutasuhut, et.al (2002) estimated meat consumption
parameters. Consumers more adapt their consumption pattern to chicken price changes than
they will for beef price changes.
Residential locations also appear to be an important determinant of livestock product food
consumption. Olivia and Gibson (2003) found that demand for beef is more elastic in price
than is the demand for chicken, except in urban Java. Opposite to the beef consumption
pattern, the demand for chicken in urban Java is more own-price elastic than it is in rural Java.
This could be due to many rural households in Java raising chicken for their own
consumption.
The objective of the study is divided into two folds; first, to examine the determinants of
household demand for main animal protein such as beef, chicken, and egg and second, to
estimate food expenditure and quantity elasticity of demand for beef, chicken, and egg.
2. Material and Methods
This research is using household expenditure data. Household Expenditure Survey
(SUSENAS) data were used in this study. The 2011 SUSENAS survey was conducted by
Central Bureau of Statistics (CBS) which is involved by sample households in Indonesia. In
this study, we used raw household data record from Household expenditure data in urban and
rural area of D.I Yogyakarta Province (here after DIY Province). The analyses of household
food consumption depend on economic and non- economic factor of the households.
361
chicken, and egg consumption. The expenditure and quantity approach in this study used
Deaton (1988) and Deaton (1997) such as
e
j=
f
(x
,z
) and
q
j=
f (x,z)
have always assume a
log-linear function.
The Engel relationship as
∑
…. (1)
∑
….. (2)
where
e
ijand
q
ijare respectively, expenditure on the
j-th
food items (
j-th food = beef, chicken
and egg
) and quantity of
j-th
food item purchased by the
i-th
household;
z
ikis a set of
household‘s
socio-economic variables which includes household size, age and gender of the
household head,
D
is dummy variable which capture location effect on
e
ijand
q
ij(
D
=1
denotes households in urban; 0 denotes households in rural);
θ
j,
β
j, and
τ
are parameters to
be estimated;
and
are disturbance term.
The adding up criterion of Almost Ideal Demand System (AIDS) model (Deaton and
Muellbauer, 1980), does not satisfy in equations 1 and 2. But in this case, this is not a serious
concern since we did not estimate a complete demand system.
Because of non-linear specification of equation 1, the expenditure - income elasticity of the
j-th
food item for the
i-th
household
θ
ijis calculated using the relationship below:
̅
……….. (3)
Also, the quantity-income elasticity of the
j-th
food item for the
i-th
household
η
ijis
calculated using the relationship below
̅
………. (4)
where (
log x
i)is the mean of the logarithm of income
x
ifor the households.
3. Result and Discussion
Expenditure and quantity equations estimated based on equations 1 and 2, respectively for the
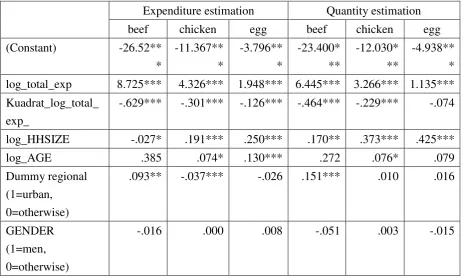
pooled estimate, is Presented in Table 1. The coefficient of log_total_exp are positive and
statistically significant for all the equations while (log_total_exp)2 are negative and
statistically significant for all equation. As earlier mentioned, inclusion of (log_total_exp)
2is
a test for non-linearity between the dependent variables and total expenditure. The significant
of the coefficient shows that non-linearity exist between the demand for beef, chicken and
egg and total expenditure in the study area.
362
that the older household head spend and demand more of egg in the study area. The variable
GENDER was found to have no significant impact on the expenditure and quantity across all
equations. The estimated coefficient of dummy region indicates that households in urban
spend less on chicken and egg relative to households in rural area. Households in urban spend
more on beef relative to households in rural.
Table 1: Estimated expenditure and quantity equations (pooled estimates)
Expenditure estimation
Quantity estimation
beef
chicken
egg
beef
chicken
egg
Note: ***, ** and * significant at 0.01, 0.05 and 0.1 level of significance respectively
The estimation result of expenditure and quantity demanded elasticity is presented in Table 2.
The result showed that rural household was more elastic on beef and chicken consumption
based on income and quantity elasticity than that of urban household. The magnitude of
income parameter was bigger than that of price for all food items.
Table 2. Point estimates of the expenditure and quantity elasticities.
363