The Influence of Liquidity, Leverage, Profitability and Activity
Against Growth of Profits at Property and Real Estate Companies
Listed on BEI
Maulina Ratna Dewi1, Siti Nurlaela2, Kartika Hendra Titisari3 123
Program Studi Akuntansi S1, Fakultas Ekonomi, Universitas Islam Batik Surakarta Jl. KH. Agus Salim No. 10, Surakarta 57147, Jawa Tengah, Indonesia
*E-mail : [email protected]
Abstract: This research aims to test the influence of liquidity, leverage, profitability, and activity against growth of profit at property and real estate companies listed on BEI.. The population of this research is all the property and real estate companies listed in BEI during 2014-2016. Based on the method purposive sampling, samples of this research as much as 34 property and real estate companies listed on BEI. Type of data used in this research is secondary data obtained from (www.idx.co.id). Methods of analysis used are multiple linear regression analysis. The results showed liquidity and leverage do not have influence to the profit growth, while profitability and activity have influence to the profit growth.
Keywords: liquidity, leverage, profitability, activity, profit growth
1. INTRODUCTION
The company’s success can be measured based on the financial performance of an enterprise in gain of profit. Profit growth can be analyzed by using financial ratios. Financial ratios is an activity comparing the figures that exist in the financial statements by means of dividing one number by another number. The rating agency issued a ranking of rating to the company that issued the bonds, usually basing the rating assessment based on financial ratio analysis. Financial ratios that are used in this research is the liquidity, leverage, profitability and activity.
Ratio of liquidity in this research is represented by the current ratio. Current ratio is the ratio to measure the company's ability to pay short-term liabilities in the top of the debt immediately due. The higher total assets current liabilities against smooth then the greater the company's ability in repaying debt. The research of Khaldun & Muda (2014), Rantika & Budiarti
(2016), and Wibisono & Triyonowati (2016) stated that the current ratio influence to the profit growth. So the H1 is liquidity influence on profit growth.
Leverage ratio in this study represented by debt to equity ratio. According Kasmir (2010) debt to equity ratio is the ratio that is used to assess the debt with equity. If the level of debt to equity ratio is low then the financial performance is getting better because of the higher level of debt repayment. Research Heikal, Khaddafi, & Ummah (2014), Rantika & Budiarti (2016), and Wibisono & Triyonowati (2016) stated that the debt to equity ratio influence to the profit growth. So H2 is leverage influence on profit growth.
(2016) and Suryono & Sulistyowati (2017) which states that net profit margin influence to the profit growth. So that the H3 is profitability influence on profit growth.
Activity ratio in this research is represented by the Total Asset Turnover. According Kasmir (2010) total asset turnover is used to measure the rotation of all assets owned by the company and measuring how the amount of sales generated from every rupiah assets. Research Gunawan & Wahyuni (2013) and Wibisono & Triyonowati (2016) states that the total asset turnover influence to the profit growth. So the H4 is activity influence on profit growth. This research aims to test and analyze the influence of liquidity, leverage, profitability and activity to the profit growth.
2. METHODOLOGY companies accessed through the Indonesia Stock Exchange official website i.e. www.idx.co.id. The dependent variable in this research is profit growth. The independent variable in this research is liquidity was measured using current ratio, leverage was measured using debt of equity ratio, profitability was measured using net profit margin and activity was measured using total asset turnover.
Population in this research is all property and real estate companies listed on BEI 2014-2016 period. Sampling in this study using the method of purposive sampling. The specified criteria in the selection of the sample of this research is 1) The property and real estate companies listed on BEI during
2014-2016, 2) The property and real estate companies who published financial statements that have been audited during years of research 2014-2016, 3) The property and real estate companies that generates net income during years of research 2014-2016. Methods of data analysis used in the study was descriptive statistics analysis method which aims to give an overview of data views of the value of the minimum, maximum, mean and standard deviation.
A classic assumption test among others the normality test aims to find out the distributed data is normal or not, using the kolmogorov smirnov test criteria if the value of significance > 0.05 data have been distributed to the normal and proper use in research.
Multicollinearity test is used to test whether the model regression correlation between independent variables occurs Ghozali (2005). Good regression model does not occur the correlation between independent variables. If the value of tolerence> 0.1 and VIF < 10 then not happen multicollinearity.
Autocorrelation test is used to test whether a linear regression model there is a correlation between error period t with period t-1 Ghozali (2005). One way to test autocorrelation is using run test. If the value of significance > 0.05 then no autocorrelation in regression models.
place, then it can be inferred that this not occurred heteroskedastisitas.
Multiple linear regression analysis is used to find out the relationship between the independent variables with dependent variable associated positive or negative and predicting independent variables whether increase or decrease. As for the multiple linear regression equation:
Y=α+b1liquidity+b2leverage+b3profitabi
lity+b4activity+e
Description:
Y = Growth of Profit
α = Constant
Liquidity = CR Leverage = DER
Profitability = NPM Activity = TATO
e = Error
Test the feasibility of the model used to determine whether the regression models in decent to use. t-test was used to t-test the influence of one independent variable individually to explained dependent variable Ghozali (2005).
3. RESULTS AND DISCUSSION
This research used the spss statistics 17.0 applications. Based on the method of purposive sampling, the samples used in the study was 34 property and real estate companies listed on BEI 2014-2016 period.
3.1 The Results of Descriptive Statistic
Descriptive statistics analysis method which aims to give an overview of data views of the value of the minimum, maximum, mean and standard deviation.
Table 1 The Results of Descriptive Statistical
N Minimum Maximum Mean Std. Deviation
Liquidity 99 .56 9.39 2.4388 1.75310
Leverage 99 .06 1.83 .7161 .44929
Profitability 99 .02 15.09 .5006 1.60257
Activity 99 .01 .42 .2198 .08903
Profit Growth 99 -.93 3.00 .0854 .68307
Liquidity variable (Current Ratio) has a minimum value 0,56 and a maximum value 9.39 value with mean value 2,4388 and standard deviation 1.75310. leverage variable (Debt to Equity Ratio) has a minimum value 0,06 and a maximum value 1.83 with mean value 0,7161 and standard deviation 0.44929. The Profitability variable (Net Profit Margin) has a minimum value 0,02 and a maximum value 15.09 with mean value 0,5006 and standard deviation 1.60257. Activity variable (Total Asset Turnover) have a minimum value 0.01 and the maximum value is 0,42 with mean value of 0.2198 and standard deviation 0.08903. The
profit growth variable has a minimum value -0,93 and a maximum value of 3.00 with mean value 0,0854 and standard deviation 0.68307.
3.2 The Results of A Classic Assumption Test
3.2.1 Normality Test
Table 2 Normality Test
Variable Sig Std. Description
Unstandardized Residual 0,184 > 0,05 Data is distributed normally
Based on the results of a normality test in table 2 using the Kolmogorov Smirnov test showed that the unstandardized residual
variables have the value of sig. 0.184 > 0.05 then it can be inferred that the data is distributed normally.
3.2.2 Multicollinearity Test
Table 3 Multicollinearity Test
Variable Tolerance Std VIF Std Description Liquidity 0,856 >0,10 1,168 <10 No
multicollinearity Leverage 0,779 >0,10 1,283 <10 No
multicollinearity Profitability 0,927 >0,10 1,079 <10 No
multicollinearity Activity 0,877 >0,10 1,141 <10 No
multicollinearity Based on table 3 above shows
that all free variables have the value of tolerance is > 0,10 and the value of Variance Inflation Factor (VIF) is < 10. Based on the basis of analysis are used, it can be
concluded that the data in this study no multicollinearity.
3.2.3 Autocorrelation Test
One way to test autocorrelation is using run test.
Table 4 Autocorrelation Test
Variable Sig Std Description
Unstandardized Residual
0,189 > 0,05 No
Autocorrelation Based on autocorrelation test
results in table 4 above, it can be conclude that the unstandardized residual variable does not occur symptom autocorrelation because unstandardized residual variable has a value sig > 0.05 (0.189 > 0.05)
3.2.4 Heteroskedastisitas Test
According Ghozali (2005) heteroskedastisitas test is used to test whether the model regression residual variance inequality occurs from one observation to another observation. One of the ways used to test heteroskedastisitas is using scatterplot graphs.
3.3 The Results of Multiple Regression Linear Test
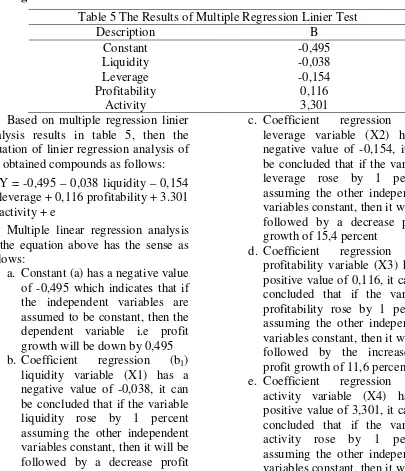
Table 5 The Results of Multiple Regression Linier Test
Description B
Constant -0,495
Liquidity -0,038
Leverage -0,154
Profitability 0,116
Activity 3,301
Based on multiple regression linier analysis results in table 5, then the equation of linier regression analysis of the obtained compounds as follows:
Y = -0,495 – 0,038 liquidity – 0,154 leverage + 0,116 profitability + 3.301 activity + e
Multiple linear regression analysis of the equation above has the sense as follows:
a. Constant (a) has a negative value of -0,495 which indicates that if the independent variables are assumed to be constant, then the dependent variable i.e profit growth will be down by 0,495 b. Coefficient regression (b1)
liquidity variable (X1) has a negative value of -0,038, it can be concluded that if the variable liquidity rose by 1 percent assuming the other independent variables constant, then it will be followed by a decrease profit growth of 3,8 percent
c. Coefficient regression (b2)
leverage variable (X2) has a negative value of -0,154, it can be concluded that if the variable leverage rose by 1 percent assuming the other independent variables constant, then it will be followed by a decrease profit growth of 15,4 percent
d. Coefficient regression (b3)
profitability variable (X3) has a positive value of 0,116, it can be concluded that if the variable profitability rose by 1 percent assuming the other independent variables constant, then it will be followed by the increase in profit growth of 11,6 percent e. Coefficient regression (b4)
activity variable (X4) has a positive value of 3,301, it can be concluded that if the variable activity rose by 1 percent assuming the other independent variables constant, then it will be followed by the increase in profit growth 330,1 percent.
3.4 The Results of Model Feasibility Test (F Test)
Table 6 The Results of F Test
Model Fcount Ftable Sig P Description
1 6,043 2,47 0,000 < 0,05 The model is feasible Based on the results test in table 6
above, obtained Fcount value is 6,043
with significance of 0,000. Because
Fcount > Ftable (6,043> 2,47) then H0
rejected and Ha are accepted. With the
0,000<0,05, then can be inferred that the model in this research is feasible.
3.5 The Results of t Test
Table 7 The Results of t Test
Variable Tcount ttable Sig Std Description
Liquidity -0,984 1,985 0,328 0,05 H1 rejected Leverage -0,972 1,985 0,333 0,05 H2 rejected Profitability 2,842 1,985 0,006 0,05 H3 accepted
Activity 4,379 1,985 0,000 0,05 H4 accepted
The First Hypotesis (H1) : The influence of Liquidity (Current Ratio) Against Profit Growth
First hypotesis (H1) liquidity variable representated by current ratio obtained tcountvalue is -0,984 assuming
tcount smaller than ttable (-0,984 < 1,985)
and value of significance is 0,328 assuming the value of significance greater than 0,05 (0,328 > 0,05). So the first hypotesis (H1) in this research rejected assuming H0 accepted H1
rejected or in the other words liquidity variable not influence to the profit growth. The results of this research are supported with research conducted by Gunawan & Wahyuni (2013), Khaldun & Muda (2014), Andriyani (2015), Yanti (2017) and Djannah & Triyonowati (2017) stating that the current ratio does not influence to the profit growth, but not supported with research conducted by Rantika & Budiarti (2016) stating that the current ratio have influence on profit growth.
The larger value of current ratio generated will lower the company’s profit growth. This is because the company spent to meet the liabilities which must be repaid soon, so that will have an impact on the decline of the acquired company’s profit growth. Companies that have a low current ratio more capable of generating better profit compared wit companies that have a high current ratio. Companies that have a high current ratio indicates a high
profit anyway. That means the company has short-term liabilities that exceeded current assets, so the company will have difficulty in paying off short-term liabilities.
The Second Hypotesis (H2) : The Influence of Leverage (Debt to Equity Ratio) Against Profit Growth
Second hypotesis (H2) leverage variable representated by debt to equity ratio obtained tcount value is -0,972
assuming tcount smaller than ttable (-0,972
< 1,985) and value of significance is 0,333 assuming the value of significance greater than 0,05 (0,333 > 0,05). So the second hypotesis (H2) in this research rejected assuming H0
accepted H2 rejected or in the other
words leverage variable not influence to the profit growth. The results of this research are supported with research conducted by Gunawan & Wahyuni (2013), Yanti (2017) and Djannah & Triyonowati (2017) stating that the debt to equity ratio not influence to the profit growth, but not supported with research conducted by Wibisono & Triyonowati (2016) stating that the debt to equity ratio have influence to the profit growth.
equity owned. The higher debt levels will result in the amount of interest expenses is getting big so the lower the debt rate of return which would be no good to corporate profit growth.
The Third Hypotesis (H3) : The Influence of Profitability (Net Profit Margin) Against Profit Growth
Third hypotesis (H3) profitability variable representated by net profit margin obtained tcount value is 2,842
assuming tcount greater that ttable (2,842 >
1,985) and value of significance is 0,006 assuming the value of significance smaller than 0,05 (0,006 < 0,05). So the third hypotesis (H3) in this research accepted assuming H0 rejected
H3 accepted or in the other words
profitability have influence to the profit growth. The results are supported with research conducted by Heikal, Khaddafi, & Ummah (2014), Wibisono & Triyonowati (2016) and Suryono & Sulistyowati (2017) stating that net profit margin have influence to the profit growth, but not supported with research conducted by Yanti (2017) stating that the net profit margin does not influence to the profit growth. The higher value of net profit margin means the greater net profits obtained through the company’s net sales. The magnitude of the net profit margin earned will
attract investors to infuse capital to boost corporate profit growth.
The Fourth Hypotesis (H4) : The Influence of Activity (Total Assets Turnover) Against Profit Growth
Fourth hypotesis (H4) activity variable representated by total assets turnover obtained tcount value is 4,379 this research accepted assuming H0
rejected H4 accepted or in the other
words activity have influence to the profit growth. The results are supported with research conducted by Wibisono & Triyonowati (2016), Suryono & Sulistyowati (2017) stating that total asset turnover have influence to the profit growth, but not supported with research conducted by Andriyani (2015) stating that the total assets turnover does not influence to the profit growth. The larger value of this ratio then assets can spin faster, indicating a high number of sales so that the cpmpany can achieve profit and increase the company’s profit growth.
3.6 The Results of Coefficient Determination (R2) Test
Table 7 The Results of Coefficient Determination (R2) Test
Model Adjusted r Square Description
1 0,171 The independent variables can
explain the dependent variable Based on the results test of
coefficient determination in table 7 above, the independent variables in this research is liquidity, leverage, profitability, and activity can explain dependent variable i,e profit growth of 17,1%. It is visible from the Adjusted R Square value of 0,171. While the dependent variable 82,9% profit growth
is affected by other variables that are not used in this research.
4. CONCLUSIONS AND
SUGGESTIONS
companies listed in BEI 2014-2016 period. Type of this research is quantitative research. Method of this research using a purposive sampling method, so that the obtained samples as much as 34 property and real estate companies listed on BEI. Based on the results of the testing show that the liquidity and leverage variable have no effect against profit growth, while the variable profitability and activity have effect against profit growth.
Suggestions for further research are 1) expected to enlarge the sample research, \, 2) expected to increase the period of obervation is more than 3 years and adding independent variables in research that can explain the growth of profit.
5. BIBLIOGRAPHY
Andriyani, I. (2015). Pengaruh Rasio Keuangan Terhadap Pertumbuhan
Laba Pada Perusahaan
Pertambangan Yang Terdaftar di Bursa Efek Indonesia. Jurnal Manajemen dan Bisnis Sriwijaya Vo. 13, No.3 .
Djannah, R., & Triyonowati. (2017). Pengaruh Kinerja Keuangan Terhadap Pertumbuhan Laba Pada Perusahaan Food and Beverages. Jurnal Ilmu dan Riset Manajemen Vol. 6 No. 7 .
Ghozali, I. (2005). Aplikasi Analisis Multivariate dengan Program SPSS, Edisi Ketiga, Cetakan Kedua. Semarang: Badan Penerbit Universitas Diponegoro.
Gunawan, A., & Wahyuni, S. F. (2013). Pengaruh Rasio Keuangan Terhadap Pertumbuhan Laba Pada Perusahaan Perdagangan di Indonesia. Jurnal Manajemen & Bisnis Vol 13 No. 01 .
Heikal, M., Khaddafi, M., & Ummah, A. (2014). Influence Analysis of Return On Asset (R0A), Return On Equity (ROE), Net Profit Margin (NPM), Debt to Equity Ratio (DER), and Current Ratio (CR) Against Corporate Profit Growth in Automotive In Indonesia Stock Exchange. International Journal of Academic Research in Business and Social Sciences, Vol.4, No.12 .
Kasmir. (2010). Pengantar Manajemen Keuangan. Jakarta: Kencana Prenada Media Group.
Khaldun, K. I., & Muda, I. (2014). The Influence Of Profitability and Liquidity Ratios On The Growth Of Profit Of Manufacturing Companies (A Study Of Food and Beverages --Sector Companies Listed On Indonesia Stock Exchange Period 2010-2012). International Journal of Economics, Commerce and Management Vol II, Issue 12 .
Rantika, D. R., & Budiarti, A. (2016). Pengaruh Rasio Keuangan Terhadap Pertumbuhan Laba Pada Perusahaan Pertambangan Logam di BEI. Jurnal Ilmu dan Riset Managemen: Vol.5, No.6.
Suryono, B., & Sulistyowati. (2017). Analisis TATO, NPM, Dan ROA Terhadap Pertumbuhan Laba pada Perusahaan Food & Beverage. Jurnal Ilmu dan Riset Akuntansi Vol. 6, No.4 .
Wibisono, S. A., & Triyonowati. (2016). Pengaruh Kinerja Keuangan Terhadap Pertumbuhan Laba Pada Perusahaan Otomotif di BEI. Jurnal Ilmu dan Riset Manajemen: Vol.5, No.12 .
Rasio Profitabilitas, dan Rasio Solvabilitas Terhadap Peringkat Sukuk. Jurnal Akuntansi dan Pajak, Vol. 18, No, 01 .
www.idx.co.id. (2014-2016). Dipetik September 25, 2017, dari BursaEfekIndonesia:http://www.idx .co.id