CORRECTION AND DENSIFICATION OF UAS-BASED PHOTOGRAMMETRIC
THERMAL POINT CLOUD
O. Akcay a,*, R. C. Erenoglu a, O. Erenoglu b
a Dept. of Geomatics Eng., Canakkale Onsekiz Mart University, 17100 Canakkale, Turkey - (akcay, ceren)@comu.edu.tr b Dept. of Geology En., Canakkale Onsekiz Mart University, 17100 Canakkale, Turkey - [email protected]
Commission III, WG III/2
KEY WORDS: Thermal camera, Photogrammetry, Geothermal, SLR Camera, Point Cloud, Unmanned Aerial System (UAS)
ABSTRACT:
Photogrammetric processing algorithms can suffer problems due to either the initial image quality (noise, low radiometric quality, shadows and so on) or to certain surface materials (shiny or textureless objects). This can result in noisy point clouds and/or difficulties in feature extraction. Specifically, dense point clouds which are generated with photogrammetric method using a lightweight thermal camera, are more noisy and sparse than the point clouds of high-resolution digital camera images. In this paper, new method which produces more reliable and dense thermal point cloud using the sparse thermal point cloud and high resolution digital point cloud was considered. Both thermal and digital images were obtained with UAS (Unmanned Aerial System) based lightweight Optris PI 450 and Canon EOS 605D camera images. Thermal and digital point clouds, and orthophotos were produced using photogrammetric methods. Problematic thermal point cloud was transformed to a high density thermal point cloud using image processing methods such as rasterizing, registering, interpolation and filling. The results showed that the obtained thermal point cloud - up to chosen processing parameters - was 87% more densify than the original point cloud. The second improvement was gained at the height accuracy of the thermal point cloud. New densified point cloud has more consistent elevation model while the original thermal point cloud shows serious deviations from the expected surface model.
1. INTRODUCTION
Recent photogrammetric applications which use Unmanned Aerial Systems (UAS) equipped with special sensors such as lightweight thermal and multi-spectral cameras provide three dimensional models in non-visible electromagnetic spectrum besides traditional examples of high-resolution SLR digital cameras. Particularly, low-cost and open-source photogrammetric softwares are able to extract 3D measurements and models from images taken with an ordinary digital camera. Corresponding image coordinates are measured automatically using detection and matching algorithms of 2D features (Lowe, 2004; Bay et al., 2008). Besides automatic image coordinate measurements, robust non-linear minimization of the measurement (re-projection) errors, also commonly known as bundle adjustment is the most accurate way to recover structure and motion (Szeliski, 2010). Structure from Motion reconstruction methods are used to derive orientations and sparse surface information. Later on, in order to retrieve complete surfaces with high precision, dense image matching methods solutions which are based on multi-view stereo algorithms are applied (Rothermel et al., 2012; Wenzel et al., 2013). Subsequently, the multi-view stereo solutions are implemented to derive dense point clouds.
Photogrammetric processing algorithms can suffer problems due to either the initial image quality (noise, low radiometric quality, shadows and so on) or to certain surface materials (shiny or textureless objects). This can result in noisy point clouds and/or difficulties in feature extraction (Remondino et al. 2014). Specifically, dense point clouds which are generated with photogrammetric method using a lightweight thermal camera, are more noisy and sparse than the point clouds of high-resolution digital camera images.
The aim of this research is to introduce a novel reliable geometric method to correct and densify noisy and sparse thermal point cloud generated UAS-based photogrammetry. In order to correct and enrich sparse thermal point cloud, a high resolution point cloud which was used derived using SLR digital camera imagery. Consequently a data fusion was implemented to improve thermal point cloud.
2. STUDY AREA
The processing approach was developed and tested in the area located next to Tuzla village, Canakkale province on the coast northeast of Aegean, Turkey. Tuzla is an active geothermal area hosted by rhyolite lavas and pyroclastic deposits. Temperatures up to 145°C were observed at 50 m depth in some of these wells, and due to vigorous boiling, some were lost in blow-outs (Baba, 2003). Hydrothermal alteration mineral assemblages indicate that geothermal fluids, with temperatures of 150-220°C have been present (Sener and Gevrek, 2000).
Figure 1 shows a general view of the Tuzla geothermal site. In figure 1, the digital image was taken by the 18 megapixel digital camera Canon EOS 650D. On the other hand, figure 2 depicts the same place represented in figure 1 was taken by the infrared camera Optris PI 450. In the thermal image, thermal water sources can be noticed easily while digital image does not show any sign of thermal water source. Optris PI 450 is capable of each pixel size of the Canon digital camera is 4.3µm x 4.3µm. The International Archives of the Photogrammetry, Remote Sensing and Spatial Information Sciences, Volume XLI-B3, 2016
XXIII ISPRS Congress, 12–19 July 2016, Prague, Czech Republic
This contribution has been peer-reviewed.
Figure 1. General view of the geothermal site
Figure 2. General thermal view of the geothermal site
3. PHOTOGRAMMETRIC PROCESS
Photogrammetry which is computed using the bundle adjustment establishes the relationship between the image and the object using projective geometry (Kyle, 2013). A thermal water source which is located in Tuzla geothermal site was modelled using photogrammetry. In this section, photogrammetric results of the digital and thermal imagery which were obtained using the Canon EOS 650D and Optris PI 450 cameras will be explained. Table 1 displays details of bundle block adjustments for both thermal and digital projects.
Project details Thermal Digital
Camera Optris PI 450 Canon 650D
Image no 43 24
Average keypoint per img. 2815 55201 Average match point per img. 885 28439
2D Observations 36734 685296
3D Points 13019 266958
Mean Reprojection Err. (pix.) 0.245330 0.112435
Table 1. Summary of photogrammetric projects
Although number of the thermal image is more than digital image, due to the low resolution, number of thermal 3D points are less than digital 3D points as a result of photogrammetric process as shown in table 1. Reprojection error of the thermal projection is approximately two times worse than the digital project. Many gross errors can be determined on 3D thermal point cloud, when thermal point cloud is inspected visually (figure 3). In the next section, sparse 3D thermal point cloud having gross errors will be corrected and improved using 3D digital thermal point cloud.
Figure 3. Side view of the thermal point cloud
In figure 3, black ellipses indicate completely abnormal deviations from the expected surface.
4. DENSIFICATION AND CORRECTION
In order to densify and correct thermal point cloud, some image processing steps were applied to the point clouds and orthophotos. Process steps include point-to-raster conversion, Laplacian of Gaussian (LoG) filter, spatial image registration based on non-reflective similarity, and point cloud densification.
4.1 Point to Raster Conversion
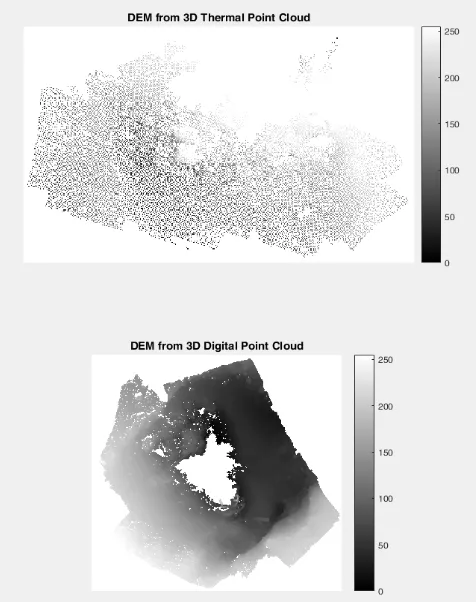
First obtained point clouds were transformed to the images which represent digital elevation models (DEM) of the geothermal surface. The conversion was implemented using height values of the points as the representative of the third dimension. Thermal DEM and digital DEM pixel sizes are defined as 0.02 and 0.6 respectively. The mean of the height values of all the points within a cell was computed as the final value of that cell. Each DEM was represented as gray-scale images as shown in figure 4.
Figure 4. DEMs obtained from the thermal and digital point clouds
The International Archives of the Photogrammetry, Remote Sensing and Spatial Information Sciences, Volume XLI-B3, 2016 XXIII ISPRS Congress, 12–19 July 2016, Prague, Czech Republic
This contribution has been peer-reviewed.
4.2 Laplacian of Gaussian (LoG) Filter
Thermal DEM and Digital DEM will be corrected using orthophotos. However thermal and digital orthophotos must be georeferenced before correction and densification. Considerable amount of differences might be seen between a thermal orthophoto and a digital orthophoto, despite they represent the same scene. Therefore gray-scale DEM images are not appropriate for manual or automatic feature detection and matching as the point clouds are the products of different kinds of sensors. An accurate key point detection is important in order to provide a point cloud densification procedure.
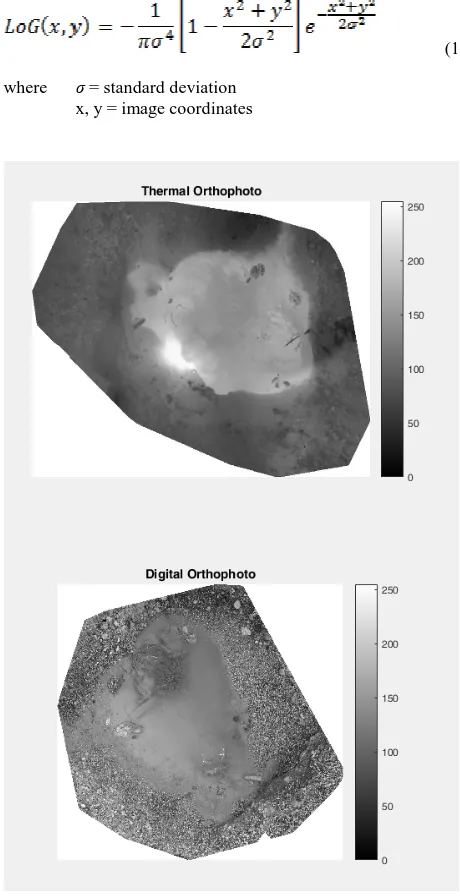
Appropriate image filters might be considered so as to increase similarity ratio between the images. Laplacian of Gaussian (LoG) filter was implemented to obtain filtered orthophotos. Laplacian filters are derivative filters used to find edges in images. Since derivative filters are very sensitive to noise, it is common to smooth the image before applying the Laplacian. This two-step process is called the LoG operation (Equation 1).
(1)
where σ = standard deviation x, y = image coordinates
Figure 5. Gray-scale thermal and digital orthophotos
Image features became more recognizable after LoG operation was implemented as seen in figure 6. In figure 6, image a and image b represent the same object feature, while image c and image d are shown the similarity for another object feature.
Figure 6. Different views of the same features
4.3 Non-reflective similarity
In this step, spatial transformations were implemented in the context of image registration. The transformation were considered between thermal and digital orthophotos. Later on, Orthophotos and DEMs were registered using non-reflective similarity. Non-reflective similarity transformations can include a rotation, a scaling and a translation. Shapes and angles are preserved. Parallel lines remain parallel. Straight lines remain straight. Totally four gray scale images which includes digital orthophoto, digital DEM, thermal orthophoto and thermal DEM were geometrically referenced.
4.4 Point Cloud Densification
Cell-based comparison between the thermal and digital DEMs shows that gross errors occur on thermal DEM if the digital DEM is accepted as the absolute correct model. Figure 7 depicts differences among thermal and digital DEMs in an intensity profile of the DEMs.
0 50 100 150
1 7 13 19 25 31 37 43 49 55 61 67 73 79 85 91 97 Comparison of DEM s
Digital Thermal
Figure 7. Different views of the same features
a b
c d
The International Archives of the Photogrammetry, Remote Sensing and Spatial Information Sciences, Volume XLI-B3, 2016 XXIII ISPRS Congress, 12–19 July 2016, Prague, Czech Republic
This contribution has been peer-reviewed.
As seen in figure 7, thermal DEM obtained by thermal point cloud has deviations from digital DEM. Height values of thermal DEM were replaced by digital DEM values in a determined deviation. Null cells of the thermal DEM filled with digital DEM values. Thermal point cloud recreated from the thermal DEM after the thermal DEM was corrected and densified. Consequently, z values of the thermal DEM were densified using digital DEM. Besides, colour values of the point cloud which indicate surface temperature were densified by thermal orthophoto. The results showed that the obtained thermal point cloud - up to chosen processing parameters - was 87% more densify than the original point cloud.
5. CONCLUSION
The results of the proposed methodology demonstrate that photogrammetric point cloud of any low resolution sensor can be transformed to more satisfying output if the user has a high resolution point cloud as a reference dataset. Lightweight thermal camera does not produce detailed topographic features alone although photogrammetric mean reprojection error is not so high. The higher resolution in thermal imagery will be contribute photogrammetric results.
During the spatial referencing of the images, key points were detected manually. Actually the aim of the image filtering is to provide images which enable SURF key point detection and matching for full automatic procedure. In the future, the studies should be carried on to solve automatic matching problem of images which is obtained from different sensors.
ACKNOWLEDGEMENTS
This study was supported by The Scientific and Technological Research Council of Turkey (TUBITAK) (Project no: 114Y005)
REFERENCES
Baba, A. 2003. Geothermal environmental impact assessment with special reference to the Tuzla, geothermal area, Canakkale, Turkey, Geothermal Training Programme Reports, Reykjavík, Iceland.
Bay, H., Ess, A., Tuytelaars, T. and Van Gool. L., 2008. Speeded-up robust features (surf). Computer Vision and Image Understanding, 110 (3) pp. 346–359.
Kyle, S., 2013 Close-Range Photogrammetry and 3D Imaging; Walter de Gruyter: Berlin, Gemany.
Lowe, D.G., 2004. Distinctive image features from scale-invariant keypoints. International Journal of Computer Vision, 60(2), pp. 91–110.
Remondino, F., Spera, M.G., Nocerino, E., Menna, F. and Nex, F., 2014. State of the art in high density image matching. Photogrammetric Record, 29, pp. 144–166.
Rothermel, M., Wenzel, K., Fritsch, D., Haala, N. (2012). SURE: Photogrammetric Surface Reconstruction from Imagery. Proceedings LC3D Workshop, Berlin , December 2012.
Sener, M. and Gevrek, A.I., 2000. Distribution and significance of hydrothermal alteration minerals in the Tuzla hydrothermal
system, Canakkale, Turkey. J. Volc. & Geotherm. Res., 96, 215-228.
Szeliski, R., 2010. Computer vision: Algorithms and applications. Springer, New York.
Wenzel, K., Rothermel, M., Fritsch, D., Haala N., 2013. Image acquisition and model selection for multi-view stereo. ISPRS, Volume XL-5/W1, 3D-ARCH 2013, 25–26 Feb., Trento, Italy 251-258.
The International Archives of the Photogrammetry, Remote Sensing and Spatial Information Sciences, Volume XLI-B3, 2016 XXIII ISPRS Congress, 12–19 July 2016, Prague, Czech Republic
This contribution has been peer-reviewed.