7
MISH IBA Junichi, MASUDA Misa, & Maheshwar DH AKAL
1. Introduction
There are strong correlations between the locations of high-poverty areas and forests in India. Population
and poverty are the main two causes of destructive pressure on forests (Ahmed, 1997). Almost one fifth of
the Indian population is considered to be partially or wholly dependent on forest resources for its livelihoods.
The people living in and around the forests are consuming the forest products in terms of firewood, fodder
and timber to fulfill their basic needs of livelihood. Nevertheless, Indian forest cover was almost stable
from 63.93 million ha (19.5% to the total land area) in 1991 to 63.73 million ha (19.4%) in 1999 (Forest
Survey of India, 2001), and according to Global Forest Resources Assessment 2000 by FAO, it slightly
increased compared to 1990 (FAO, 2001).
In the past, most of the forest policies of India had been guided by the principle of meeting industrial and
commercial demands for producing and maximizing revenue while ignoring local needs (Sarin, 1996).
Though most of the recorded forests were national forests, each state government had the say in forest
management and collected the revenue. However, the 42nd amendment of the constitution in 1976 changed
the forest and wildlife issues from the state matters to one of the concurrent matters between the Union and
the states (Nagamine, 2002). The latest Forest Policy issued in 1988 admitted that excluding local
communities in forest management, use of forest lands for non forestry purposes without ensuring
compensatory treatments, and the tendency to look forests as revenue earning resources were the major
reasons contributing to the failure of the forest management practices in the past. This second Forest Policy
proclaimed after the independence is called the New Forest Policy, and it strongly emphasized the necessity
to meet the requirements of 350 million people living in and around the forests (Bahuguna, 2002). As one
of the measures, Joint Forest Management (JFM) has become imperative to change the conventional
approach to environmental stability and welfare of local communities (Pari, 1998).
JFM was formally circulated to all state governments and union territories in 1990 as a resolution of the
central government, and sixteen state governments have immediately issued their acceptance of the JFM
resolution (Sarin, 1996). As it was expected, positive results also found after implementation of JFM
programs because people have a stake in the outputs (Hill et al, 1998). After a decade of field experiences
issued for further betterment of forests and in order to institutionalize local communities in the forest
management activities. The JFM Cell and the JFM Unit were created under the Ministry of Environment
and Forests (MoEF) at national level to monitor and coordinate the JFM activities respectively.
The area covered by JFM has increased favorably, reaching 10,250,000 ha in 2000, 14,095,360 ha in 2002
(Damodaran, 2003), and 17,331,955 ha in 2003 (MoEF, 2004). The JFM area in 2003 accounted for 22.6 %
of the total recorded forests in 2001 (Forest Survey of India, 2001), but at the state level there was a large
difference in the progress. While the forest area managed under JFM accounted for 57.8 % of the total
recorded forests in Madhya Pradesh, 50.9 % in West Bengal, and 48.0 % in Chhattisgarth, there were five
states with less than 5 % and Meghalaya had not yet adapted JFM in 2003.
2. Objectives and Methods
In contrast to Southeast Asia where community based forest management (CBFM) programs are still under
trial and error, the already matured experiences of JFM in India allow the studies aiming at generalization of
the mechanisms of JFM implementation, and the difference in implementation of JFM among the states
seems to have challenged the researchers. Kumar and Kant (2005) included JFM into a category of CBFM,
and tried to find the limiting factors for CBFM in the performance of forest agencies. Based on the analysis
of the questionnaires distributed to foresters of four selected states in India, they concluded that there was a
negative correlation between organizational bureaucracy and acceptability of CBFM systems.
On the other hand, Misra and Kant (2004) studied the economic, social, and biological output of JFM using
explanatory variables, such as heterogeneity and dependency of the user groups, gender issues, and village
leaderships for their case study in Gujarat state. In the discussion, they admitted a limitation in
generalization of the results to apply to the regions with different conditions, so far as taking the so-called
non-conventional factors into consideration.
These two discussions suggest the necessity of studies at different levels. In the case of India, whether JFM
is introduced or not is primarily determined by the political decision at the state government level, though the
achievement is shown in the local-level indicators, such as the area and the number of participants. The
study of Kumar and Kant (2005) focused on the interactive relation between the Indian Forest Service (IFS)
of MoEF and the forest departments of the state governments, which are relatively homogeneous
organizations controlled by IFS. The focal point of the latter is the performance of JFM at the local level,
and they found the difficulty to make economic output and social output compatible.
Our concern derived from the situation in Southeast Asia is rather on the process of the initial stage after the
reason we selected Kerala is its humid climate similar to Southeast Asia and its relatively late start of JFM in
1998 with a synonym of Participatory Forestry Management (PFM). Hereafter the term of JFM is applied
to the national level discussions and PFM is used under the context of Kerala. To find the factors that have
supported the penetration of PFM, first we focused on how the guidelines of the central government were
modified at the state level to meet a locality of diverse conditions, and duly interviewed the key informants of
Kerala Forest and Wildlife Department (KFD). Next, we selected a practice of PFM in Randukai due to the
longer period of implementation compared to others. From the list of participants, 45 households were
randomly extracted, whose details are described subsequently. Interviews to these respondents were carried
out by structured questionnaires prepared in English and interpreted to Malayalam, the official language of
Kerala state. As the focal point of the local-level interviews was to find the difference in responses derived
from socio-economic heterogeneousness, we applied structural analysis and compared the difference of
dependency on forest resources and motivations. The primary data collection was carried out by Mishiba
from September to November 2002 and a supplemental visit was made by Dhakal in February 2004.
Arrangement of the study and data analysis was conducted by Masuda.
3. General Settings of Kerala State
N
Kerala is a long, narrow state with a great north-south length up to 580 km. It can be divided to three
topographical features: lowland along the long stretch of
coastal line, adjoining upland, and the Western Ghat
Mountains that form the natural boundary with Tamil Nadu
and Karnataka state. Randukai is located on the hilly upland
in the middle part of the state (Figure7.1).
The average annual rainfall from 1984 to 1993 is 2181 mm
(Kerala State Land Use Board, 1995). It reaches nearly
5000 mm along the coast and western border of the
Wayaland Plateau, but gradually declines toward the inland,
around 1500 mm or even less (French Institute of
Pondicherry, 2003). A variety of forest vegetation from wet
to semi-arid types is derived from such difference in rainfall,
and Kerala is particularly famous for evergreen forests,
bamboos and palms (Chundamannil, 1993).
Indian Ocean Tamil Nadu
persons km-2 in 2001 (Datta et al, 2004). Around 74 % of the population still lives in rural areas (Forest
Survey of India, 2001). Most of the population speaks Malayalam, which is employed as the official
language of the state. Tribal people, 1.1 % of the total population in 2001 (ibid.), are mainly living in
forested regions and some are still inside forest reserves.
Before the independence, most of the southern part was out of the direct rule of the colonial government and
controlled by the Maharaja of Travancore-Cochin United Kingdom, while the northern part formed Malabar
district under the Madras Presidency. When the Forest Act was first enforced in 1878, the Madras
Presidency objected it due to the potentiality of plantation development particularly in the Western Ghat. It
was finally settled with establishment of its own Madras Forest Act in 1882 but forestland demarcation did
not get moving (Ribbentrop, 1900). In addition, the long existence of princely states and separated
administration after the independence caused a delay in establishment of any uniformed forest administration
and management system in Kerala. These areas were transferred to Travancore state, Cochin state, and
Malabar district of Madras state after the independence (Kerala Gazetteers Department, 1989; Vasudevan and
Sujatha, 2001).
Circle Conservator of Forests
Divisional forest office Divisional Forest Officer
Range office Range Officer
Section Forester
Beat Forest Guard
Kerala Forest and Wildlife Department (KFD) Principle Chief Conservator of Forests
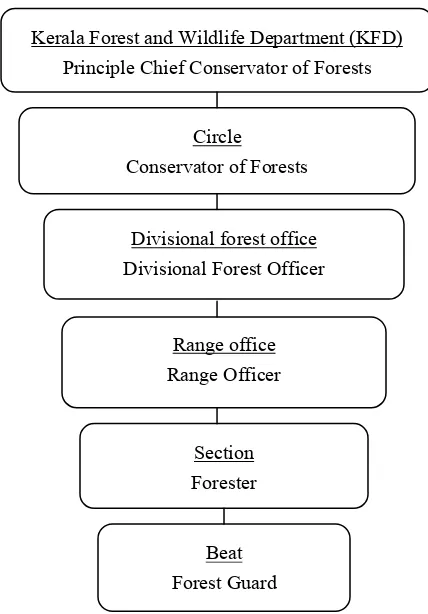
F igure 7.2. Forest management organization in Kerala (KFD, 2002)
The current jurisdiction of Kerala state was created in 1956 with amalgamation of these three regions.
Land Reform Act in 1963, and Kerala Private Forests (Vesting and Assignment) Act in 1971 brought about
great progress in the establishment of the state forest (Masuda and Mishiba, 2003). Now all of the state
forests in Kerala have already been classed to 1,103,800 ha of reserved forests and 18,300 ha of protected
forests. The total forestland of 1,122,100 ha accounts for 28.9 % of the state land (Forest Survey of India,
2001). These forest reserves in Kerala are managed under a highly stratified organization of the KFD
(Figure 7.2). A total of 8,500 persons are employed under the KFD to support this complicated
organization (KFD, 2002); where a staff member takes care around 130 ha of forest land on a simple average.
4. Development of PF M in Kerala
4.1. Outline of the PF M Programs
While JFM has expanded in many states during the 1990s, the PFM guideline was established later in 1998 in
Kerala. The reasons behind the delay could not be specified in this study, but the financial support by the
World Bank triggered the rapid progress. After the proclamation of the PFM guideline, it is recorded that
positive changes have been brought in the livelihood of local people and in the forest conditions (French
Institute of Pondicherry, 2003).
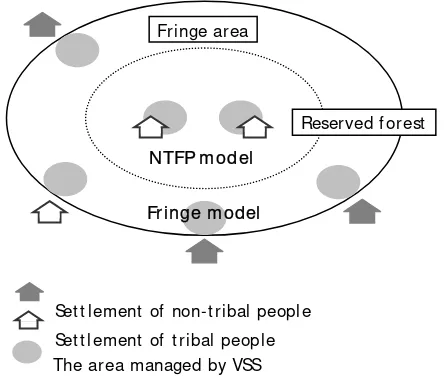
According to an internal document provided by the KFD in 2002, the PFM program in Kerala consists of
three models, namely, Fringe model, Non-Timber Forest Products (NTFP) model, and a separate model for
the Cardamom Hills Reserve. The difference between the Fringe and NTFP models is that the former
involves the population outside forests, while the latter is applied to the tribal minorities still living inside the
forests and making their livelihood by NTFP collection (Figure 7.3).
Fringe m odel
Fringe area
Reserved f orest
NTFP m odel
Set t lement of non-t ribal people Set t lement of t ribal people The area managed by VSS
The implementation body of PFM is called Vana Samrakshana Samithi (VSS), which means forest
conservation committee in Sanskrit. The development of PFM process consists of five stages: initial (2
months), preparation (2 months), planning (4 months), implementation (40 months), and monitoring stage
(60 months). During the initial stage, local people are organized to a VSS by the KFD. The VSS is
expected to establish a micro-plan under its own initiatives, and after approval of the plan, it makes a contract
with the KFD to maintain and manage a certain area of forest. The outline of the Fringe model is as
follows:
• The maximum area to be transferred to a VSS is 300 hectares of reserve forests.
• Each VSS has the charge of the core fund, credibility fund for office works, and operational fund for
activities, which are provided by the KFD based on the allocated forest area and the number of VSS
members, in the custody of forest officers at a divisional level.
• Each VSS can sell NTFP from the allocated reserve forest or fine forest offenders, and can add the
revenue to the core fund together with other subsidies.
As per the guidelines of JFM program, 33% of the total executive members of the VSS must be women. A
VSS is led by a locally nominated president and an officially appointed secretary who is generally the
forester of the section concerned. These president and secretary are expected to coordinate the government
programs for local communities through VSS members. To keep the records of revenue and expenditures
of the VSS, a separate post called treasurer is appointed. The executive members of VSS are normally
selected from different parts of the society considering gender, castes, tribal groups, geographical
representation and so on.
1 3
1 9
5 1
1 2 0
1 6 3
0 2 0 4 0 6 0 8 0 1 0 0 1 2 0 1 4 0 1 6 0 1 8 0
1 9 9 9 2 0 0 0 2 0 0 1 2 0 0 2 2 0 0 3 *
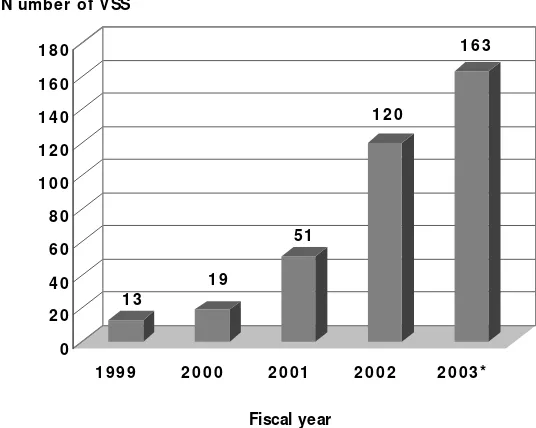
Fiscal year N umber of V SS
Source: Kerala Forest and Wildlife Department, 2003.
Since the beginning of PFM in Kerala, the formation and implementation of VSS has continuously increased
(Figure 7.4). As of October 2003, 366 Fringe VSS were already formed, covering around 187,504 people of
46,033 households. On an average 126 households are organized into a VSS.
4.2. Organization and Activities of the Randukai VSS
Randukai does not refer to a particular administrative jurisdiction. The area consists of a ward and a part of
another ward of the Thrissur district. According to the oral history of the respondents, the area around
Randukai had been covered by forests until the 1940’s and almost uninhabited except a few tribal people.
Most of the current population was gradually migrated from different parts of the state, first as logging
workers employed by the government. Now the area is developing towards a suburb, and it is easy to
access by bus or other means of land transportation. The nearest city Challakudi is located around 100 km
from Kochi, the ‘business center’ of Kerala.
The Randukai VSS was formed in 2000 and started the activities in 2001 after their five-year micro plan had
been approved by the KFD. Altogether, 373 people from 223 households were organized into the VSS, and
193 hectares out of a forest reserve of around 500 ha were allocated to the VSS. The settlement where the
VSS members reside is located in between this forest reserve and another 1,630 ha of teak (Tectona grandis)
plantation established by the KFD from 1953 to 1982. The forest land has already been demarcated and
stone-built signs called jhanda are arranged on the main corners of the boundary. According to the
guideline, an NGO or NGI (non-governmental individual) should be appointed and employed by the KFD as
an intermediary between a VSS and the KFD. In the case of Randukai, a university student was employed
as an NGI, and the president of VSS, also one of the local people, had a master’s degree. Though the
population of Randukai consisted of both tribal and non-tribal people, no tribal people were organized to the
Randukai VSS. They utilized another part of forest reserves and were allowed to sell the NTFP.
Main activities of the Randukai VSS were: construction of sheeting against soil erosion, enrichment tree
planting on patches of open land inside the allocated area, and patrolling. At the time of our primary data
collection in 2002, construction and planting works had already been completed, and the remaining routine
activities were just patrolling and meeting. The former was carried out by the group of the Forest Protection
Gang whose members were appointed by the VSS. The works were compensated at the beginning but later
left unpaid due to lack of fund. The routine meeting of the executive body was held every month and the
5. Details of Sample H ouseholds
5.1. Sampling Method and an Outline of Sample H ouseholds
The members of the Randukai VSS were categorized into four socio-economic groups by wealth ranking,
which was accomplished by a local NGO on the initiative of the KFD in 2001. To categorize the members,
they adopted following indicators representing socio-economic conditions and gave a point to each: • Houselessness including roofless
• Latrine
• Absence of drinking water facilities, or any type of water facilities farther than 150 m from the house • More than two daughters under 18 years of age
• Without dependence • Illiterate
• Mal-nutrition, less than two meals a day • Only one household earner
• Alcoholic
• Scheduled caste or scheduled tribe
Based on the sum of points, the 223 member households were ranked to wealthy (0-1), ordinary (2-3), poor
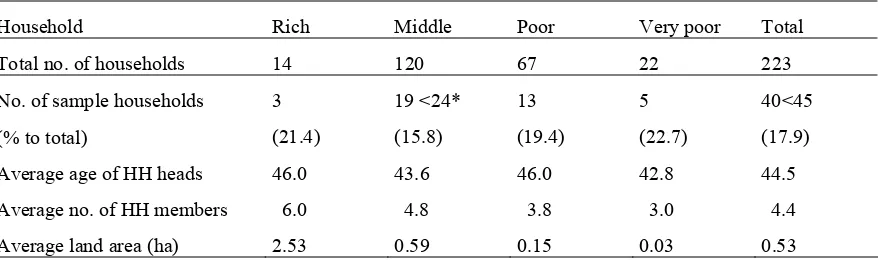
(4), and below poverty line (5 points and above). For our study, around 20 % on an average were randomly
selected from each rank, which is hereafter represented as rich, middle, poor, and very poor. Of the 45
sample households thus chosen, 5 were finally omitted due to their frequent or long absence. Though the
average land area of each rank well corresponds to the wealthiness, 2.03 ha for the rich, 0.67 for the middle,
0.15 ha for the poor, and 0.03 ha for the very poor, there were two samples with prominent data in land
tenure. Consequently one sample of the rich group with the land area below the average of the middle
group was reallocated to the middle group, vice versa, and finally obtained 3 sample households for the rich,
19 for the middle, 13 for the poor, and 5 for the very poor group (Table 7.1).
There is no significant difference in the average age of the household heads (p=0.86 by variance analysis).
However, it does not always mean that there was no bias of the life cycle, as a significant difference is
observed in the average number of household members. It can be explained by the historical background of
this area, where the clearance of forests took place relatively recently, after the Grow More Food Campaign
in 1943. In regard to the origin of the land, 16 households were migrated from adjacent regions and
acquired the land by clearance, while 22 were from outside the district and acquired the land by purchase.
The people of the rich group belong to the former pioneers and have maintained an extended family system
on their plantations. The relatively small average size of the very poor group is derived from a widow
Table 7.1. Total number of the sample households, and averages of age, household members, and land area by wealth ranking (Oct. 2002). Five sample households of the middle rank (*) could not be interviewed due to their absence at every time of visit.
Household Rich Middle Poor Very poor Total
Total no. of households 14 120 67 22 223
No. of sample households
(% to total)
3
(21.4)
19 <24*
(15.8)
13
(19.4)
5
(22.7)
40<45
(17.9)
Average age of HH heads 46.0 43.6 46.0 42.8 44.5
Average no. of HH members 6.0 4.8 3.8 3.0 4.4
Average land area (ha) 2.53 0.59 0.15 0.03 0.53
Source: Randukai VSS and field survey in 2002
5.2. F arming System
Kerala is one of the major cash crop producing states in India. The trend of decreasing farm sizes and
fragmentation, however, resulted in a declining importance of the agricultural sector. Together with
urbanization along the coastal line, a shift from annual staple crops to perennial non-staple crops had
increased considerably (FAO, 1985). Once expanded area of food crops such as rice and cassava under the
Grow More Food Campaign after the famine in 1943 decreased again and were replaced with perennial crops
such as coconut, rubber, and banana (George, 2001).
The land use pattern in Randukai also reflects these tendencies. According to the oral history of the sample
households, wet paddy was once cultivated in Randukai. Those paddy fields have already been converted to
dry fields and the main crops are perennial, such as rubber, coconut, areca nut, and banana. Under or in
between the rows of perennial crops, annual cash crops, such as beans, ginger, turmeric, cassava, and
pineapples, are arranged. Such agroforestry practices are commonly found all over the state.
Despite the small size of land tenancy, income from spice crops is adequate in Randukai. People look
attracted to cultivation of spices, and sell them at the local markets for quick returns.
5.3. Source of Income
Of the sample households, 15 % made their living by farming only, and 85 % of households more or less had
other sources of income such as physical wage works, carpentry, tailoring, shopkeeping, and migrant works.
At the time of our interviews, there were three household members working abroad in Sri Lanka, Saudi
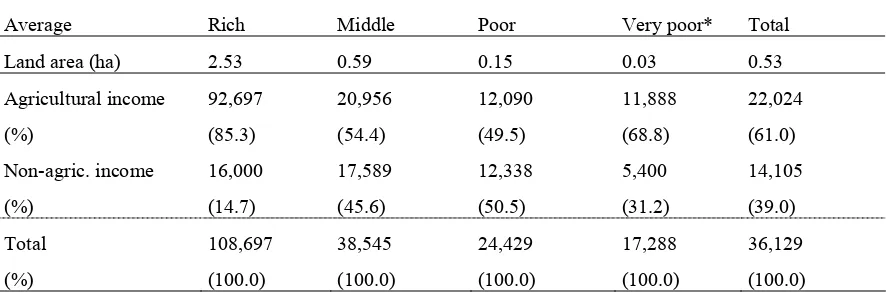
Due to the larger area of the land, importance of agricultural income was higher among the richer people.
The correlation coefficient is 0.83 for the land area and agricultural net income, and 0.71 for the land and
total income. The ratio of the average net agricultural income to the total income is 85.3 % for the rich,
54.4 % for the middle, and 49.5 % for the poor group. The relatively high dependency of the very poor
group on agricultural income, 68.8 %, was derived from agricultural wage works, tenantry, and cattle rearing.
The household heads of this group had various disadvantages, such as bad physical condition and background
of the scheduled caste. One was relatively recently migrated from Tamil Nadu. The average income of
each group also well corresponds to the result of wealth ranking (Table 7.2).
Table 7.2. Average of annual net cash income (Oct. 2001-Sep. 2002). One sample household of very poor group (*), a widow who gained her living by supports of relatives, is excluded.
Average Rich Middle Poor Very poor* Total
6. Dependency of Local Community on F orest Resources and the Role of PF M
6.1. Utilization of F orest Resources
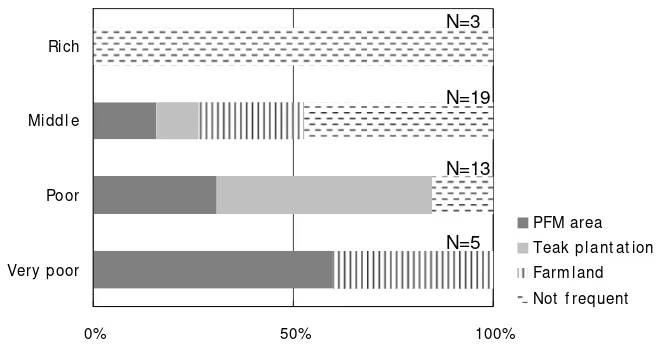
There was no change in NTFP collection before and after participation in PFM. Almost one third of the
total sample households obtained their firewood mainly from the farmland outside forests and 2 households
used no firewood in the preceding year. When every temporary use of firewood is taken into consideration,
dependency on forest resources was highest among the people of the poor group. In regard to the very poor
group, 2 sample households acquired firewood from the farmland owned by the relatives or where they
engaged in agricultural wage works. In addition to the natural forest allocated to the VSS, the teak
plantation could also be a good source of firewood (Figure 7.5).
The factor that determines the place to collect firewood was distance. As the settlement and farmland are
PFM forest or the plantation, and no household utilized both of them for firewood collection. It seems the
first priority is given to the farmland, and the PFM allotment and teak plantation supports the landless people.
The average area of their farmland is 1.01 ha for those who mainly collected firewood from the farmland (15
households excluding 2 tenants of the very poor group), while 0.25 ha for those collected from the PFM
allotment and teak plantation (23 households). Propane gas and kerosene were used as supplements to
firewood.
0% 50% 100%
Ver y p oor Poor Mid d l e Rich
PFM area Teak p l ant at ion Farm l and Not ut il ize N=5
N=13 N=19 N=3
Source: Field survey in 2002.
F igure 7.5. Main localities of firewood collection (Oct. 2001-Sep. 2002)
Among the 26 households who engaged in firewood collection more than once a week, 19 households
(73.1 %) mainly collected it from the PFM allotment or teak plantation, while 7 (26.9 %) from private
farmland (Figure 7.6).
0% 50% 100%
Very poor Poor Middl e Rich
PFM area Teak pl ant at ion Farm l and Not f requent
N=3
N=19
N=13
N=5
Source: Field survey in 2002.
F igure 7.6. Main localities of routine firewood collection (Oct. 2001-Sep. 2002). Fewer than once a
The buying and selling of firewood was found between a sample of the middle group and the very poor group,
but it was not common in this area and according to the regulations only tribal people were allowed to sell
firewood. One of the reasons for low dependency on firewood among the rich group is that they can obtain
it easily from their homestead. Such a light work may not be separated from other daily activities.
Another reason was that firewood collection was done not by the family members themselves but by their
housekeeping servants instead.
The utilization of forests for fodder was less than firewood because not all the households raised cattle.
Among the 40 sample households, 19 (47.5 %) were not in need of fodder and 11 (27.5 %) mainly utilized
farmland. Grazing inside forest reserves was prohibited but actually occurred. However, this practice was
just occasionally reported at the meetings but not regarded as an offence by the VSS members.
Other necessities collected from the forest were medicinal plants, edible fruits, green manure, and poles.
While almost all the households utilized various medicinal plants, only two households answered that they
occasionally engaged in wild fruits collection during the preceding year.
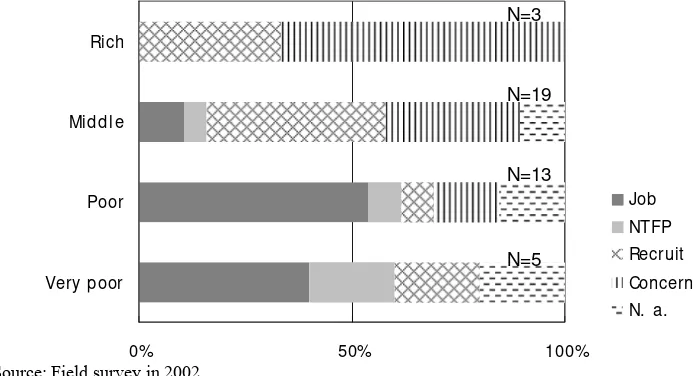
6.2. Incentives to Participating in PF M
Among the 40 sample households, 11 and 3 household heads answered that the working opportunity
provided by PFM and the authorized right to collect NTFP were the main reasons for them to take part in
PFM, respectively. Besides these households (35.0 % of the total), 10 households (25.0 %) showed their
concern for forest conservation and 11 (27.5 %) answered that they were prompted to participate. While
those who showed their concern about forest issues were markedly found among richer groups, the working
opportunity provided by PFM was more important among the poorer groups (Figure 7.7).
0% 50% 100%
Very poor Poor Middl e Rich
Job NTFP Recruit Concern N. a. N=3
N=19
N=13
N=5
Source: Field survey in 2002.
The frequency of attendance at the general meeting, which had been held twice since the Randukai VSS
started the activities until the time of interviews, was highest among the households from the very poor
(Figure 7.8).
0% 50% 100%
Very poor Poor Middl e Rich
2 t im es 1 t im e
Did not at t end N. a.
N=3
N=19
N=13
N=5
Source: Field survey in 2002.
F igure 7.8. Frequency of attending the general meeting
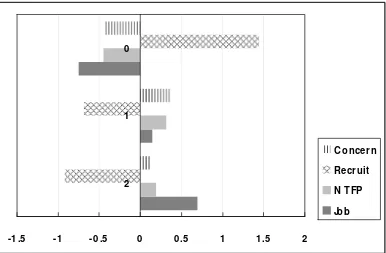
-1 .5 -1 -0 .5 0 0 .5 1 1 .5 2
2 1 0
C oncer n
Recr uit
N T FP
Job
Source: Field survey in 2002
F igure 7.9. Adjusted residuals of the frequency of attending the meetings and the reasons for participating
According to the Chi Square Test, no relation is found between the reasons for participating in and the
frequency of attending at the meeting [χ2 = 2.2279 < χ2 (6, 0.05) = 12.5916]. However, a tendency can be
found that those who did not have positive reasons for participating in PFM were not so earnest about the
meetings (Figure 7.9).
7. Discussions and Conclusion
Unlike the recent political change took place in Indonesia, which realized partial devolution of forest
administration from the central to local governments, JFM aims at devolution from the state governments
directly to the communities inside and outside forests under the strong initiative of the central government.
After the trials at regional levels, the central government incorporated this new idea into the forest policy and
has encouraged the state governments to adopt it. To what extent the New Forest Policy and JFM
guidelines can come into force at the state level is another subject to be studied, but yet we can learn an
effective combination of top-down and bottom-up approaches from the outline of the process.
Though Kerala state accepted JFM later than in other states, a laggard according to Bahuguna (2002), the
KFD immediately took various measures like trainings and study tours to advanced areas and discussed the
ideas of participatory approaches, two of which were embodied as the Fringe model and NTFP model. The
area under PFM rapidly expanded and reached 15.2 % of the total recorded forests in 2003.
One of the factors that brought such a rapid expansion can be found in absence of serious deforestation
problems. Despite the high population density, the land use pattern outside forests contributed to reduction
of the dependency on forest resources. From the top of hills, indeed, bare lands could be observed only
along roads and residential areas. Almost all parts of the state were covered with tree crops, and Kerala, the
name of the state, means the land of coconut itself. Such common practices of agroforestry on the farmland
in Kerala brought about decrease in the daily pressure on forest resources. It suggests that the potentiality
of agroforestry could be an alternative to the deforestation caused by subsistence activities. In the case of
Randukai, various sources of non-agricultural income also contribute to reduce the pressure on forests.
As per the instructions of PFM, different stakeholders at the local level were well organized into the VSS.
One of the households ranked as the rich comes of a landlord family that once reigned before the Kerala
Land Reform Act was enforced in 1963. However, effects derived from such involvement of the relatively
wealthy class were not clear. They joined the VSS because they were recruited or interested in
environmental issues, but they looked reluctant to be concerned in actively.
By contrast, expectations on income generation through participation in the VSS were more apparent among
complained of it at our interviews. Only one sample household could earn some by patrolling in the last one
year. The arrearage of the financial support from the KFD also discouraged the people and may deaden the
enthusiasm at the beginning.
Although such technical problems were observed, they do not seem to affect forest resources. The existence
of more valuable teak plantations in good conditions without PFM tells its own tale that the forest department
has maintained the resources using a sufficient number of professional staff by so-called conventional
forestry. If the goal of PFM is an absolute transfer of forest management to local communities, how to
entrust the management of plantations can also be taken into considerations. In any case, it seems necessary
to take measures of income generation based on forest resources. Otherwise, the organization of VSS may
become an empty formality.
References
Ahmed, M. F., 1997. In-depth country study: India. FAO Regional Office for Asia and the Pacific, Bangkok.
Bahuguna, V. K., 2002. Forest policy initiatives in India over the last few years. In Proceeding of the Forest Policy Workshop 22-24 January, 2002. Kula Lumpur.
Chundamannil, M., 1993. The history of forest management in Kerala. Kerala Forest Research Institute, Peechi.
Damodaran, D., 2003. Joint Forest Management in India: assessment of performance and evaluation of impacts. N. p., Bangalore.
Datta, R. and K. P. M. Sundaram, 2004. Indian economy. S. Chand, New Delhi.
FAO, 1985. Intensive multiple-use forest management in the tropics: analysis of case studies from India, Africa, Latin America and the Caribbean. FAO, Rome.
FAO, 2001. Global forest resources assessment: main report. FAO, Rome.
Forest Survey of India, 2001. State of forest report 2001. Forest Survey of India, Dehra Dun.
French Institute of Pondicherry, 2003. A brief outline of biodiversity conservation strategy and action plan for Kerala. KFD, Thiruvananthapuram.
George, P. S. 2001. Population and land use in Kerala. In Indian National Science Academy et al (eds.), Growing populations, changing landscapes: studies from India, China and the United States. Washington D. C.
Hill, I. and D. Shilds, 1998. Incentives for Joint Forest Management in India: analytical methods and case studies. World Bank, Washington D.C.
KFD, 2002. Green citadel: an interactive CD-ROM on forests of Kerala. KFD, Thiruvananthapuram.
Kerala Gazetteers Department, 1989. Kerala Government gazetteers, vol. 3. Government of Kerala, Trivandrum. Kerala State Land Use Board, 1995. Land resources of Kerala State. Kerala State Land Use Board, Thiruvananthapuram. Kumar, S. and S. Kant, 2005. Bureaucracy and new management paradigms: modeling foresters’ perceptions regarding
community-based forest management in India. Forest Policy and Economics 7: 651-669.
Masuda, M. and J. Mishiba, 2003. Creation of forest reserves and change of the role in India (in Japanese). Bulletin of Tsukuba University Forests 19: 1-40.
MoEF, 2004. Annual report 2003-2004. MoEF, New Delhi.
Misra, D. and S. Kant, 2004. Production analysis of collaborative forest management using an example of joint forest management from Gujarat, India. Forest Policy and Economics 6: 301-320.
Nagamine, R., 2002. Forest policy after the independence (in Japanese). In H. Yanagisawa (ed.), Modern South Asia: development and environment. University of Tokyo Press, Tokyo.
Pari, B., 1998. The persistence of population in Indian forest policy. The Journal of Peasant Studies 5 (4): 96-123. Ribbentrop, B., 1900. Forestry in British India. Government Priniting, Calcutta.