KUESIONER PENELITIAN
DETERMINAN PERILAKU MEROKOK ANAK SEKOLAH DASAR DI
DESA SIMATAHARI KECAMATAN KOTA PINANG
KABUPATEN LABUHANBATU SELATAN
TAHUN 2015
Tanggal Kunjungan
:
No responden
:
Tanggal wawancara
:
a) Nama
:
I. Identitas Responden
Identitas Responden
1)
Umur
1.
…………..tahun
2)
Jenis Kelamin
1. Laki-laki
2. Perempuan
3)
Uang Saku
Rp………
4)
Umur Merokok Pertama kali
………tahun
5)
Nilai Rata-Rata Raport 1tahun terakhir
……….
II. Stimulus
No
Perilaku Merokok Keluarga
YA
Tidak
1
Apakah anda memiliki ayah merokok didalam rumah
2
Apakah anda memiliki ibu merokok didalam rumah
3
Apakah anda memiliki saudara (abang) yang merokok didalam
rumah
4
Apakah anda memiliki saudara (kakak) yang merokok didalam
rumah
No
Perilaku Merokok Guru
YA
Tidak
1
Apakah guru anda merokok didekat anda
4
Apakah guru anda pernah menyuruh anda untuk membeli rokok
No
Perilaku Merokok Teman
YA
Tidak
1
Apakah teman anda memiliki teman yang merokok
2
Apakah teman anda merokok didekat anda
No
Ketersediaan Rokok
YA
Tidak
1
Apakah warung di tempat anda membolehkan anak-anak merokok
2
Apakah dirumah anda selalu tersedia rokok
III. Pengetahuan Responden Dalam Merokok
Pilihlah salah satu jawaban dari setiap pertanyaan dibawah ini yang dianggap paling
sesuai
1)
Menurut kamu, bahaya kesehatan apa yang dapat ditimbulkan oleh rokok kepada
perokok aktif…………
-Penyakit Gangguan pernafasan
a)YA
b) Tidak
-Penyakit pada gigi dan mulut
a)YA
b) Tidak
-Penyakit Kanker
a)YA
b) Tidak
2)
Orang sudah dewasa diperbolehkan untuk merokok
-Ayah boleh merokok
a)YA
b) Tidak
-Ibu boleh merokok
a)YA
b) Tidak
-Abang dan kakak boleh merokok
a)YA
b) Tidak
3)
Menurut kamu, bahaya kesehatan apa yang dapat ditimbulkan oleh rokok kepada
orang lain disekitar perokok……….
-Gangguan kesehatan
a)YA
b) Tidak
-Penyakit Gangguan pernafasan
a)YA
b) Tidak
-Penyakit Kanker
a)YA
b) Tidak
4)
Siapa yang terancam kesehatannya ketika ada orang yang merokok ….
-Orang yang merokok
a)YA
b) Tidak
-Orang dewasa yang berada disekitar perokok
a)YA
b) Tidak
-Anak-anak yang berada disekitar perokok
a)YA
b) Tidak
5)
Orang yang tidak boleh memiliki perilaku merokok
-
Anak-anak
a)YA
b) Tidak
-
Orang dewasa
a)YA
b) Tidak
-
Perempuan hamil
a)YA
b) Tidak
6)
Bahaya perilaku merokok bagi anak-anak sekolah……..
-Menurunkan prestasi sekolah
a)YA
b) Tidak
-Membuat anak malas belajar
a)YA
b) Tidak
-Membuat penyakit pada anak-anak
a)YA
b) Tidak
7)
Bahaya perilaku merokok bagi orang dewasa…….
-Penyakit Gangguan pernafasan
a)YA
b) Tidak
-Penyakit Kanker
a)YA
b) Tidak
8)
Bahan zat kimia berbahaya untuk membuat rokok …….
-Nikotin
a)YA
b) Tidak
-Tar
a)YA
b) Tidak
-Timah Hitam
a)YA
b) Tidak
9)
Mengapa pada bungkus rokok diberi peringatan…………
-Agar orang tidak merokok
a)YA
b) Tidak
-Agar orang mengetahui bahaya merokok
a)YA
b) Tidak
-Agar orang takut untuk merokok
a)YA
b) Tidak
10)
Jenis jenis rokok yang kamu ketahui adalah……….
-Rokok daun
a)YA
b) Tidak
-Rokok filter
a)YA
b) Tidak
-Rokok Kretek
a)YA
b) Tidak
IV. Sikap Responden Dalam Merokok
Pilihlah jawaban dengan cara menceklis/contreng (
√) pada kolom yang telah
disediakan.
S
= Setuju
TS
= Tidak Setuju
V. Perilaku Merokok
Pilihlah jawaban yang menurut anda sesuai dengan yang dilakukan
dengan
cara mengisi jawaban yang sesuai.
1.
Jumlah rokok yang dikonsumsi dalam satu hari ………. Batang/ hari.
NO
Pernyataan
S
TS
1
Merokok berbahaya bagi kesehatan saya
2
Merokok akan meningkatkan kepercayaan diri saya
3
Tidak ada satu orang pun yang ingin menderita sakit akibat merokok
4
Merokok hanya berbahaya bagi kesehatan perokok saja
5
Merokok akan membuat saya tambah gaul
6
Saya akan senang jika ada teman yang menawarkan rokok untuk merokok
7
Saya akan menawarkan rokok kepada teman saya
8
Merokok adalah symbol pertemanan
9
Merokok bisa membuat prestasi saya menurun
10
Merokok sebagai simbol kedewasaan
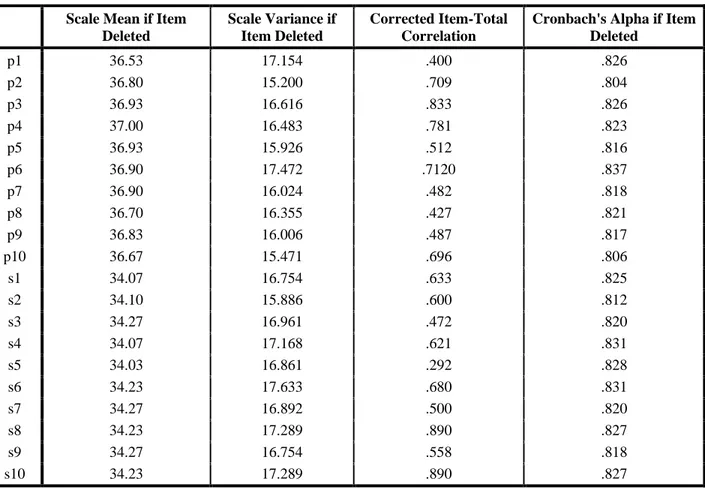
Tabel Uji Validitas dan realibilitas
Item-Total Statistics Scale Mean if Item
Deleted
Scale Variance if Item Deleted
Corrected Item-Total Correlation
Cronbach's Alpha if Item Deleted p1 36.53 17.154 .400 .826 p2 36.80 15.200 .709 .804 p3 36.93 16.616 .833 .826 p4 37.00 16.483 .781 .823 p5 36.93 15.926 .512 .816 p6 36.90 17.472 .7120 .837 p7 36.90 16.024 .482 .818 p8 36.70 16.355 .427 .821 p9 36.83 16.006 .487 .817 p10 36.67 15.471 .696 .806 s1 34.07 16.754 .633 .825 s2 34.10 15.886 .600 .812 s3 34.27 16.961 .472 .820 s4 34.07 17.168 .621 .831 s5 34.03 16.861 .292 .828 s6 34.23 17.633 .680 .831 s7 34.27 16.892 .500 .820 s8 34.23 17.289 .890 .827 s9 34.27 16.754 .558 .818 s10 34.23 17.289 .890 .827
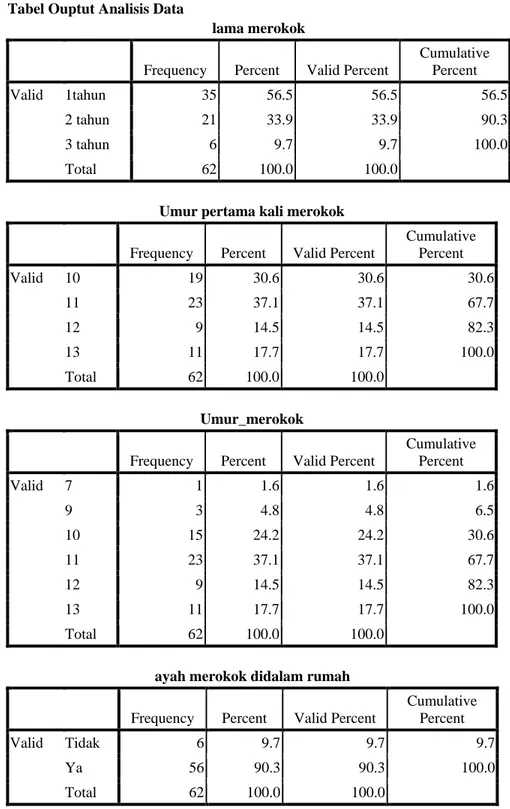
Tabel Ouptut Analisis Data
lama merokok
Frequency Percent Valid Percent
Cumulative Percent Valid 1tahun 35 56.5 56.5 56.5 2 tahun 21 33.9 33.9 90.3 3 tahun 6 9.7 9.7 100.0 Total 62 100.0 100.0
Umur pertama kali merokok
Frequency Percent Valid Percent
Cumulative Percent Valid 10 19 30.6 30.6 30.6 11 23 37.1 37.1 67.7 12 9 14.5 14.5 82.3 13 11 17.7 17.7 100.0 Total 62 100.0 100.0 Umur_merokok
Frequency Percent Valid Percent
Cumulative Percent Valid 7 1 1.6 1.6 1.6 9 3 4.8 4.8 6.5 10 15 24.2 24.2 30.6 11 23 37.1 37.1 67.7 12 9 14.5 14.5 82.3 13 11 17.7 17.7 100.0 Total 62 100.0 100.0
ayah merokok didalam rumah
Frequency Percent Valid Percent
Cumulative Percent
Valid Tidak 6 9.7 9.7 9.7
Ya 56 90.3 90.3 100.0
Total 62 100.0 100.0
Frequency Percent Valid Percent Cumulative Percent Valid Tidak 41 66.1 66.1 66.1 Ya 21 33.9 33.9 100.0 Total 62 100.0 100.0
saudara (abang) yang merokok didalam rumah
Frequency Percent Valid Percent
Cumulative Percent
Valid Tidak 11 17.7 17.7 17.7
Ya 51 82.3 82.3 100.0
Total 62 100.0 100.0
saudara (kakak) yang merokok didalam rumah
Frequency Percent Valid Percent
Cumulative Percent Valid Tidak 28 45.2 45.2 45.2 Ya 34 54.8 54.8 100.0 Total 62 100.0 100.0 Guru_kat
Frequency Percent Valid Percent
Cumulative Percent Valid guru tidak mendukung perilaku
merokok
26 41.9 41.9 41.9
Guru mendukung merokok 36 58.1 58.1 100.0
Total 62 100.0 100.0
Teman Kategori
Frequency Percent Valid Percent
Cumulative Percent Valid Teman tidak mendukung perilaku
merokok
15 24.2 24.2 24.2
teman mendukung merokok 47 75.8 75.8 100.0
Total 62 100.0 100.0
Ketersediaan rokok
Frequency Percent Valid Percent
Cumulative Percent
Valid mendukung rokok 27 43.5 43.5 43.5
Tidak mendukung rokok 35 56.5 56.5 100.0
Total 62 100.0 100.0
Kat_tahu
Frequency Percent Valid Percent
Cumulative Percent
Valid Pengetahuan Tinggi 14 22.6 22.6 22.6
pengetahuan sedang 40 64.5 64.5 87.1
pengetahuan rendah 8 12.9 12.9 100.0
Total 62 100.0 100.0
Sikap kat
Frequency Percent Valid Percent
Cumulative Percent Valid sikap tidak mendukung 36 58.1 58.1 58.1
Sikap mendukung 26 41.9 41.9 100.0
Total 62 100.0 100.0
Banyak konsumsi rokok
Frequency Percent Valid Percent
Cumulative Percent
Valid Rendah 0-5 33 53.2 53.2 53.2
Tinggi >6 29 46.8 46.8 100.0
Cross tabb
ayah merokok didalam rumah * Banyak konsumsi rokok Crosstab
Banyak konsumsi rokok
Total Tinggi >6 Rendah 0-5
ayah merokok didalam rumah Ya Count 25 31 56
% of Total 40.3% 50.0% 90.3% Tidak Count 4 2 6 % of Total 6.5% 3.2% 9.7% Total Count 29 33 62 % of Total 46.8% 53.2% 100.0% Chi-Square Tests Value df Asymp. Sig. (2-sided) Exact Sig. (2-sided) Exact Sig. (1-sided) Pearson Chi-Square 1.056a 1 .304 Continuity Correctionb .357 1 .550 Likelihood Ratio 1.065 1 .302
Fisher's Exact Test .405 .275
Linear-by-Linear Association 1.039 1 .308
N of Valid Cases 62
a. 2 cells (50.0%) have expected count less than 5. The minimum expected count is 2.81. b. Computed only for a 2x2 table
Risk Estimate
Value
95% Confidence Interval Lower Upper Odds Ratio for ayah merokok
didalam rumah (Ya / Tidak)
.403 .068 2.385 For cohort Banyak konsumsi
rokok = Tinggi >6
.670 .354 1.266 For cohort Banyak konsumsi
rokok = Rendah 0-5
1.661 .523 5.275
ibu merokok didalam rumah * Banyak konsumsi roko Crosstab
Banyak konsumsi rokok
Total Tinggi >6 Rendah 0-5
ibu merokok didalam rumah Ya Count 17 4 21
% of Total 27.4% 6.5% 33.9% Tidak Count 12 29 41 % of Total 19.4% 46.8% 66.1% Total Count 29 33 62 % of Total 46.8% 53.2% 100.0% Chi-Square Tests Value df Asymp. Sig. (2-sided) Exact Sig. (2-sided) Exact Sig. (1-sided) Pearson Chi-Square 14.900a 1 .000 Continuity Correctionb 12.897 1 .000 Likelihood Ratio 15.670 1 .000
Fisher's Exact Test .000 .000
Linear-by-Linear Association 14.660 1 .000
N of Valid Cases 62
a. 0 cells (.0%) have expected count less than 5. The minimum expected count is 9.82. b. Computed only for a 2x2 table
Risk Estimate
Value
95% Confidence Interval Lower Upper Odds Ratio for ibu merokok
didalam rumah (Ya / Tidak)
10.271 2.855 36.948 For cohort Banyak konsumsi
rokok = Tinggi >6
2.766 1.646 4.648 For cohort Banyak konsumsi
rokok = Rendah 0-5
.269 .109 .665
saudara (abang) yang merokok didalam rumah * Banyak konsumsi rokok Crosstab
Banyak konsumsi rokok
Total Tinggi >6 Rendah 0-5
saudara (abang) yang merokok didalam rumah
Ya Count 25 26 51 % of Total 40.3% 41.9% 82.3% Tidak Count 4 7 11 % of Total 6.5% 11.3% 17.7% Total Count 29 33 62 % of Total 46.8% 53.2% 100.0% Chi-Square Tests Value df Asymp. Sig. (2-sided) Exact Sig. (2-sided) Exact Sig. (1-sided) Pearson Chi-Square .582a 1 .445 Continuity Correctionb .185 1 .667 Likelihood Ratio .590 1 .442
Fisher's Exact Test .519 .336
Linear-by-Linear Association .573 1 .449
N of Valid Cases 62
a. 0 cells (.0%) have expected count less than 5. The minimum expected count is 5.15. b. Computed only for a 2x2 table
Risk Estimate
Value
95% Confidence Interval Lower Upper Odds Ratio for saudara
(abang) yang merokok didalam rumah (Ya / Tidak)
1.683 .438 6.462
For cohort Banyak konsumsi rokok = Tinggi >6
1.348 .588 3.093 For cohort Banyak konsumsi
rokok = Rendah 0-5
.801 .476 1.350
saudara (kakak) yang merokok didalam rumah * Banyak konsumsi rokok Crosstab
Banyak konsumsi rokok
Total Tinggi >6 Rendah 0-5
saudara (kakak) yang merokok didalam rumah
Ya Count 17 17 34 % of Total 27.4% 27.4% 54.8% Tidak Count 12 16 28 % of Total 19.4% 25.8% 45.2% Total Count 29 33 62 % of Total 46.8% 53.2% 100.0% Chi-Square Tests Value df Asymp. Sig. (2-sided) Exact Sig. (2-sided) Exact Sig. (1-sided) Pearson Chi-Square .315a 1 .575 Continuity Correctionb .093 1 .760 Likelihood Ratio .315 1 .575
Fisher's Exact Test .617 .380
Linear-by-Linear Association .310 1 .578
N of Valid Cases 62
a. 0 cells (.0%) have expected count less than 5. The minimum expected count is 13.10. b. Computed only for a 2x2 table
Risk Estimate
Value
95% Confidence Interval Lower Upper Odds Ratio for saudara
(kakak) yang merokok didalam rumah (Ya / Tidak)
1.333 .488 3.646
For cohort Banyak konsumsi rokok = Tinggi >6
1.167 .677 2.010 For cohort Banyak konsumsi
rokok = Rendah 0-5
.875 .550 1.392
Guru_kat * Banyak konsumsi rokok
Crosstab
Banyak konsumsi rokok
Total Tinggi >6 Rendah 0-5
Guru_kat Guru mendukung merokok Count 20 16 36 % of Total 32.3% 25.8% 58.1% guru tidak mendukung
perilaku merokok Count 9 17 26 % of Total 14.5% 27.4% 41.9% Total Count 29 33 62 % of Total 46.8% 53.2% 100.0% Chi-Square Tests Value df Asymp. Sig. (2-sided) Exact Sig. (2-sided) Exact Sig. (1-sided) Pearson Chi-Square 2.659a 1 .103 Continuity Correctionb 1.884 1 .170 Likelihood Ratio 2.689 1 .101
Fisher's Exact Test .127 .085
Linear-by-Linear Association 2.616 1 .106
N of Valid Cases 62
a. 0 cells (.0%) have expected count less than 5. The minimum expected count is 12.16. b. Computed only for a 2x2 table
Risk Estimate
Value
95% Confidence Interval Lower Upper Odds Ratio for Guru_kat
(Guru mendukung merokok / guru tidak mendukung perilaku merokok)
2.361 .833 6.691
For cohort Banyak konsumsi rokok = Tinggi >6
1.605 .878 2.935 For cohort Banyak konsumsi
rokok = Rendah 0-5
.680 .429 1.077
Teman Kategori * Banyak konsumsi rokok
Crosstab
Banyak konsumsi rokok
Total Tinggi >6 Rendah 0-5
Teman Kategori teman mendukung merokok Count 27 20 47 % of Total 43.5% 32.3% 75.8% Teman tidak mendukung
perilaku merokok Count 2 13 15 % of Total 3.2% 21.0% 24.2% Total Count 29 33 62 % of Total 46.8% 53.2% 100.0% Chi-Square Tests Value df Asymp. Sig. (2-sided) Exact Sig. (2-sided) Exact Sig. (1-sided) Pearson Chi-Square 8.888a 1 .003 Continuity Correctionb 7.205 1 .007 Likelihood Ratio 9.802 1 .002
Fisher's Exact Test .003 .003
Linear-by-Linear Association 8.745 1 .003
N of Valid Cases 62
a. 0 cells (.0%) have expected count less than 5. The minimum expected count is 7.02. b. Computed only for a 2x2 table
Risk Estimate
Value
95% Confidence Interval Lower Upper Odds Ratio for Teman
Kategori (teman mendukung merokok / Teman tidak mendukung perilaku merokok)
8.775 1.777 43.335
For cohort Banyak konsumsi rokok = Tinggi >6
4.309 1.159 16.023 For cohort Banyak konsumsi
rokok = Rendah 0-5
.491 .333 .723
Ketersediaan rokok * Banyak konsumsi rokok
Crosstab
Banyak konsumsi rokok
Total Tinggi >6 Rendah 0-5
Ketersediaan rokok mendukung rokok Count 7 20 27
% of Total 11.3% 32.3% 43.5%
Tidak mendukung rokok Count 22 13 35
% of Total 35.5% 21.0% 56.5% Total Count 29 33 62 % of Total 46.8% 53.2% 100.0% Chi-Square Tests Value df Asymp. Sig. (2-sided) Exact Sig. (2-sided) Exact Sig. (1-sided) Pearson Chi-Square 8.350a 1 .004 Continuity Correctionb 6.933 1 .008 Likelihood Ratio 8.609 1 .003
Fisher's Exact Test .005 .004
Linear-by-Linear Association 8.216 1 .004
N of Valid Cases 62
a. 0 cells (.0%) have expected count less than 5. The minimum expected count is 12.63. b. Computed only for a 2x2 table
Risk Estimate
Value
95% Confidence Interval Lower Upper Odds Ratio for Ketersediaan
rokok (mendukung rokok / Tidak mendukung rokok)
.207 .069 .622
For cohort Banyak konsumsi rokok = Tinggi >6
.412 .208 .819 For cohort Banyak konsumsi
rokok = Rendah 0-5
1.994 1.227 3.240
Kat_tahu * Banyak konsumsi rokok
Crosstab
Banyak konsumsi rokok
Total Tinggi >6 Rendah 0-5
Kat_tahu Pengetahuan Tinggi Count 7 7 14
% of Total 11.3% 11.3% 22.6%
pengetahuan sedang Count 17 23 40
% of Total 27.4% 37.1% 64.5%
pengetahuan rendah Count 5 3 8
% of Total 8.1% 4.8% 12.9% Total Count 29 33 62 % of Total 46.8% 53.2% 100.0% Chi-Square Tests Value df Asymp. Sig. (2-sided) Pearson Chi-Square 1.147a 2 .564 Likelihood Ratio 1.151 2 .563 Linear-by-Linear Association .120 1 .729 N of Valid Cases 62
a. 2 cells (33.3%) have expected count less than 5. The minimum expected count is 3.74.
Risk Estimate
Value Odds Ratio for Kat_tahu
(Pengetahuan Tinggi / pengetahuan sedang)
a
a. Risk Estimate statistics cannot be computed. They are only computed for a 2*2 table without empty cells.
Sikap kat * Banyak konsumsi rokok
Crosstab
Banyak konsumsi rokok
Total Tinggi >6 Rendah 0-5
Sikap kat Sikap mendukung Count 17 9 26
% of Total 27.4% 14.5% 41.9%
sikap tidak mendukung Count 12 24 36
% of Total 19.4% 38.7% 58.1% Total Count 29 33 62 % of Total 46.8% 53.2% 100.0% Chi-Square Tests Value df Asymp. Sig. (2-sided) Exact Sig. (2-sided) Exact Sig. (1-sided) Pearson Chi-Square 6.229a 1 .013 Continuity Correctionb 5.009 1 .025 Likelihood Ratio 6.321 1 .012
Fisher's Exact Test .020 .012
Linear-by-Linear Association 6.129 1 .013
N of Valid Cases 62
a. 0 cells (.0%) have expected count less than 5. The minimum expected count is 12.16. b. Computed only for a 2x2 table
Risk Estimate
Value
95% Confidence Interval Lower Upper Odds Ratio for Sikap kat
(Sikap mendukung / sikap tidak mendukung)
3.778 1.303 10.952
For cohort Banyak konsumsi rokok = Tinggi >6
1.962 1.143 3.366 For cohort Banyak konsumsi
rokok = Rendah 0-5
.519 .292 .924
Logistic Regression
Omnibus Tests of Model Coefficients
Chi-square df Sig.
Step 1 Step 1.909 1 .167
Block 1.909 1 .167
Model 30.653 5 .000
Model Summary
Step -2 Log likelihood
Cox & Snell R Square
Nagelkerke R Square
1 55.039a .390 .521
a. Estimation terminated at iteration number 5 because parameter estimates changed by less than .001.
Classification Tablea
Observed
Predicted Banyak konsumsi rokok
Percentage Correct Rendah 0-5 Tinggi >6
Step 1 Banyak konsumsi rokok Rendah 0-5 27 6 81.8
Tinggi >6 8 21 72.4
Overall Percentage 77.4
a. The cut value is .500
Variables in the Equation
B S.E. Wald df Sig. Exp(B)
Step 1a Rokok_ibu 2.488 .842 8.733 1 .003 12.035 Guru_kat -1.837 .916 4.025 1 .045 .159 Teman_kat 2.812 1.028 7.482 1 .006 16.645 KTRtot -1.391 .761 3.346 1 .067 .249 sikap_kat 1.014 .739 1.881 1 .170 2.755 Constant -1.148 .897 1.635 1 .201 .317