Supply-Demand StrategyforSystem Optimization and CO
2Emission
Reduction of Stand-alone Hybrid-Renewable Distributed Generation
Yusak Tanoto
Petra Christian University, Electrical Engineering Department, Surabaya 60236, Indonesia
Abstract
Optimization of stand-alone hybrid-renewable power system usually considers the lowest cost of energy. The optimum system configuration for which having the cheapest cost of energy will be suggested into implementation. However, the optimized system is typically valid only for the particular base case condition. It may not be achieved for other specific conditions.This paper presents supply-demand strategy options to enhance system optimization in terms of sizing, cost and energy utilization for stand-alone hybrid-renewable distributed generation as well as CO2 emission reduction. The system complete option consists of a diesel generator, PV module, wind turbine, and battery that supply a village community in Eastern Indonesia with a base of 35 kWh daily and 6.9 kW peak power demands.Simulation involves twosimultaneous scenarios, in which system supplies different loading profile and operating reservevariation.The considered loading profiles are load shifting and valley filling, which are supplied by systems with various operating reserves as percentage power output. It is revealed that the system with 10% PV-Wind turbine operating reserve supplies a load shifting loading pattern shown the least cost of energy with USD 0.369/kWh as well as the highest CO2 emission reduction, amounted 5,5 tons.
Keywords:hybrid-renewable, distributed generation, loading profile, energy utilization, optimization.
1. Introduction
Rural electrification has becoming the important issues in the area of national economic and social development. Studies on technical and economic feasibility have emphasized the opportunity to develop various systems. Development of stand-alone distributed generation system has been entering into the implementation phase in the decade. Depending on the demand requirement, utilization of fully renewable energy or either hybrid-renewable involving fossil fuel resources are technically and economically viable [1]. Several studies reported on the sizing and cost optimization have become the primary trigger to explore further opportunity to lower system cost without sacrificing the system performance in terms of reliability and adaptability.The prior studies related to the system performance improvement have dealt with demand strategy [2, 3]. The loading variation can be directed so that energy being generated can be consumed in an effective way, resulted on the lower cost of energy and increasing renewable energy fraction. Meanwhile, the low energy demand could be increased up to certain level so that the excess energy produced by the system is reduced, eventually resulted on the lower cost of energy.
This paper proposes a supply-demand strategy to optimize system sizing as well as improving system economic performance such as cost of energy, initial cost, total net present cost. Other important issues to be addressed are reduction of fossil fuel utilization in the case of hybrid-renewable system
and improving renewable energy penetration. The last two issues are considered prominent in viewing to the global warming combat due to climate change. The paper is organized as follows: methodology regarding to the required data and analysis method is presented in the next section followed by result and discussion in terms of supply and demand strategy towards system performance improvement. The paper conclusion shall be provided finally.
2. Methodology
The research is conducted on a simulation based using Hybrid Optimization Model for Electric Renewable (HOMER) software developed by the United States National Renewable Energy Laboratory (NREL) [4]. The assessment involves technical as well as economic parameter of the technology. In addition, the necessary data related to the weather conditions are required to be presented into the model.
2.1 Load profile and renewable energy data In this study, determining the appropriate observation site is important since the renewable energy resources should be sufficiently provided to support the system. In this regard, Baa region in Rote Ndao district of East Nusa Tenggara is selected considering that criteria. The site is geographically located on 10°50’ South latitude
and 123°0’ East longitude.The site weather
residential load profile for a community having standard household electricity appliance such as lamps, radio, and television [2]. Considering the fact that it is difficult to direct the load demand into the peak clipping condition, this study used two others load variation i.e. load shifting and valley filling. The typical loading profile for base case and for load shifting as well as valley filling are presented in Fig. 1 to Fig. 3, respectively. Hence, the loading conditions are served as the system demand strategy.
Table 1. Weather conditions in Baa, Rote island
Month
Daily radiation (kWh/m2/d)
Clearness index
Wind speed*
(m/s)
January 5.87 0.532 4.91
February 5.73 0.524 5.13
March 6.25 0.598 3.82
April 6.35 0.667 4.03
May 5.93 0.695 5.00
June 5.52 0.690 5.47
July 5.76 0.701 5.00
August 6.53 0.721 4.19
September 7.21 0.718 3.25
October 7.54 0.704 2.72
November 7.25 0.661 2.82 December 6.41 0.582 3.98 Average 6.366 0.645 4.19
*) Wind speed is measured on 10 meters high an as an average of 10 years satellite measurement
Fig. 1. Daily load profile for base case
Fig. 2. Daily load profile for 30% load shifting
Fig. 3. Daily load profile for 30% valley filling
In the scheme of load shifting, the daily required energy remains constant for 35 kWh. Meanwhile, valley filling has made the daily required energy increases to 43 kWh.The three loading conditions have led the peak load demand for 6.9 kW, 4.8 kW, and 8.9 kW, respectively.
2.2 System configuration and specification
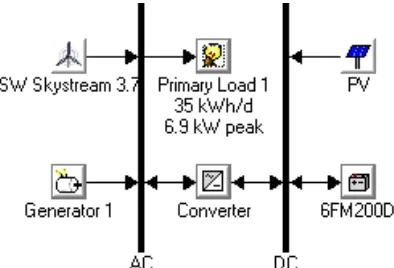
The hybrid power generation system in full configuration options consists of home wind turbine, PV module, diesel generator, converter, and batteries. A Primary load consists of several houses having energy requirement of 35 kWh/d and 6.9 kW peak load demand is connected into the 220 V AC bus. A converter is installed to convert the energy flows from PV and batteries through a 12 V DC bus.
Fig. 4. Full option of hybrid-renewable system
radiation. The power output of the PV by ignoring the effect of temperature is calculated as [4]:
÷÷
G is the solar radiation incident on the PV array in
the current time step (kW/m2), GT,STC is PV cell
temperature under standard test conditions (25 °C). The wind turbine is SW Skystream 3.7. It has a respectively.Maximum power output that can be generated by a wind turbine is based on [5]:
PMax
theoretical maximum power efficiency (0.59). The diesel generator has an estimated operating hour for 15,000 hours with minimum load ratio of 30%. Its fuel curve intercept is 0.05 l/h/kW rated with fuel curve slope of 0.33 l/h.kW output. Given the amount of CO2 emitted is 2.6 kg/l and the fuel price of USD 0.9 per liter,the initial and replacement cost as well as the hourly maintenance cost is USD 300 per kW, USD 260 per kW, and USD 0.04 per hour. The converter initial and replacement cost is both USD 730 per kW. It has an inverter and rectifier efficiency of 90% and 85%, respectively, and is assumed to have 15 years service lifetime.The cost of energy from the generator can be divided into two parts. The first part is the fixed cost of energy which represents the cost per hour of simply running the generator without producing any electricity. The first part is calculated from:
, is the operation and maintenance cost (USD/hour), is the fuel curve intercept coefficient (liter/kWh),
gen
Y is the capacity of generator (kW),
eff fuel C
, is the effective price of fuel (US$/liter).The second part is the marginal cost of energy which represents the additional cost per kilowatt-hour of producing electricity from the generator. This cost is given as in [6]:
, is the effective price of fuel (USD/liter). In order to be able to calculate the system’s net present cost, the system economic parameters are determined as follows:
- Annual real interest rate: 5% - Project lifetime: 25 years
- System fixed capital cost: USD 2,000
The total net present cost is used to represent the life-cycle cost of a system, and is given by [4]:
) the interest rate (%),
proj years. Salvage value is assumed linear depreciation of components and is given by:
where
R is the replacement cost duration (year).
Lastly, the cost of energy is defined as the average cost per kWh of useful electrical energy produced by the system. It is calculated from dividing the annualized cost of producing electricity (the total annualized cost minus the cost of serving the thermal load) with respect to the total useful electric energy production. Since there is no thermal load, the equation for the cost of energy is as follows:
2.3 System’s constraintsand supply strategy System’s constraints are conditions which systems must satisfy. There are one constraint impose to the system, which is maximum annual capacity shortage. It is the maximum allowable value of the capacity shortage fraction, which is the total capacity shortage divided by the total annual electric load. In this study, the constraint is set 0% meaning there will be no capacity shortage. Thus, system can always meet the required load demand.
Operating reserve, which is surplus operating capacity that ensures reliable electricity supply even if the load suddenly increses or renewable power output suddenly decreses, is used as the supply strategy. In this regard, operating reserve variable impose to the supply side include operating reserve as a percent of hourly load, as a percent of wind system must keep enough spare capacity operating to serve the load even if the wind turbine or PV modules output suddenly decreases 40%. As consequence, the higher the percentage of operating reserve for either wind turbine or PV, the possibility of generator will be taking over to
supply the load will be higher. Thus, more cost is needed by the system.
3. Simulation Result and Discussion
Simulation is performed based on the energy balance principle for each system configuration. Electric demand in the hour is compared to the energy that the system can supply in that hour and the flow of energy to and from each component of the system is calculated to determine whether it can meet the electric demand under the specified conditions, and estimates the cost of installing and operating the system over the lifetime of the project. A feasible configuration means it can meet the electric demand under the system constraints and other conditions, and estimates the cost of installing and operating the system over the lifetime of the project. The economic parameters that can be obtained from the cost calculation are initial capital, operational and maintenance cost, total net present cost, and cost of energy. In the case of hybrid system, simulation also calculate the number of hour of which generator generates electricity, amount of fuel used, and renewable energy fraction. The simulations are made into several configuration options adopting the supply-demand strategy which are discussed earlier in the methodology section.
3.1 Supply strategy simulation
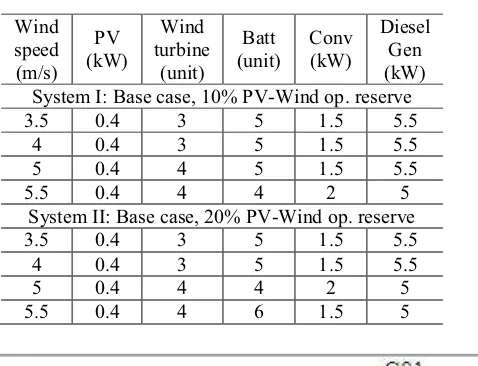
The simulation stage is started with supply strategy. As discussed earlier in the methodology section, operating reserve as percentage of PV and Wind turbine output is considered as supply strategy to optimize system sizing as well as costs. All simulations are performed for base case loading condition. In addition to full system option, a hybrid system without PV module has also considered to be simulated. Simulation result in terms of base case loading optimum sizing and system costs under the supply strategy only are presented in Table 2 and Table 3, respectively.
Table 2. System optimum sizing under supply-strategy System I: Base case, 10% PV-Wind op. reserve
3.5 0.4 3 5 1.5 5.5
4 0.4 3 5 1.5 5.5
5 0.4 4 5 1.5 5.5
5.5 0.4 4 4 2 5
System II: Base case, 20% PV-Wind op. reserve
3.5 0.4 3 5 1.5 5.5
4 0.4 3 5 1.5 5.5
5 0.4 4 4 2 5
System III: Base case, 40% PV-Wind op. Reserve
3 0.4 3 5 1.5 5.5
4 0.4 3 4 1.5 5.5
5 0.4 3 5 1.5 5.5
5.5 0.4 4 4 3 5
System IV: Base case, 10% Wind only op. reserve
3 - 3 6 1.5 5.5
4 - 4 6 1.5 5.5
5 - 4 5 1.5 5.5
5.5 - 4 7 1.5 5
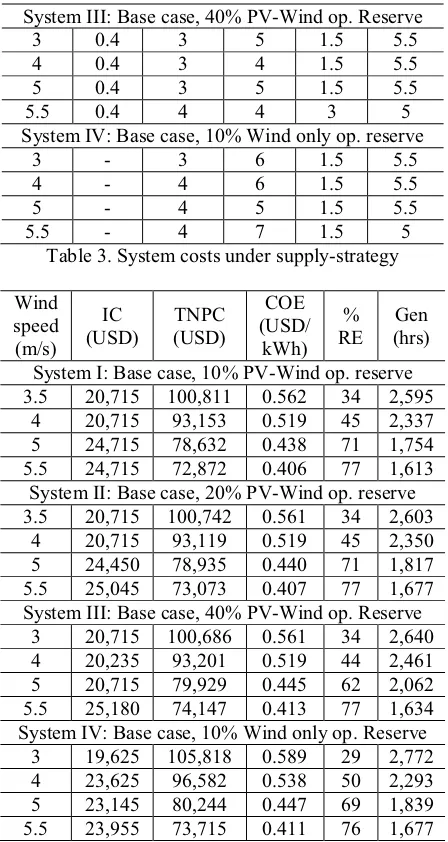
Table 3. System costs under supply-strategy
Wind
System I: Base case, 10% PV-Wind op. reserve 3.5 20,715 100,811 0.562 34 2,595
4 20,715 93,153 0.519 45 2,337 5 24,715 78,632 0.438 71 1,754 5.5 24,715 72,872 0.406 77 1,613
System II: Base case, 20% PV-Wind op. reserve 3.5 20,715 100,742 0.561 34 2,603
4 20,715 93,119 0.519 45 2,350 5 24,450 78,935 0.440 71 1,817 5.5 25,045 73,073 0.407 77 1,677 System III: Base case, 40% PV-Wind op. Reserve
3 20,715 100,686 0.561 34 2,640 4 20,235 93,201 0.519 44 2,461 5 20,715 79,929 0.445 62 2,062 5.5 25,180 74,147 0.413 77 1,634 System IV: Base case, 10% Wind only op. Reserve
3 19,625 105,818 0.589 29 2,772 4 23,625 96,582 0.538 50 2,293 5 23,145 80,244 0.447 69 1,839 5.5 23,955 73,715 0.411 76 1,677
System I with 10% PV-Wind operating reserve is selected as the most optimized system since the cost of energy (COE) and total net present cost (TNPC) is the lowest among others, looking at the fastest wind speed. They acounted for USD 0.406/kWh and USD 72,872, respectively. In addition, System I has shown the highest renewable energy fraction for 0.77 or 77% and the least fuel utilization.
3.2 Supply-demand strategy simulation
System I is used to supply a 30% load shifting and 30% valley filling according to Fig. 2 and Fig. 3, respectively. The optimized sizing as well as economic parameters is presented in Table 4 and Table 5, respectively.
Table 4. System optimum sizing under supply-demand strategy
System A: Load shifting, 10% PV-Wind op. reserve
3.5 0.4 2 3 1 4
4 0.4 3 3 1.5 3.5
5 0.4 4 2 1.5 3.5
5.5 0.4 4 3 1 3.5
System B: Valley filling, 20% PV-Wind op. reserve
3.5 4.5 2 10 2 5.5
4 4.5 3 9 2 5.5
5 0.4 5 9 1.5 5
5.5 0.4 4 6 1.5 5
Table 5. System cost under supply-demand strategy
Wind
System A: Load shifting, 10% PV-Wind op. reserve 3.5 14,940 92, 586 0.517 26 3,841 4 19,155 85,434 0.477 45 3,353 5 22,675 71,787 0.401 73 2,515 5.5 22,790 65,713 0.367 79 2,284 System B: Valley filling, 10% PV-Wind op. reserve
3.5 35,577 117,687 0.533 54 2,304 4 39,097 111,473 0.505 64 2,015 5 30,485 95,590 0.433 73 2,143 5.5 25,045 87,179 0.395 73 2,123
From Table 4 and Table 5, we can see thatSystem A i.e. system supplies a load shifting demand with 10% PV-Wind turbine operating reserve has shown the least COE and the least initial cost (IC) as well as the least TNPC for USD 0.367/kWh, USD 22,790, and USD 65,713, respectively, compared to system supplies a valley filling loading type. In addition, the highest renewable energy fraction is achieved by load shifting as well with 79% for the fastest wind speed. Regarding to the CO2 emission produced by diesel generator, System A is seen to strategy towards a hybrid-renewable stand-alone distributed generation is observed through several simulations using HOMER. The main finding includes the benefit of reducing system’s operating reserve and load shifting as supply-demand strategy in terms of optimized sizing and reducing system costs as well as CO2 emission mitigation.
References
[1] S. Jalilzadeh, H. Kord, A. Rohani, 2010, Optimization and techno-economic analysis of autonomous photovoltaic/fuel cell energy. ECTI Transactions on Electrical Eng., Electronics, and Communications vol. 8, no. 1,118-125.
[2] Y. Tanoto, 2011, Load management effect on optimum sizing of stand-alone hybrid distributed generation. Proceeding Innovation in Design and Technology National Seminar (IDEATech) iSTTS, Surabaya 12 November 2011.
[3] J.A. Razak, K. Sopian, Y. Ali, M.A. Alghoul A. Zaharim, I. Ahmad, 2009, Optimization of PV-Wind-Hydro-Diesel hybrid system by minimizing excess capacity. European Journal of Scientific Research, Vol. 25 No. 4, 663-671.
[4] T Lambert, et.al, 2009,Micropower system modeling with HOMER, integration of alternative source of energy, available at: http://www.pspb.org/e21/media/HOMERMod elingInformation.pdf, downloaded on 24 Aug 2009.
[5] Y. Hongxing, Z. Wei, L. Chengzhi, 2009, Optimal design and techno-economic analysis of a hybrid solar wind power generation system, Applied Energy 86, 163–169.