111
ANTECEDENTS VARIABLE OF EMPLOYEES LOYALTY
Eddy Madiono Sutanto1*, Meiliana Perdana1 1
Business Mangagement Department University Kristen Petra Siwalankerto 121–131 Surabaya 60236, Indonesia *
Corresponding author; Email: [email protected]
Abstract
Employees who have high loyalty will be motivated to work and do their best for the company. This research aims to analyze the influence on satisfaction to the leader, compensation and the work environment against the loyalties of PT. ISS employees in Surabaya. Type of this research is quantitative explanatory. Primary data was obtained from questionnaires which distributed to 150 respondents. Valid questionnaires are up to 95, by type of work, cleaning services and parking, while the rest of employees are not qualified. The Result of this research present that satisfaction to the leader, compensation and the working environment have a positive and significant effect in partially and simultaneously toward employees’ loyalty.
Keywords: Satiscaction to the leader, compensation, working environment and employee loyalties.
Introduction
Employees are an important aspects of a busi-ness and have a substantial influence on the success of a company. Employees with a high level of loyalty are essential for the progress of the company. Marti-wi, dkk (2012) mentioned that loyalty is an important aspect that must be owned by the employee in the work (Fajariani & Surya, 2015). Employees who have high loyalty will be motivated to work and do their best for the company.
On the other side, leader is an important aspect. According to Thoha (2004), the success or failure of an organization depends on the leadership (in Mon-diani, 2012). A good leader should pay attention to the employee prosperity. Therefore employees will work well and have a high loyalty to the company. One of the benefits is often used to develop employ-yees loyalty is compensated (Dwipayoga & Adyani, 2013). Employee’s loyalty to the company or organi -zation depends on the salary provided, if it satisfacto-ry, the employee will be loyal to the company, other-wise, if the benefit awarded is not feasible then the employee’s performance will be decline or even dra -matically decreased. The compensation given by the company to employees can influence employee loyal-ty (Purwaningsih & Noermijati, 2015). Febriani and Indrawati (2013) and Situngkir (2013) mentioned that comfort and cleanliness within working environments is an important factor which can affects employee in completing working assignments (in Suwondo & Su-tanto, 2015). A comfortable and appropriate working environment will encourage employees to work as best as possible, it will smooth the company pro-duction process (Daulay, Maineldi, & Hendriani, 2014). Uncomfortable working environment will cause passiveness on employees.
Employee’s loyalty of PT. ISS Surabaya is re -latively low. Based on the early interview with several employees, there are quite many employees resign from the company and attending work late. It was also found that the relationship between leaders and employees are not harmonious, due to incompatibility among supervisors. Those matters made employees dissatisfied with their leader and choose to resign from the company. Compensation provided by PT. ISS, specifical salaries are already meet the standard of the city minimum wage (UMK), but still, many employees complain regarding the salary received, it turn out smaller due to some deduction such BPJS health and employment and others. Employees also admit the importance of the work environment, when the working area is clean and comfortable, employees will enjoy working. Other problem that occurred was the conflict between colleagues that causes discomfort in the work.
According to Robbins and Judge (2011), there are four factors that will increase employee satisfac-tion:
1) Mentality challenging Profession
Worker prefers the type of profession that able to give an opportunity to use skills and ability in completing varieties assignment also freedom and feedback on workers performance. Those charac-teristics are able to make the job mentally more challenging.
2) Decent rewards
The satisfaction of employees will potentially ap-pear when both reward and promotion policy are fair, no hidden intentions and in accordance with employee expectations, based on the job require-ment, individual skills, and the applicable salary standard.
3) Comfortable working environment
Employes are concerned with a comfortable working environment to facilitate good perfor-mance. Many researchers found that employees like a safe environment. Some other things that are preferred by employees are short distance between residences and working place in clean and modern facilities also well-equipped devices.
4) Supporting Colleague
Many people resigned from a job are not because of money or a real achievement. For most people working is another way to fulfill a necessity of social interaction, therefore it is not surprising when colleague behave friendly each other and mutual support in job satisfaction. Job satisfaction is also determined by the superior behavior, em-ployee satisfaction can be increased when the lea-der is friendly, unlea-derstandable, giving compliment for good performance, good listener and demon-strate personal interest to employees.
Satisfaction against the leader is the pleasant fee-ling that arises through the relationship between the leader and employees in the process of influence, giving instructions and supervision.
The following are indicators of employee satis-faction toward its leader (Robbins & Judge, 2011; Ha-sibuan, 2016)
1. An obedience
The ability of an employee to accepting and execute leader instructions, when employees are satisfied, they will accepting and execute the leader instructions.
2. The relationship with the leader
Any actions were taken by employees having an impact on the relationship with its leader. Accord-ing to Hasibuan (2016) the highest level of satis-faction is when a relationship between both parties is positive.
3. Collaboration with the leader
Employees who have a positive collaboration with the leader will be motivated to work.
Satisfaction is the pleasure feelings that arise due to compensation received, it can be money or stuff, both directly and indirectly by the employees as a re-turn of services which are given to the company. Ac-cording to Mondy (2008), the form of compensations given by the company to employees, divided into two parts, financial compensation and non-financial com-pensation(in Purwaningsih & Noermijati, 2015): 1. Financial Compensation
Compensation awarded to certain employees in the format of money
2. Non-financial Compensation
Compensation awarded to employees as a return of retribution in the format of facilities. This type of compensation distinguished into two, non-financial the job (compensation which related to the job) and non-financial job environment.
The following are indicators of employee satis-faction toward compensation (Hasibuan, 2016; Mangkunegara, 2013; Simamora, 2004):
1. Satisfaction on the salary
The pleasant feeling due to income earned in the format of money as a return of the services pro-vided to the company. It is expected that emplo-yees will be satisfied when earned a larger salary. 2. Satisfaction on the religious holiday allowance
The pleasant feelings caused by the existence of workers rights along with the amount that must be paid by the company before the religious holiday 3. Satisfaction on the pension allowance
The pleasant feeling is caused by an existence of the life insurance program and the amount of it. The program aims to provide the assurance fund for the insured or participants when they reach the pension age and the family or when the insured or participants died.
4. Satisfaction on the health allowance
The pleasant feeling caused by an existence of health benefit also the amount of it, which given by the company to employees.
Satisfaction on the work environment is a plea-sant feeling that is created due to the condition of everything in the work environment. Many resear-chers show that employee’s preferred a safe and com-fortable working environment. According to Se-darmayanti (2009) and Nitisemito (2013), working environment satisfaction indicators are as follows (in Norianggono, Hamid, & Ruhana, 2014)
1. Satisfaction on the cleanliness of the working environment
The cleanliness of the working environment will
create employee’s satisfaction when it clean they
will be happy to do their job
2. Satisfaction on the convenience of the working environment
Employees who feel comfort in the workplace, then they will also feel the satisfaction of doing their job
3. Satisfaction on work environment safety
Safety is important in the workplace. Employees who feel safety in the working environment will feel peace and happy to do their job
4. A good relationship between employees
Tjiptono (2006) opined that employee’s loyalty
to the company may develop responsibility in the work (in Hermawan and Riana, 2014). According to Saydam (in Daulay, Maineldi, & Hendriani, 2014) the
indicators of employee’s loyalty is as follows:
1. Obedience is the ability of employees to obey all regulations valid, to execute all duty given by the superior in charge and does not violate the pro-hibition that has been determined.
2. Responsibility is employees’ capability in comple-ting assignment properly, on time and dare to endure the consequences of a decision or action taken.
3. Dedication is a contribution of idea and energy to the company sincerely.
4. Integrity is employees’ ability to admit, speak or provide the appropriate information in accordance with reality and truth.
Picture 1. The research framework
Sources: Sedarmayanti, 2007 and Nitisemito, 2013 (in Norianggono, Hamid, & Ruhana, 2014); Simamora, 2009; Saydam, 2004 (in Daulay, Maineldi, & Hendriani, 2014); Hasibuan, 2016; Mangkunegara, 2013; Robbins and Judge, 2011.
Research Method
The population in this study were employees of PT. ISS Surabaya who worked on the cleaning ser-vice and parking, total employees are 200 people. Since the subject of this research is loyalty, the used samples are permanent staffs only. The sampling technique used was purposive sampling with criteria three years of service at PT. ISS Surabaya and obtained 95 people only as the total of sample mea-surement.
The technique or method used for data collection is through questionnaire distribution, it consists of questions and statement for respondent to be answer-ed (Sugiyono, 2011). The answeranswer-ed is in Likert scale. Likert scale is a scale to measure attitudes, opinion, and perceptions of a person toward an object or phe-nomenon that occurs in the company (Siregar, 2014).
Data Processing Techniques
Below is the data processing which executed through some test:
1. Validity test
Validity test is to find out the accuracy of the measuring devices that have been developing. The validity of the measuring instrument used in this research is determined in accordance rational analysis on test or questionnaire, which the apprai-sal referes to the theoretical considerations and the measuring intstruments itself (Ghozali, 2013). 2. Reliability test
Reliability refers to the consistency of an instru-ment to measure things from time to time. Re-liability is to discover the result of a measurement. The measurement result is accurate and reliable when there is no difference in the results obtained although it has done twice or more measurements on an object by using the same measuring device (Ghozali, 2013).
3. The classical assumption test
Classic assumption test was done with three test, specifically the normality test, Multicollinearity and Heteroskedasticity test. The normality test is to determine whether the distribution of the variables is normal or close to normal. The Multi-collinearity test aims to test whether the regression model is found in the correlation between inde-pendent variables and The Heteroskedasticity test is to discover the difference of variance of residual inequality from one observation to another.
Data analysis techniques in this research are: 1. Descriptive Analysis of Variables Research
This analysis used two types of measurements. There are Meanand Interval Scale. Mean is used to discover the average frequency of respondents’ feedbacks against each question. Interval scale is the scale of the scores awarding on the object which has the quality of ordinal and same distance or interval.
2. Multiple Linear Regression Analysis
The analysis is used to discover the influence of the independent variables with the same de-pendent variable.
Consisted of t-test to indicate the influence of an independent variable individually, f-test is to indi-cate the influence of an independent variable against dependent variable simultaneously. Coeffi-cient determination test is beneficial to measuring the ability of the model to explain the independent variable variations.
The Definition of Operational Variable
Satisfaction on the Supervisor (X₁) is a pleasant feeling in the process of influencing and providing guidance and supervision that arise from the relation-ship between the leader and employees. This variable is measured through by several indicators:
1. The obedience to the leader 2. Relationship with the leader 3. Collaboration with the leader
Satisfaction on the compensation (X₂) Satisfac-tion is the pleasant feelings that arise due to compen-sation received, it can be money or stuff, both directly and indirectly by the employees as a return of services which are given to the company. The indicators used to measure satisfaction on compensation are as fol-lows:
1. Satisfaction on the salary/income
2. Satisfaction on the religious holiday allowance 3. Satisfaction on the pension allowance
4. Satisfaction on the health allowance
Satisfaction on the working environment (X₃) is a pleasant feeling due to the condition of everything in the work environment. The indicators used to mea-sure satisfaction on the work environment are as fol-lows:
1. Satisfaction on the cleanliness of the working environment
2. Satisfaction on the convenience of the working environment
3. Satisfaction on the work environment safety 4. A good relationship between employees
Employee loyalty (Y) is when the facilities earned by employees are satisfied, fulfilled, and com-fortable. Then the employee will work their best and loyal to the company. The indicators used to measure satisfaction on the work environment are as follows: 1. Obedience
2. Responsibility 3. Dedication 4. Integrity
Result and Discussions
Descriptive Analysis of the Research Variables
The data obtained from the scale number 1 to 5, will be used to measure or to observe the reaction of
respondents about the satisfaction of leader, com-pensation, the work environment, and employee lo-yalties. The reaction of respondents about each varia-ble will be measured by using the following formula:
Interval Kelas= (5 - 1) / 3 = 1.3
Class interval 1.3 means 1.00–2.30 classified as a low category; 2.31–3.60 classified as a medium category; 3.61–5.00 classified as a high category. The average value for the leader satisfaction is 3.10 and it classified as a medium category. This can be hap-pened because of the way of the leader is too harsh in giving assignments, many rules or captious, all these things trigger the employees being passive. The high-est mean score is 3.20 indicates a good communica-tion with superiors, which means there are good com-munications between employees and the leader. The lowest mean value is 2.95, indicates that employees are obeying orders given by the leader, which means low satisfaction on the leader.
The medium score for the satisfaction on salary variable is 3.06. It classified in a medium category. This is caused by low salary received by employees. The highest mean score is 3.24, indicates employees satisfaction on religion holiday allowance awarded by the company. The lowest mean value is 2.87, indi-cates the salary awarded by the company.
The average score in the variable satisfaction on the work environment is 3.38 classified as a medium category. This is caused by employees sense of bored on the work environment. Employees working as a cleaning service will always work indoor, while park-ing management always works in the parkpark-ing lot or basement, it makes employees feel uncomfortable. The highest mean value is 3.87 indicates that em-ployees have a good relationship with colleagues. The lowest mean value is the variable of employee feel comfortable working for the company is 2.93 which means that employees dissatisfied and uncomfortable with the working environment.
The average score on the working environment is 3.02 classified as a medium category. The highest mean value is 3.17 indicates that employees complete the work as the leader instructions. The lowest mean value is 2.92 indicates that employees reporting if there is any damage to the facilities in the workplace because of the employees and inform the supervisor when absent.
Validity Test
Validity test used to measure the validity of a questionnaire made. The method used is a compari-son between r counts (value of Pearson correlation) with r table, when r countspositive and r counts > r
Tabel 1
The Validity Test Result on Satisfaction towards the Leader
Variable Indicator rcounts rtable Remarks
Satisfaction X1.1 0.866 0.202 Valid
on X1.2 0.851 0.202 Valid
The Leader X1.3 0.714 0.202 Valid
(X1) X1.4 0.878 0.202 Valid
Table 2
The Validity Test Result towards Compensation Satis-faction
Variable Indicator rcounts rtable Remarks
X2.1 0.811 0.202 Valid
X2.2 0.697 0.202 Valid
Satisfaction X2.3 0.854 0.202 Valid
on the X2.4 0.777 0.202 Valid
Compentation X2.5 0.896 0.202 Valid
(X2) X2.6 0.848 0.202 Valid
X2.7 0.890 0.202 Valid
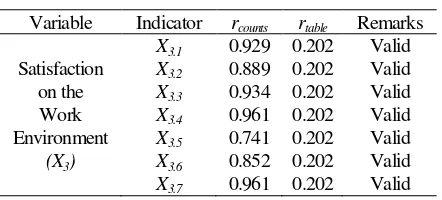
Tabel 3
The Validity Test Result towards Satisfaction on the Work Environment
Variable Indicator rcounts rtable Remarks
X3.1 0.929 0.202 Valid
Satisfaction X3.2 0.889 0.202 Valid
on the X3.3 0.934 0.202 Valid
Work X3.4 0.961 0.202 Valid
Environment X3.5 0.741 0.202 Valid
(X3) X3.6 0.852 0.202 Valid
X3.7 0.961 0.202 Valid
Table 4
The Validty Test Result towards Employee Loyalties
Variable Indicator rcounts rtable Remarks
Y1.1 0.706 0.202 Valid
Y1.2 0.762 0.202 Valid
Y1.3 0.839 0.202 Valid
Employees Y1.4 0.740 0.202 Valid
loyalty Y1.5 0.804 0.202 Valid
(Y) Y1.6 0.506 0.202 Valid
Y1.7 0.509 0.202 Valid
Y1.8 0.559 0.202 Valid
From Table 1, it can be seen in the statement of satisfaction on the leader (X₁) is greater than rtable
value (0.202). It can be concluded that the entirety statement on the leader satisfaction variables (X₁) are valid. From Table 2 it can be seen in the statement of compensation satisfaction (X2) is greater than rtable
value (0.202). It can be concluded that the entirety statement on the compensation satisfaction variables
(X2) are valid. Meanwhile, from Table it can be seen
in the statement of satisfaction on the work environ-ment (X3)is greater than rtable value (0.202). It can be
concluded that the entirety statement of satisfaction on the work environment variable (X3)are valid.
Further-more, each statement on employee loyalties variable
(Y) is greater than rtable value (0.202) as seen in Table
4. It can be concluded that the entirety statement of employee loyalties variable (Y) is valid.
Reliability Test
Relibility test used to evaluate the consistency of the research instruments. This testing is done by ob-serving the value in the column of Cronbach’s Alpha. When the value of Cronbach’s Alpha > 0.7 it means the point or variable is reliable.
Tabel 5
Reliability Test
Variable Crisis Point
Cronbach's
Alpha Remarks Satisfaction on he Leader
(X1) 0.7 0.844 Reliable
Satisfaction on the Compensation (X2)
0.7 0.922 Reliable
Satisfaction on the Work
Environment (X3) 0.7 0.958 Reliable
Employee Loyalties (Y) 0.7 0.855 Reliable
Table 5 shows that statement in the question-naire which consists of four variable which is satis-faction on the leader, satissatis-faction on the compensa-tion, satisfaction on the work environment and emplo-yee loyalties are reliable since Cronbach’s alpha va-lue is greater than 0.7.
Normality Test
Picture 2. Normality test on p-plot graphic
Multicollinearity Test
Multicollinearity test aims to find the perfection of correlation between independent variable. Mul-ticollinearity test results based on the value of Tole-rance dan Variance Infating Factor (VIF), when the value of tolerance > 0.1 and VIF <10. This means that multicollinearity does not happen in a regression model (Santoso, 2002).
Table 6
Multicollinearity Test
Variable
Collinearity
Statistics Remarks Tolerance VIF
Satisfaction on the Leader (X1)
0.430 2.328 Non
Multicollinearity Satisfaction on the
compensation (X2)
0.375 2.667 Non
Multicollinearity Satisfaction on work
environment (X3)
0.558 1.791 Non
Multicollinearity
From Table 6, it is known that VIF value from the three variables is smaller than 10. It can be con-cluded that there is no correlation between variable satisfactions on the leader (X1), satisfaction on
com-pensation (X2) and satisfaction on the work
environ-ment (X3).
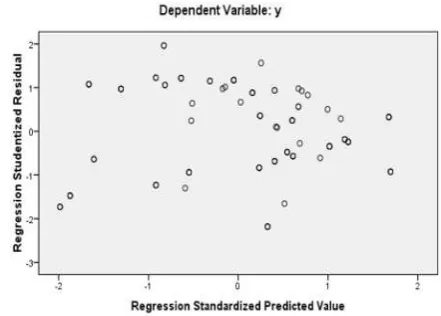
Heteroskedasticity Test
Heteroskedasticity test aims to find the equiva-lence or nonequivaequiva-lence of a variance from one obser-vation residue to another, if there is no equality, it means no problem. Heteroskedasticity Test is per-formed by observing to the dots spread with no pat-tern, above and below the zero on the Y axis on a scatterplot, there is no heterokedastistas in linear re-gression.
Picture 3. Heteroskedasticity test
On the scatterplot graph shows that data is spread above and below 0 (zero) number on the Y axis and there is no abvious pattern in a spread of the data. This means there are no heterroskedastisitas on regression equation model.
The Analysis of Multiple Linear Regression
Multiple linear regression model was used to describe the influence of independent variable against constrained variable by creating multiple linear re-gression line equation. Multiple linear rere-gression analysis in this research is to find the influence bet-ween the satisfaction on the leader, compensation and work environment against employee loyalties. Based on the result SPSS Program (Statistical Package for Social Science) version 22.0, the pattern of a regres-sion model is as follows:
Y = 0,691 + 0,356X1 + 0,288X2 + 0,104X3
Notes:
Y = Employee loyalties Variable
X1 = Satisfaction on the Leader Variable
X2 = Satisfaction on Compensation Variable
X3 = Satisfaction on the Work Environment
Varia-ble
Table 7
Regresion Model
Model Regression Coeficient
Constants 0.691
Satisfaction on the Leader 0.356 Satisfaction on Compensation 0.288 Satisfaction on Work Environment 0.104
Based on Table 7, found that satisfaction on the leader (X1) variable, satisfaction on compensation (X2)
variable and satisfaction on the work environment
employ-yee’s loyalty (Y). In this case when satisfaction on the leader (X1) variable is high, then employees will be
loyal to the company. When satisfaction on compen-sation (X2) variable is suitable as employee’s ex
pecta-tion, then employees will be loyal to the company. When satisfaction on the work environment (X3)
va-riable is high, it means employees are comfortable in working and do not consider to move to others com-pany.
Result of t-test
t-test is used to find the influence of one indivi-dually independent variable in explaining variation in the dependent variable, in this case is to find whether satisfaction on the leader (X1), satisfaction on
compen-sation (X2) and satisfaction on the work environment
(X3), partially effect significantly to employee’s loyal
-ty (Y). Based on the result SPSS Program (Statistical Package for Social Science) version 22.0, the result of a partial test is as follows:
Table 8 t-test
Independent
Vaiable B Std. Error Beta t Sig. Satisfaciton on the
Leader 0.356 0.082 0.397 4.339 0.000 Satisfaction on
Compensation 0.288 0.084 0.336 3.426 0.001 Satisfaction on the
work nvironment 0.104 0.045 0.188 2.340 0.021
It is shown in Table 8, the significant value of
tcounts on satisfaction on the leader, compensation and
work environment showed significant value, is below 0.05. It can be concluded that satisfaction on the lea-der, compensation and work environment has a signi-ficant influence on employee’s loyalty (Y). This result supports the previous research by Safitri (2015) that
suggested employees’ satisfaction on compensation affected their loyalty.
Result of F-test
F-test aims to find the satisfaction on the leader
(X1), satisfaction on compensation (X2), and
satisfac-tion on the work environment (X3) have a positive
in-fluence simultaneously on employee loyalty. Based on the result SPSS Program (Statistical Package for Social Science) version 22.0, the result of a partial test is shown in Table 9.
Based on Table 9, it is found that the signifi-cance value of Fcounts is 0.000, this value is smaller
than 0.05. The hypothesis results show that H0-3 is
rejected and Ha-3 isaccepted. It can be concluded that
the satisfaction on the leader (X1), satisfaction on
compensation (X2) and satisfaction on the work
envi-ronment (X3) have significant influence
simultaneous-ly on employee loyalty (Y).
Table 9 F-test
Fcounts Significance Remarks
62.290 0.000 Influence
Coeficient Determination Test (R2)
Based on Table 10, it can be seen that the re-gression result produce a multiple correlation values (R) of 0.820, which means there is a close connection between satisfaction on the leader (X1), satisfaction on
compensation (X2) and satisfaction on the work
envi-ronment (X3) to employee loyalty. The regression
re-sult indicate that the coefficient of multiple determi-nation (R2) is equal to 0.673, this means that employ-yee loyalty is influenced by satisfaction on the leader, compensation and work environment is 67.3%, mean-while the rest of 32.7% is influenced by others factor out of the research such as discipline, work motiva-tion, etc.
Table 10
The Result of Coeficient Determination Test (R2)
R R2
0.820 0.673
According to employees, the most satisfactory compensation is the holiday religion allowance, in ad-dition to the amount that is satisfactory and acceptable in every year, also due to the employees needed for Eid, while the most unsatisfactory are pension allow-ance since it can be withdrawn after the age of 56 years.
Conclussions and Implications
perform-ance by providing the facilities, fulfill their needs, pay attention to their future security and provide opportu-nities, those will support the company to grow and be-come better in the future.
Employee compensation should be increased, especially salaries. It can satisfy employees and raise the spirited at work, for example coming to work on time, willing to work overtime and finish every as-signment on time.
The result of this research showed that satisfac-tion on the work environment has the smalles influ-ence on employee loyalty. The company should pro-vide comfort to employees, for example by keeping the work environment clean because it influence em-ployee to work well, creating a comfortable atmos-phere in the workplace, establish a team that aims on collaboration and interaction between employees.
References
Daulay, I. N., Maineldi, A., & Hendriani, S. (2014). Pengaruh kompensasi dan lingkungan kerja ter-hadap loyalitas karyawan pada PT. Jatim Jaya Perkasa Kebun Banjar Balam Indragiri Hulu.
Jurnal Online Mahasiswa Fakultas Ekonomi, 1(2), 1–15.
Dwipayoga, W. & Adnyani, D. (2013). Pengaruh Lingkungan Kerja Fisik, Kepemimpinan, Dan Kompensasi Terhadap Loyalitas Karyawan Pada PT. Gino Valentino Bali. E-Jurnal Ma-najemen Universitas Udayana, 2(2), 137–152. Fajariani, E. & Surya, K. (2015). Pengaruh
peng-alaman kerja dan kepemimpinan transforma-sional terhadap loyalitas karyawan. E-Jurnal Manajemen Universitas Udayana, 4(4), 930– 942.
Ghozali, I. (2013). Aplikasi analisis multivariat dengan program IBM SPSS. Semarang: Universitas Di-ponegoro.
Hasibuan, M. S. P. (2016). Manajemen sumber daya manusia. Edisi revisi kesembilan belas, Bumi Aksara Group, Bandung.
Hermawan, I. K. A. & Riana, I. G. (2014). Analisis faktor-faktor yang menentukan loyalitas karyawan
pada PT. Inti Buana Permai Denpasar Bali. E-Jurnal Manajemen Universitas Udayana, 3(3), 624–643.
Mangkunegara, A. P. (2013). Manajemen sum-ber daya manusia perusahaan. Bandung, PT. Remaja Rosdakarya.
Mondiani, T. (2012). Pengaruh kepemimpinan trans-formasional dan kompensasi terhadap kinerja karyawan PT. PLN (PERSERO) UPJ Sema-rang. Jurnal Administrasi Bisnis, 1(1), 46–54. Norianggono, P., Hamid, D., & Ruhana, I. (2014).
Pengaruh lingkungan kerja fisik dan non fisik terhadap kinerja karyawan (Studi pada karyawan PT. Telkomsel Area III Jawa-Bali Nusra di Surabaya). Jurnal Administrasi Bisnis (JAB), 8(2),1–10.
Purwaningsih, U. & Noermijati. (2015). Pengaruh kompensasi finansial dan non finansial terhadap kepuasan kerja dan loyalitas kerja karyawan (Studi pada karyawan Hotel Pelangi Malang, Jawa Timur). Jurnal Ilmiah FEB Universitas Brawijaya, 3(2), 1–15.
Robbins, S. P. & Judge, T.A. (2011). Organizational Behavior, Edisi Keempat Belas. New Jersey, Prentice Hall Inc.
Safitri, R. (2015). Pengaruh kompensasi terhadap loyalitas karyawan PT. Putera Lautan Kumala Lines Samarinda. E-Journal Administrasi Bisnis,
3(3), 650–660.
Simamora, H. (2004). Manajemen sumber daya manu-sia, Edisi Ketiga. Yogyakarta: STIE YKPN. Santoso, S. (2002). Buku latihan spss statistik
multi-variate. Jakarta: Elex Media Camputindo. Siregar, S. (2014). Statistik parametrik untuk
pene-litian kuantitatif. Jakarta: Bumi Aksara.
Sugiyono (2011). Metode penelitian pendidikan pen-dekatan kuantitatif, kualitatif, r&d. Bandung: Alfabeta.
Suwondo, D. I. & Sutanto, E. M. (2015). Hubungan lingkungan kerja, disiplin kerja, dan kinerja kar-yawan. Jurnal Manajemen dan Kewirausahaan,