FINAL PROJECT
–
TI 141501
BENEFIT-COST ANALYSIS TO EVALUATE
ALTERNATIVE TECHNOLOGIES FOR
VALUE-ADDED SERVICES IN WAREHOUSE
VINCENTIUS KAISAR VISHNU
NRP 2513 100 055
Supervisor
Prof. Ir. I Nyoman Pujawan, M.Eng., Ph.D., CSCP
NIP. 196901071994121001
Department of Industrial Engineering
Faculty of Industrial Technology
Institut Teknologi Sepuluh Nopember
Surabaya
APPROVAL SHEET
BENEFIT-COST ANALYSIS TO EVALUATE ALTERNATIVE
TECHNOLOGIES FOR VALUE-ADDED SERVICES IN
WAREHOUSE
FINAL PROJECT
Proposed as a Requisite to Graduate in Industrial Engineering Major and to Achieve a Bachelor Degree in Department of Industrial Engineering
Faculty of Industrial Technlogy Institut Teknologi Sepuluh Nopember
Surabaya
Author:
VINCENTIUS KAISAR VISHNU NRP. 2513 100 055
Approved by, Final Project Supervisor
Prof. Ir. I Nyoman Pujawan, M.Eng., Ph.D., CSCP NIP. 196901071994121001
i
BENEFIT-COST ANALYSIS TO EVALUATE ALTERNATIVE
TECHNOLOGIES FOR VALUE-ADDED SERVICES IN
WAREHOUSE
Name : Vincentius Kaisar Vishnu Student ID : 2513 100 055
Supervisor : Prof. Ir. I Nyoman Pujawan, M.Eng., Ph.D., CSCP
ABSTRACT
Improved technology along with emerged international policies lead to a phenomenon called globalization. This phenomenon increases competitiveness in all industrial sectors, as well as in logistics. One of Indonesian private companies who provide logistics service is Kamadjaja Logistics. One of warehouses owned by Kamadjaja Logistics is located in Surabaya. Besides warehousing service, the warehouse provides value-added services; such as taping and labeling. The sequences of taping process are bundling, taping, and finishing which are done manually by 89 direct labors.
Due to the slow operation and high labor cost of manual taping process, then several automation technologies are proposed. This research is focused to improve performance of taping service provided by Kamadjaja Logistics in such a way that it can achieve faster processing time and reduced cost by increasing resources efficiency through implementation of automation technology. Stopwatch time study approach is conducted to measure standard time of manual taping process. Then, automated technologies are assessed by using benefit-cost analysis. Sensitivity analysis is also conducted to accommodate uncertainty factors. The result is EntrePack Automatic SW-1713 L-Bar Shrink Wrap Machine (Alternative 1) is the best solution by delivering additional benefit of IDR 129.71 per bundle and reduces cost of IDR 20.92 per bundle.
ii
iii
ACKNOWLEDGEMENT
Praise to the Lord for His abundance blessings and miracles which enable the author to successfully accomplish this final project entitled “Benefit-Cost Analysis to Evaluate Alternative Technologies for Value-Added Services in Warehouse” just in time. This final project is composed as a requisite to achieve a Bachelor degree in Industrial Engineering Department of Institut Teknologi Sepuluh Nopember. Along the study processes, the author faces many challenges and difficulties. However, the author receives help, motivation, and support from many parties. Here, the author would like to express the most sincere gratitude to:
1. The beloved parents, Vishnu Danardhono and Maria Marisa Hosbach; the kindest sister, Maria Pesona Nuansa; and the entire author’s family who always give support and prayers to the author.
2. Prof. Ir. I Nyoman Pujawan, M.Eng., Ph.D., CSCP, as author’s final project supervisor who has guided the author patiently and wisely.
3. Dody Hartanto, MT. and Diesta Iva Maftuhah, MT., as both research proposal and final project defense examiners, whose positive recommendations have improve the quality of this research.
4. H. Ir. Hari Supriyanto, MSIE., as author’s guardian lecturer who has guided and helped the author patiently every semester.
5. All lecturers and academic staffs of Industrial Engineering Department of Institut Teknologi Sepuluh Nopember, who shared their knowledge and experiences to the author. Their helps are highly appreciated.
6. Mr. Erith, Mr. Yudi, Mr. Djoni, and all staffs of Kamadjaja Logistics’ warehouse who have directed and helped the author in understanding and improving the research.
7. Anastasia Rosarianti Suryo, who has raised the author’s spirit through motivation, prayers, gifts, and surprises. Thank you for your patience. 8. All Fairy Squad members, Mas Doni, Mas Erza, Mbak Lila, Mbak Nana,
iv
Sarah, Olak, Castor, Faldy, Aza, Bella, Ago, Satria, Dhea, and Sebby, for the togetherness and cheerfulness.
9. Fellows in Himpunan Mahasiswa Teknik Industri ITS 2014/2015 and 2015/2016, who have given many valuable experiences during author’s college life.
10.Staffs, part-timers, and volunteers of ITS International Office, who have developed the author through professional activities.
11.Fellas in International Class 2013, who have gone together with the author through lectures, assignments, and exams.
12.Cyprium, Industrial Engineering students class of 2013, for the cheerfulness and supports during college life.
13.Everyone else who has not been mentioned.
The author recognizes that this research is far from perfection. Constructive suggestions and critics will be highly appreciated. May this research deliver usefulness for both academic and practical world.
Surabaya, January 2017
v
TABLE OF CONTENTS
ABSTRACT ... i
ACKNOWLEDGEMENT ... iii
TABLE OF CONTENTS ... v
LIST OF TABLES ... ix
LIST OF FIGURES... xi
CHAPTER I INTRODUCTION ... 1
1.1 Research Background ... 1
1.2 Problem Formulation ... 3
1.3 Research Objectives ... 4
1.4 Research Benefits ... 4
1.5 Research Scope ... 4
1.5.1 Limitation ... 4
1.5.2 Assumption ... 4
1.6 Report Outline ... 5
CHAPTER II LITERATURE REVIEW ... 7
2.1 Warehouse Management ... 7
2.2 Fast Moving Consumer Goods ... 8
2.3 Time Study ... 8
2.3.1 Stopwatch Time Study ... 8
2.3.2 Work Sampling ... 9
2.4 Review of Automation Technology ... 9
2.4.1 EntrePack Automatic SW-1713 L-Bar Shrink Wrap Machine ... 10
vi
2.4.3 Prometica Sleeve Wrapping Heat Sealing Machine ... 11
2.4.4 Comparison of Automation Technologies ... 11
2.5 Benefit-Cost Analysis ... 12
2.5.1 Benefit Assessment... 13
2.6 Sensitivity Analysis ... 14
2.7 Previous Research ... 14
CHAPTER III RESEARCH METHODOLOGY ... 17
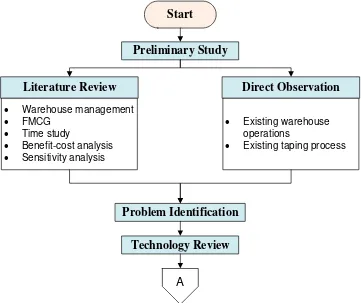
3.1 Preliminary Study ... 17
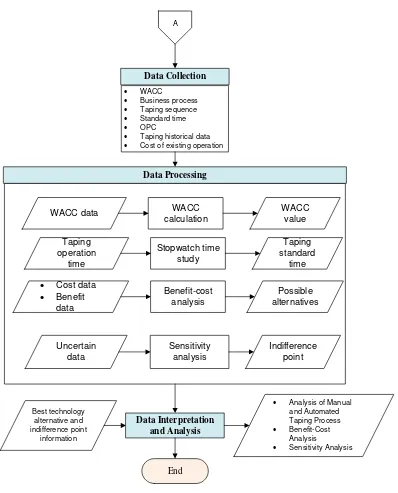
3.2 Data Collection Phase ... 19
3.3 Data Processing Phase ... 19
3.3.1 WACC Calculation ... 19
3.3.2 Benefit-Cost Analysis ... 19
3.3.3 Sensitivity Analysis ... 20
3.4 Data Interpretation and Analysis Phase ... 20
CHAPTER IV DATA COLLECTION AND PROCESSING ... 21
4.1 Data Collection ... 21
4.1.1 Weighted Average Cost of Capital ... 21
4.1.2 Business Process Mapping of Taping Process ... 22
4.1.3 Stopwatch Time Study of Manual Taping Process ... 23
4.1.4 Operation Process Chart of Manual Taping Process ... 30
4.1.5 Demand Forecasting of Taping Process ... 32
4.2 Data Processing ... 34
4.2.1 Cost Calculation of Manual Taping Process ... 34
4.2.2 Cost and Benefit Calculation of Automated Taping Process ... 39
4.2.3 Incremental Benefit-Cost Analysis ... 55
vii
CHAPTER V ANALYSIS AND INTERPRETATION ... 59
5.1 Analysis of Manual Taping Process ... 59
5.2 Analysis of Automated Taping Process ... 60
5.3 Benefit-Cost Analysis ... 61
5.4 Sensitivity Analysis ... 62
CHAPTER VI CONCLUSION AND SUGGESTION ... 63
6.1 Conclusion ... 63
6.2 Suggestion ... 63
REFERENCES ... 65
viii
ix
LIST OF TABLES
Table 2. 1 Comparison of Proposed Automation Technologies ... 11
Table 2. 2 Comparison of Previous Researches and Current Research ... 14
Table 4. 1 Operations and Working Elements of Manual Taping Process ... 23
Table 4. 2 Recapitulation of Manual Taping Process Measurement ... 24
Table 4. 3 Summary of Uniformity Test ... 27
Table 4. 4 Recapitulation of Adequacy Test Calculation ... 28
Table 4. 5 Westinghouse Rating System... 29
Table 4. 6 Recapitulation of Performance Rating ... 29
Table 4. 7 Recapitulation of Normal and Standard Time (second)... 30
Table 4. 8 Annual Data of Actual Taping Output ... 33
Table 4. 9 Demand Forecasting of Taping Process... 33
Table 4. 10 Projected Cash Flow of Manual Taping Process (in IDR)... 37
Table 4. 11 NPV Calculation of Manual Taping Process (in IDR) ... 39
Table 4. 12 Projected Cash Flow of Alternative 1 (in IDR) ... 43
Table 4. 13 NPV Calculation of Alternative 1 (in IDR) ... 45
Table 4. 14 Projected Cash Flow of Alternative 2 (in IDR) ... 48
Table 4. 15 NPV Calculation of Alternative 2 (in IDR) ... 50
Table 4. 16 Projected Cash Flow of Alternative 3 (in IDR) ... 53
Table 4. 17 NPV Calculation of Alternative 3 (in IDR) ... 55
Table 4. 18 Annual Worth of Manual and Automated Alternatives (in IDR) ... 55
Table 4. 19 Data of Cost per Unit and Benefit per Unit (in IDR) ... 56
Table 5. 1 Cost Proportion of Automated Alternatives (in IDR) ... 60
x
xi
LIST OF FIGURES
Figure 1. 1 Breakdown of Indonesian Logistics Cost ... 2
Figure 2. 1 EntrePack Automatic SW-1713 L-Bar Shrink Wrap Machine ... 10
Figure 2. 2 Gramegna Model ECO 2000 Shrink Bundler ... 10
Figure 2. 3 Prometica Sleeve Wrapping Heat Sealing Machine ... 11
Figure 3. 1 Flowchart of Research Methodology... 17
Figure 3. 2 Flowchart of Research Methodology (cont’d) ... 18
Figure 4. 1 Business Process of Taping Process ... 22
Figure 4. 2 Uniformity Test of Operation 1 (First Iteration)... 25
Figure 4. 3 Uniformity Test of Operation 2 (First Iteration)... 25
Figure 4. 4 Uniformity Test of Operation 2 (Second Iteration) ... 26
Figure 4. 5 Uniformity Test of Operation 3 (First Iteration)... 26
Figure 4. 6 Uniformity Test of Operation 3 (Second Iteration) ... 26
Figure 4. 7 Operation Process Chart of Manual Taping Process ... 31
Figure 4. 8 Operation 1: Bundling ... 31
Figure 4. 9 Operation 3: Finishing ... 32
Figure 4. 10 Demand Forecasting of Taping Process ... 33
Figure 4. 11 Table and Chair for Manual Taping Process ... 35
Figure 4. 12 Sensitivity Analysis for Direct Labor Cost ... 58
Figure 4. 13 Sensitivity Analysis for Material Cost ... 58
xii
1
CHAPTER I
INTRODUCTION
This chapter is essential in introducing the initial stages of research. Introduction consists of research background, problem formulation, objectives, benefits, scope of research, and report outline.
1.1 Research Background
Improved technology along with emerged international policies lead to a phenomenon called globalization (Pettinger, 2013). Improved technology covers both intangible and tangible technologies. For examples, intangible technology is information technology such as internet; while tangible technology is in the form of mechanical such as machine, vehicle, etc. Furthermore, most of countries made policies and agreements that ease the process of goods and services flows among countries. This leads into interdependency among countries and the speed up of globalization process. Due to the reduced barriers and supportive technologies in the industry, the competitiveness is undoubtedly increasing (Mohaghegh, 2016). Slack et al in Gunasekaran et al (2001) suggest several factors that can attract customers and become competitive advantage; those are cost, quality, speed of delivery (response time), and flexibility. Moreover, innovation and sustainability are also potential to become competitive advantage.
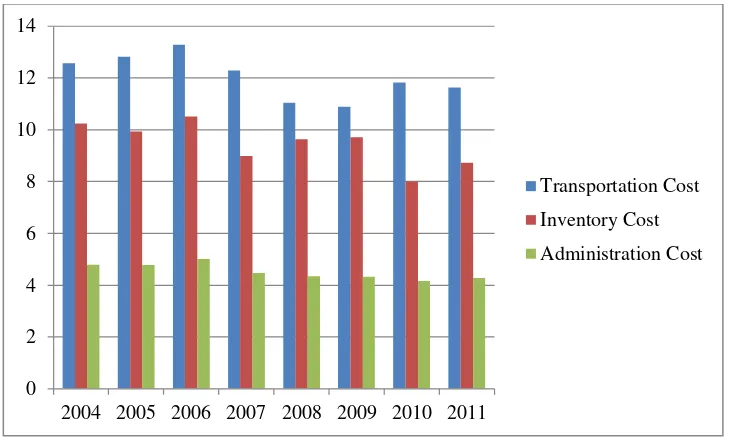
Competitiveness occurs in all industrial sectors, as well as in logistics. According to Eurocham Annual Position Paper (2013), logistics costs in Indonesia are calculated to almost 26% of national GDP. Breakdown of Indonesian logistics cost is shown in Figure 1.1. Along the years, inventory cost steadily contributes at least one-third of total logistics cost. This condition challenges Indonesia’s companies who provide warehousing service (inventory) to be both efficient and keep competitive.
2
Figure 1. 1 Breakdown of Indonesian Logistics Cost (Bahagia, Sandee, & Meeuws, 2013)
As daily needs, FMCG contribute a large portion of consumers’ budget in every country, where high quality and low cost become the main preference (Çelen, Erdogan, & Taymaz, 2005). According to those conditions, fast moving consumer goods are classified into functional product. Some characteristics of functional product are predictable demand and low profit margin (Susman, 2004). Along with population growth, demands of fast moving consumer goods are increasing progressively. However, warehouse’s capacity is already fixed and improvement is needed to handle this situation. Application of mass production will help to achieve higher profit margin. Also in response to both issues, the FMCG manufacturer should implement efficient supply chain strategy where Kamadjaja Logistics takes part there.
0
2004 2005 2006 2007 2008 2009 2010 2011
Transportation Cost
Inventory Cost
3
Purpose of efficient supply chain strategy is to manage material flow to minimize inventories and especially maximize efficiency in the chain (Li, 2007). Moreover, efficient supply chain strategy is suitable in achieving low-cost operation and on-time delivery. This strategy is appropriate to be implemented in the warehouse which has several inventory issues; such as overload capacity, dealing with massive scale of products, inaccurate inventory data, and many material flow processes (inbound and outbound) on a daily basis.
Running efficient supply chain strategy alone is not enough. The aid of sophisticated technologies in warehouse can significantly solve inventory issues experienced by Kamadjaja Logistics. However, the available technologies also vary enormously based on warehouse’s needs and targeted objectives. This leads to the need of customization and large investment. In this case, automation technology is proposed as the possible alternative to solve these issues. Implementation of the right automation technology will reduce human operators needed and make processes’ time faster as well (Lamb, 2013).
This research is focused to improve performance of value-added services provided by Kamadjaja Logistics in such a way that it can achieve faster process time and reduced cost by increasing resources efficiency through implementation of automation technology. Possible automation technologies are proposed in order to solve difficulties in value-added services. Then, every alternative of possible automation technologies is evaluated by using benefit-cost analysis approach. Effects of automation technology implementation to warehouse performance are also measured in attempt to determine the best investment decision.
1.2 Problem Formulation
4
1.3 Research Objectives
Several objectives are arranged prior to this research. Those objectives are as follow.
To identify existing condition and develop alternatives of automation technology for value-added service which suitable to the needs of Kamadjaja Logistics.
To determine the best alternative of automation technology by using benefit-cost analysis approach and its impact on warehouse performance.
1.4 Research Benefits
The following benefits are expected to be obtained from this research; those are as follow.
Company will understand automation technologies for value-added services which are suitable to improve current warehouse performance.
Company will has sufficient information before investing on automation technology.
Company will be able to reduce human operators needed and has faster response time by implementing automation technology.
1.5 Research Scope
In keeping the research reliable and valid, some limitations and assumptions are specified prior to the research.
1.5.1 Limitation
This research is considered to be reliable under a limitation. The limitations are as follow.
Warehouse of Kamadjaja Logistics that is observed is one of warehouses located in Surabaya.
Opportunity cost is not included in the calculation.
1.5.2 Assumption
5
Currency of USD 1 is equal to IDR 13,500.
Currency of GBP 1 is equal to IDR 16,875
Currency of EUR 1 is equal to IDR 13,970
Inflation rate in Indonesia is 5%.
1.6 Report Outline
In order to show the big picture of this research, brief explanation of report outline is described as follows.
CHAPTER I: INTRODUCTION
The initial chapter covers research background, problem formulation, objectives, benefits, scope of research, and report outline. A thorough outline of this report is provided in the end of this chapter.
CHAPTER II: LITERATURE REVIEW
Related theories are elaborated in the second chapter in order to support research comprehension. These theories are collected from reliable literatures. Subjects in literature review are warehouse management, fast moving consumer good, time study, review of automation technologies, benefit-cost analysis, and sensitivity analysis.
CHAPTER III: RESEARCH METHODOLOGY
Research methodology are specified in this chapter. Research methodology will guide the research processes systematically. It is shown in a flowchart and followed by description of each process.
CHAPTER IV: DATA COLLECTION AND PROCESSING
The fourth chapter shows data gathered from observation, literatures, and historical data. Then, these data are processed based on methodology which is stated in previous chapter.
CHAPTER V: ANALYSIS AND INTERPRETATION
Results of data processing in previous chapter are analyzed and interpreted in the fifth chapter. The analysis and interpretation will lead to conclusions that necessary for the company.
6
7
CHAPTER II
LITERATURE REVIEW
Related theories are elaborated in this chapter in order to support research comprehension. These theories are collected from reliable literatures. Subjects in literature review are warehouse management, fast moving consumer goods, warehouse performance, time study, review of automation technologies, gap analysis, benefit-cost analysis, and sensitivity analysis.
2.1 Warehouse Management
Warehouse is a temporary place to store products (Richards, 2014). Basic operations in warehouse are not significantly change over time. Those operations are receiving products into warehouse, processing orders, replenishing, and dispatching the products. Some warehouses also provide bundling or re-packaging services. All of these operations are simplified into terms of inbound process, outbound process, and value-added service. Warehouse management tries to operate each process efficiently (Hompel & Schmidt, 2007).
In general, inbound process starts when truck from supplier arrives in warehouse. Truck will head into receiving dock and start the unloading process. Operator will check whether all physical products are match with list on delivery note. Inspection is also conducted during this process. If all are good, then operators will receive the products, update inventory data, and put-away to the specified location in warehouse.
8
2.2 Fast Moving Consumer Goods
Fisher (1997) classified products into two main categories; those are functional product and innovative product. Fast moving consumer goods (FMCG) is an example of functional product. Some characteristics of functional product are long product life cycle (more than 2 years), less variation, easily forecasted with high accuracy (stable demand), stock out rate less than 2%, there is no markdown, and low profit margin per unit. These characteristics fit with FMCG products; such as soap, toothpaste, shampoo, and detergent.
As functional product, then implementation of efficient supply chain strategy is highly recommended than responsive strategy (Pujawan & Mahendrawathi, Supply Chain Management, 2010). Since functional products only generate low profit margin per unit, then efficient strategy focus on minimizing physical and operational cost. Then as the results of cost reduction, company can decide between reducing price to attract more customers (market expansion) or set the same price with higher profit margin (Sumanth, 1984).
2.3 Time Study
Time study defines the principles of work measurement in order to determine standard time to finish a particular work (Wignjosoebroto, 2006). Time study is divided into two parts; those are direct time study and indirect time study. Direct time study measures the work directly by using certain methods. These methods are stopwatch time study and work sampling. While as its name, indirect time study measures the work indirectly through some approaches. The approaches are data standard, regression analysis, and predetermined motion time system. Explanation of stopwatch time study and work sampling is shown as follows.
2.3.1 Stopwatch Time Study
Stopwatch time study is appropriate to be implemented in short and repetitive work. Systematic sequences of stopwatch time study application are as follow.
9
Classify work operation into detailed elements
Observe, measure, and take note the time needed by operator in finishing the work
Determine number of work cycle to be measured
Conduct uniformity and adequacy tests
Set performance rating of operator’s activities, then adjust time with the performance rating
Determine allowance time and calculate standard time
2.3.2 Work Sampling
Besides determining standard time, work sampling can be used in measuring delay ratio (idle-work) of machines, operators, and facilities. Work sampling also determines performance level of operator during his working hours. Systematic sequences of work sampling application are as follow.
Plan the schedule for observation based on randomization principle
Do pre-work sampling randomly
Calculate the pre-work sampling result for certain observation
Conduct uniformity and adequacy tests
Calculate degree of accuracy
Analyze the result and make conclusion
2.4 Review of Automation Technology
10
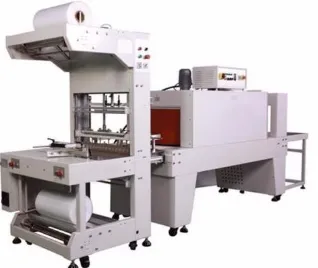
2.4.1 EntrePack Automatic SW-1713 L-Bar Shrink Wrap Machine
It is an automated machine which is design for both sealing and shrinking products (EntrePack, 2013). Some of the feature are touch screen control, adjustable height that fits variety of products, and safety guards. Its maximum speed reaches 25 pieces per minute.
Figure 2. 1 EntrePack Automatic SW-1713 L-Bar Shrink Wrap Machine
2.4.2 Gramegna Model ECO 2000 Shrink Bundler
The Gramegna’s machine is compatible to handle wrapping and shrinking operations (Gramegna, n.d.). Its features are flexible for almost all variants of product with good quality outputs.
11
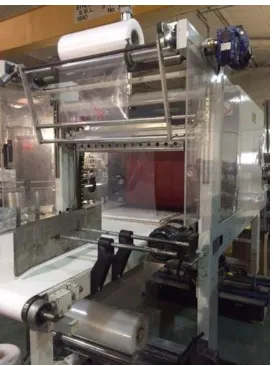
2.4.3 Prometica Sleeve Wrapping Heat Sealing Machine
It can be used for wrapping, sealing, and shrinking wide range of products (Prometica, 2015). The advantage of Prometica machine is its low energy consumption.
Figure 2. 3 Prometica Sleeve Wrapping Heat Sealing Machine
2.4.4 Comparison of Automation Technologies
In order to compare the proposed automation technologies, information of all technologies are elaborated. The information are classified into several categories; those are cost elements and technical data. These information are obtained from literature review and preliminary quotation.
Table 2. 1 Comparison of Proposed Automation Technologies
Category Product
EntrePack Gramegna Prometica
Country USA Italy England
Price $ 16,875 £ 9,713 £ 9,746
IDR 224,808,750 IDR 157,468,763 IDR 158,015,951
Shipping Cost $ 975 € 1,500 £ 2,363
IDR 12,988,950 IDR 21,162,000 IDR 38,303,213
Annual Maintenance Cost £ 1,575
IDR 25,535,475
Lifetime (years) 12
Machine Length (mm) 3,124 - 2,120
Machine Width (mm) 838 - 1,360
Machine Height (mm) 1,549 - 1,900
12
Category Product
EntrePack Gramegna Prometica
Speed (pcs / minute) 25 10 – 20 6 – 14
Power (kw) 8.8 20 2
Package Material PVC, POF, PP PP, PE PVC, PE
2.5 Benefit-Cost Analysis
Benefit-cost analysis is a policy assessment method that quantifies in monetary terms the value of all policy consequences to all members of society (Boardman, Greenberg, Vining, & Weimer, 2001). In benefit-cost analysis, all the costs and benefits are considered to society as a whole. The basic formula is as
Purposes of benefit-cost analysis are to help social decision-making and to facilitate more efficient allocation of society’s resources. The basic steps of benefit-cost analysis are as follow.
a. Specify the set of alternative projects.
b. Decide whose benefits and costs count (standing).
c. Catalogue the impacts and select measurement indicators (units). d. Predict the impacts quantitatively over the life of the project. e. Monetize (attach dollar values to) all impacts.
f. Discount benefits and costs to obtain present values. g. Compute the net present value (NPV) of each alternative. h. Perform sensitivity analysis.
13
analysis starts from alternative with the lowest investment. The formula of incremental benefit-cost analysis is as follows.
[Equation 2.2]
where:
incremental benefit-cost analysis between alternative M (higher investment) and alternative N (lower investment)
differences of benefit between alternative M and alternative N (unit/hour)
differences of cost between alternative M and alternative N (IDR) If the result is more than one, then choose alternative with higher obtained standard conversion from benefit into cost unit. For example, benefits are usually shown in increasing of output, saving time, reducing labor, etc. These non-cost measurements will be converted into cost measurement by certain standardizations.
Increasing output
Increasing output can be converted by using cost per unit. Cost per unit is multiplied by difference of increasing unit of output.
Saving time
Saving time is assumed as benefit since labor can do other works and generate more outputs in the same time. It also can increase customer satisfaction due to faster response time.
Reducing labor
14
2.6 Sensitivity Analysis
Sensitivity analysis is used in decision-making process. It assists decision makers against uncertainty aspects. Different value of certain parameters may leads to different decision to be chosen (Clemen, 1996). Therefore, sensitivity analysis tries to determine the point of indifference. Point of indifference shows each decision alternative will deliver the same consequences. Sensitivity analysis also shows the effect of increasing certain value will give significant impact or not. Types of sensitivity analysis are one-way, two-way, and two-way sensitivity analysis for three alternatives.
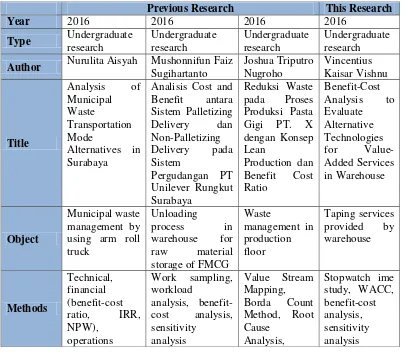
2.7 Previous Research
There are several previous researches which are using benefit-cost analysis approach to solve the problem. Those researches are as follow.
Table 2. 2 Comparison of Previous Researches and Current Research
Previous Research This Research
Year 2016 2016 2016 2016
Author Nurulita Aisyah Mushonnifun Faiz
15
Previous Research This Research
analysis FMEA,
Parameter Cost, emission Workload of
operators, cost
Cost, productivity
Cost,
16
17
CHAPTER III
RESEARCH METHODOLOGY
Research methodology are specified in this chapter. Research methodology will guide the research processes systematically. It is shown in a flowchart and followed by description of each phase.
Start
Figure 3. 1 Flowchart of Research Methodology
3.1 Preliminary Study
18
gathered from reliable sources; such as books, journals, and online sources. There is also review of automation technologies related to problem identified. The automation technology information is obtained from developer’s website and benchmarking.
Cost of existing operation
Data Processing
19
3.2 Data Collection Phase
In data collection phase, author is responsible in gathering necessary data for the research. Those data are related to value-added services in the warehouse; such as WACC, business process, taping sequence, standard time, OPC, etc. These data can be obtained from direct measurement, historical data, and literatures as well.
3.3 Data Processing Phase
Data processing consists of WACC calculation, stopwatch time study, benefit-cost analysis, and sensitivity analysis. These processes are done sequentially.
3.3.1 WACC Calculation
Before going further into benefit-cost analysis, weighted average cost of capital (WACC) should be calculated in the beginning. Then, conduct assessment to obtain the components of benefit and cost. Finally, benefit-cost analysis can be calculated. WACC measures company’s cost to borrow money based on proportion of debt and equity that the company has taken on. In this research, WACC will be the determination for company whether to invest or not. The formula of WACC is as follows.
( ) * ( )+ [Equation 3.1] where:
E/V = percentage of financing that is equity Re = cost of equity
D/V = percentage of financing that is debt Rd = cost of debt
Tc = corporate tax rate
3.3.2 Benefit-Cost Analysis
20
( ) ( ) [Equation 3.2] Benefit-cost analysis is done by using incremental benefit-cost analysis as explained in previous chapter.
[Equation 3.3]
where:
incremental benefit-cost analysis between alternative M (higher investment) and alternative N (lower investment)
differences of benefit between alternative M and alternative N (unit/hour)
differences of cost between alternative M and alternative N (IDR)
3.3.3 Sensitivity Analysis
Sensitivity analysis will focus on interest rate and technology utilization. There are two approaches used; those are one-way sensitivity analysis for each factor and two-way sensitivity analysis for both factors.
3.4 Data Interpretation and Analysis Phase
Results obtained from data processing will be interpreted and analyzed in this phase. Analysis on result of benefit-cost analysis is done by focusing on the calculation result. If it is more than 1, then the alternative will give benefit to the company. If it is less than 1, then the alternative will be rejected. However, if both alternatives have value more than 1, then incremental benefit-cost analysis will assist the decision process. After that, sensitivity analysis on inflation rate will show that the change of certain values may change the final decision.
21
CHAPTER IV
DATA COLLECTION AND PROCESSING
This chapter is classified into two main subchapters; those are data collection and data processing. Data collection will elaborate all related data which were collected from direct observation, literature study, and historical data. Then in data processing, those data will be processed following the aforementioned research methodology.
4.1 Data Collection
Data collection covers several subchapters; those are weighted average cost of capital, business process mapping of taping process, stopwatch time study of manual taping process, operation process chart of manual taping process, and demand forecasting of taping process.
4.1.1 Weighted Average Cost of Capital
In determining the value of Weighted Average Cost of Capital (WACC), data about percentage of equity (E/V) and debt (D/V) are needed. Since Kamadjaja Logistics did not provide those data, then the data will follow another company’s data from the same sector; that is DHL. The following are data from DHL’s balance sheet of 2015 Annual Report (DHL Investor Relations, 2016).
( ) ( )
Then the value of E/V and D/V can be calculated. Other data are also needed for the calculation of WACC; those are cost of equity (Re), cost of debt (Rd), and corporate tax rate (Tc).
22
( ) * ( )+
( ) [ ( )]
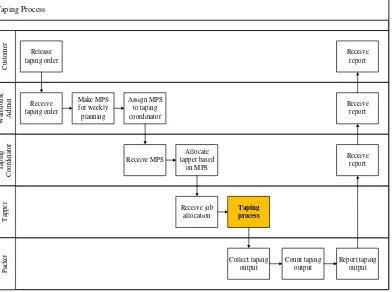
4.1.2 Business Process Mapping of Taping Process
Taping process is done manually by more than 80 labors. These labors are called as tapper. Besides tapper, in total there are 5 sections who take responsibility during taping process; those are customer, warehouse admin, taping coordinator, tapper, and packer. Business process of taping process is mapped by using cross-functional (swim-lane) approach as follows.
Taping Process
Figure 4. 1 Business Process of Taping Process
23
MPS to taping coordinator. Taping coordinator will allocate the job to tapper and manage the production during taping process. Outputs of taping process are collected and counted by packer. Finally, recapitulation of production output is reported to taping coordinator, warehouse admin, and customer consecutively. Here taping coordinator, tapper, and packer are classified as direct labors.
4.1.3 Stopwatch Time Study of Manual Taping Process
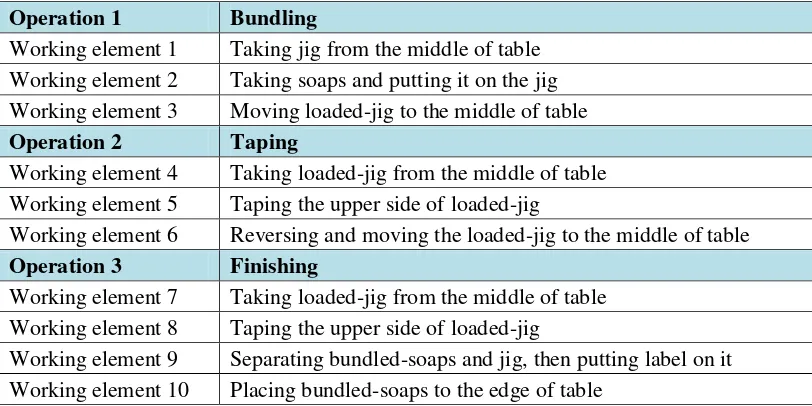
Stopwatch time study is focused mainly on manual taping process. The purpose of stopwatch time study is to measure the standard time of manual taping process. First, manual taping process is classified into several operations. Then, each operation is divided into several working elements.
Table 4. 1 Operations and Working Elements of Manual Taping Process
Operation 1 Bundling
Working element 1 Taking jig from the middle of table Working element 2 Taking soaps and putting it on the jig Working element 3 Moving loaded-jig to the middle of table
Operation 2 Taping
Working element 4 Taking loaded-jig from the middle of table Working element 5 Taping the upper side of loaded-jig
Working element 6 Reversing and moving the loaded-jig to the middle of table
Operation 3 Finishing
Working element 7 Taking loaded-jig from the middle of table Working element 8 Taping the upper side of loaded-jig
Working element 9 Separating bundled-soaps and jig, then putting label on it Working element 10 Placing bundled-soaps to the edge of table
As shown in the table above, the sequences of manual taping process are bundling, taping, and finishing. Each operation is done in a short time repetitively, with different labors in charge for each operation.
24
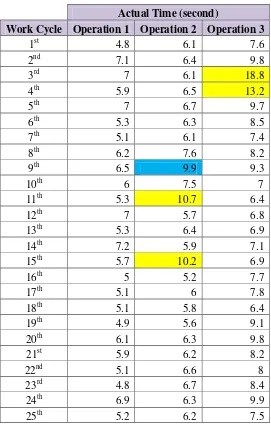
Table 4. 2 Recapitulation of Manual Taping Process Measurement
Actual Time (second)
Work Cycle Operation 1 Operation 2 Operation 3
25
in the first iteration, then the second iteration is not necessary. Uniformity test is done by using the aid of Minitab software.
Figure 4. 2 Uniformity Test of Operation 1 (First Iteration)
26
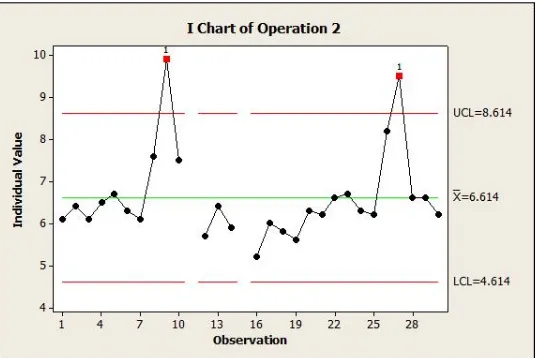
Figure 4. 4 Uniformity Test of Operation 2 (Second Iteration)
Figure 4. 5 Uniformity Test of Operation 3 (First Iteration)
27
Results of uniformity test show that there is no outlier data in Operation 1; while there are several outlier data in Operation 2 and Operation 3. In Operation 2, two outlier data are identified in the first iteration. Then in the second iteration, there are two more outlier data. In Operation 3, two outlier data are only identified in the first iteration; while the second iteration shows that all data are already uniform. Table below shows summary of uniformity test. Cell with yellow color means the outlier data in the first iteration; while blue-colored cell means outlier data in the second iteration.
Table 4. 3 Summary of Uniformity Test
Actual Time (second)
Work Cycle Operation 1 Operation 2 Operation 3
28
Actual Time (second)
Work Cycle Operation 1 Operation 2 Operation 3
26th 7 8.2 9
27th 5.6 9.5 7.5
28th 5.1 6.6 7.9
29th 5.5 6.6 8.6
30th 5.7 6.2 8.3
Then, adequacy test can be conducted. The purpose of adequacy test is to check whether the number of observation already represents the population or not. If not yet, then more observations must be done. The formula of adequacy test is as follows. Operation 1 and the recapitulation for all operations are shown as follow.
( )
The calculation shows that N > N’, then data in Operation 1 is sufficient and pass adequacy test.
Table 4. 4 Recapitulation of Adequacy Test Calculation
Operation N N' x S Conclusion
Operation 1 30 29.31 5.813 0.787 Sufficient
Operation 2 26 15.05 6.377 0.619 Sufficient
29
The next step is determining the performance rating by using Westinghouse Rating System approach. This approach evaluates operator performance based on four evaluation factors. Those factors are skill, effort, condition, and consistency. Table below shows the Westinghouse Rating System’s leveling and scoring.
Table 4. 5 Westinghouse Rating System
Description Level Score
Skill Effort
Description Level Score
Condition Consistency
Determination of performance rating is done subjectively for each operation. Recapitulation of performance rating are as follow.
Table 4. 6 Recapitulation of Performance Rating
Operation Factor Level Score Total Performance
30
Operation Factor Level Score Total Performance
Factor
In order to overcome some interruptions during work, then allowance time is set up. It is also called as personal time. Barnes (1980) argued that average allowance time of light-repetitive work is between 2% – 5%. Then, 5% of allowance time is determined for manual taping process. After all data are gathered, finally normal time and standard time can be calculated. The formula and calculation (example for Operation 1) are as follow.
Table 4. 7 Recapitulation of Normal and Standard Time (second)
Operation Normal Time Standard Time
Operation 1 6.918 7.282
Operation 2 7.206 7.585
Operation 3 9.109 9.588
4.1.4 Operation Process Chart of Manual Taping Process
31
O - 1 Soaps
O - 2
Tapes Tapes
O - 3 Bundling
Taping
Finishing 7.282 s
7.585 s
9.588 s
Figure 4. 7 Operation Process Chart of Manual Taping Process
Manual taping process is started by unpacking cartons of soap then inspecting all of the soap. Defect soaps will be rejected, while the good one will be the input for taping process. The sequences of manual taping process are as follow.
a. The first operation is bundling. Here the operator puts several soaps into a jig. Standard time for this operation is 7.282 seconds. Then soaps in the loaded-jig will be taped in the second operation.
32
b. The second operation is taping. Only one side of the bundled-soaps is taped. Then the bundled-jig will be reversed before it go to the last operation. Standard time for the second operation is 7.585 seconds.
Figure 4. 9 Operation 3: Finishing
c. The last operation is finishing. Operator will put the tape on another side of the bundled-soaps, separate bundled-soaps and the jig, put label (barcode) on bundled-soaps, and then place bundled-soaps in the edge of table. Standard time of this operation is 9.588 seconds.
Since the longest time of all operations is 9.588 seconds, so it can be concluded that three tappers can produce one bundle of soaps in every 9.588 seconds or in every minute there are 6.26 bundles of soap come out from manual taping process.
4.1.5 Demand Forecasting of Taping Process
33
Table 4. 8 Annual Data of Actual Taping Output
Year Taping Output
2013 21,888,374 13,076,304 5,081,124 2,335,268 1,395,678 2014 27,150,436 15,113,568 8,519,208 2,020,264 1,497,396
2015 14,617,898 6,030,608 6,675,468 1,046,904 864,918
2016 23,155,518 7,063,056 13,871,568 773,640 1,447,254
There are 4 types of bundle based on number of soap in it; those are 3, 4, 6, and 8. Most of the taping output (at least 83% each year and increasing) is composed from bundles of 3 and 4 soaps. Taping output also fluctuates along the years. In order to forecast the taping demand, moving average approach (with n = 3 years) is used.
Figure 4. 10 Demand Forecasting of Taping Process
Table 4. 9 Demand Forecasting of Taping Process
Year Actual Output (bundle) Forecasted Output (bundle)
2013 21,888,374
2014 27,150,436
2015 14,617,898
2016 23,155,518 21,218,903
2017 21,641,284
Demand Forecasting of Taping Process
34
Year Actual Output (bundle) Forecasted Output (bundle)
2021 20,777,387 calculation of number of machine needed.
4.2 Data Processing
Data processing is composed by cost calculation of manual taping process, cost and benefit calculation of automated taping process, incremental benefit-cost analysis, and sensitivity analysis.
4.2.1 Cost Calculation of Manual Taping Process
Cost components of existing process can be divided into two main costs; those are investment cost and operational cost. Investment cost covers taping tables, long chairs, small tables, and equipment (jig and cutter). Each element in investment cost is elaborated as follows.
Taping table
Price of taping table = IDR 375,000 per unit Number of taping table = 20 units
Cost of taping table = 375,000 x 20 = IDR 7,500,000
Long chair
Price of long chair = IDR 150,000 per unit Number of long chair = 40 units
Cost of long chair = 150,000 x 40 = IDR 6,000,000
35
Price of small table = IDR 187,500 per unit Number of small table = 18 units
Cost of small table = 187,500 x 18 = IDR 3,375,000
Equipment - jig
Price of jig = IDR 11,250 per unit Number of jig = 1,531 units
Cost of jig = 11,250 x 1,531 = IDR 27,223,750
Equipment - cutter
Price of cutter = IDR 3,000 per pack (1 pack = 12 units) Number of cutter = 7 packs
Cost of cutter = 3,000 x 7 = IDR 21,000
Figure 4. 11 Table and Chair for Manual Taping Process
Operational cost is composed by direct labor and material costs. Direct labor involves taping coordinator, tapper and packer; while material cost is come from tape usage. It is important to be noted that the status of all direct labors is sub-contract. This means the company does not need to give compensation if there is labor reduction (layoff). Elements of operational cost are elaborated as follow.
Direct labor
36 Number of tapper = 83 labors Number of packer = 4 labors
Total salary = IDR 231,750,000 per month = IDR 2,781,000,000 per year
Material
Price (wholesale) = IDR 435,000 per pack (1 pack = 72 units) Number of tape = 54,616 units per year = 759 packs per year Cost of tape = 435,000 x 759 = IDR 330,165,000 per year
All cost elements in manual taping process are already calculated. Those data will be projected following time horizon of 12 years and using 5% of inflation rate as assumed in the beginning. For example, the calculation of direct labor cost in 2018 is as follows.
( )
( )
37
Table 4. 10 Projected Cash Flow of Manual Taping Process (in IDR)
Time Horizon 1 2 3 4 5 6
Year 2017 2018 2019 2020 2021 2022 2023
Investment Cost
Taping table 7,500,000
Long chair 6,000,000
Small table 3,375,000
Equipment 17,244,750
Total Investment Cost 34,119,750
Operational Cost
Direct labor 2,920,050,000 3,066,052,500 3,219,355,125 3,380,322,881 3,549,339,025 3,726,805,977
Material 346,673,250 364,006,913 382,207,258 401,317,621 421,383,502 442,452,677
Total Operational Cost 3,266,723,250 3,430,059,413 3,601,562,383 3,781,640,502 3,970,722,527 4,169,258,654
38
Time Horizon 7 8 9 10 11 12
Year 2024 2025 2026 2027 2028 2029
Investment Cost
Taping table Long chair Small table Equipment
Total Investment Cost
Operational Cost
Direct labor 3,913,146,275 4,108,803,589 4,314,243,769 4,529,955,957 4,756,453,755 4,994,276,443
Material 464,575,311 487,804,077 512,194,280 537,803,994 564,694,194 592,928,904
Total Operational Cost 4,377,721,586 4,596,607,666 4,826,438,049 5,067,759,952 5,321,147,949 5,587,205,347
39
Using 10.5% of WACC, annual total cost data are calculated into present value (2017 is the base line). Then, the net present value (NPV) can be obtained by adding up all present value data. For example, present value calculation of annual total cost year 2018 is as follows.
( )
( )
( )
Table 4. 11 NPV Calculation of Manual Taping Process (in IDR)
Time Horizon Year Annual Total Cost Present Value
2017 34,119,750 34,119,750
1 2018 3,266,723,250 2,956,310,633
2 2019 3,430,059,413 2,809,163,950
3 2020 3,601,562,383 2,669,341,310
4 2021 3,781,640,502 2,536,478,168
5 2022 3,970,722,527 2,410,228,124
6 2023 4,169,258,654 2,290,262,018
7 2024 4,377,721,586 2,176,267,076
8 2025 4,596,607,666 2,067,946,090
9 2026 4,826,438,049 1,965,016,647
10 2027 5,067,759,952 1,867,210,388
11 2028 5,321,147,949 1,774,272,315
12 2029 5,587,205,347 1,685,960,118
Cost NPV 27,242,576,588
The cost NPV of manual taping process for 12 years is IDR 27,242,576,588. Since Kamadjaja Logistics do not provide benefit in the form of income from taping process, then the benefit NPV is assumed to be zero.
4.2.2 Cost and Benefit Calculation of Automated Taping Process
40
In general, components of cost are investment, operational, and maintenance costs. Due to all machines are bought from abroad (import), then Kamadjaja Logistics must follow Incoterms 2010 regulation and Indonesia National Trade Repository (INTR) which means investment cost is in the form of CIF (cost, insurance, freight) and importing taxes. These costs are only paid once in the beginning. Operational costs consist of direct labor, material, and energy costs. Both operational and maintenance costs are paid annually.
On the other hand, benefit describes savings that occurs due to investment in automation technology. Savings are generated due to faster operation time. Faster operation time means number of direct labor can be reduced and there is no need for overtime work. Reduction of direct labor will directly reduce the company’s expense for their salary; while no overtime work means overtime cost can be eliminated. Besides those quantitative benefits, there are also several qualitative benefits that will be elaborated in the next chapter. Each alternative is elaborated as follows.
Alternative 1: EntrePack Automatic SW-1713 L-Bar Shrink Wrap Machine Calculation of investment costs:
Machine cost = IDR 224,808,750
Freight (shipping cost) = IDR 12,988,950
Insurance = 0.5% x (machine cost + freight) = IDR 1,188,989 CIF = machine cost + insurance + freight = IDR 238,986,689
Following HS code of 8422.40.00.00 for heat-shrink wrapping machinery: Import duty = 5% x CIF = IDR 11,949,334
PPN = 10% x CIF = IDR 23,898,669 PPh = 2.5% x CIF = IDR 5,974,667
Investment cost = IDR 280,809,359 per machine
Machine speed = 25 bundles per minute
1 year = 300 days ; 1 day = 8 hours ; 1 hour = 60 minutes Capacity = 25 x 60 x 8 x 300 = 3,600,000 bundles per year
41
Total investment cost = investment cost x machine needed Total investment cost = IDR 1,684,856,154
Calculation of direct labor cost:
There are 2 loaders and 1 pickers needed for each machine. Also 4 packers and 2 taping coordinators are required for the whole process.
Number of loader = 2 x 6 machines = 12 labors Number of picker = 1 x 6 machines = 6 labors Number of packer = 4 labors
Number of taping coordinator = 2 labors Direct labor = 12 + 6 + 4 + 2 = 24 labors
Salary = IDR 2,472,159 per labor per month (scaled-UMR of Surabaya) Labor cost = 24 x 2,472,159 x 12 months = IDR 711,981,900 per year
Calculation of material cost:
Price of PVC shrink film (wholesale) = IDR 97,425 per roll Number of PVC shrink film = 16,119 rolls per year
Cost of PVC = 97,425 x 16,119 = IDR 1,570,393,575 per year
Calculation of energy cost:
Power = 8.8 kW per machine
Energy = 8.8 kW x 8 hours x 300 days x 6 machines = 126,720 kWh/year Price of electricity = IDR 1,125 per kWh
Energy cost = 1,125 x 126,720 = IDR 142,560,000 per year
Calculation of maintenance cost:
Maintenance cost = IDR 25,535,475 per machine per year
= 25,535,475 x 6 machines = IDR 153,212,850 per year
Calculation of saving from direct labor reduction:
42
Labor cost of Alternative 1 = IDR 711,981,900 per year Saving from labor reduction = 2,781,000,000 – 711,981,900
= IDR 2,069,018,100 per year
Calculation of overtime cost elimination:
Overtime cost = IDR 5,457,204 per month
= 5,457,204 x 12 months = IDR 65,486,448 per year
43
Table 4. 12 Projected Cash Flow of Alternative 1 (in IDR)
Time Horizon 1 2 3 4 5 6
Year 2017 2018 2019 2020 2021 2022 2023
Investment Cost
Investment 1,684,856,154
Operational Cost
Direct labor 747,580,995 784,960,045 824,208,047 865,418,449 908,689,372 954,123,840
Material 1,648,913,254 1,731,358,916.44 1,817,926,862.26 1,908,823,205.37 2,004,264,365.64 2,104,477,583.92
Energy 149,688,000 157,172,400.00 165,031,020.00 173,282,571.00 181,946,699.55 191,044,034.53
Total Operational Cost 2,546,182,249 2,673,491,361 2,807,165,929 2,947,524,226 3,094,900,437 3,249,645,459
Maintenance Cost 160,873,493 168,917,167.13 177,363,025.48 186,231,176.76 195,542,735.59 205,319,872.37
TOTAL COST 1,684,856,154 2,707,055,741 2,842,408,528 2,984,528,955 3,133,755,402 3,290,443,173 3,454,965,331
Labor Reduction 2,172,469,005 2,281,092,455 2,395,147,078 2,514,904,432 2,640,649,654 2,772,682,136
Overtime cost elimination 68,760,770 72,198,808.92 75,808,749.37 79,599,186.83 83,579,146.18 87,758,103.48
44
Time Horizon 7 8 9 10 11 12
Year 2024 2025 2026 2027 2028 2029
Investment Cost
Investment
Operational Cost
Direct labor 1,001,830,032 1,051,921,534 1,104,517,611 1,159,743,491 1,217,730,666 1,278,617,199
Material 2,209,701,463.12 2,320,186,536.28 2,436,195,863.09 2,558,005,656.24 2,685,905,939.06 2,820,201,236.01
Energy 200,596,236.25 210,626,048.07 221,157,350.47 232,215,217.99 243,825,978.89 256,017,277.84
Total Operational Cost 3,412,127,732 3,582,734,118 3,761,870,824 3,949,964,366 4,147,462,584 4,354,835,713
Maintenance Cost 215,585,865.99 226,365,159.29 237,683,417.26 249,567,588.12 262,045,967.52 275,148,265.90
TOTAL COST 3,627,713,598 3,809,099,278 3,999,554,242 4,199,531,954 4,409,508,551 4,629,983,979
Labor Reduction 2,911,316,243 3,056,882,055 3,209,726,158 3,370,212,466 3,538,723,089 3,715,659,244
Overtime cost elimination 92,146,008.66 96,753,309.09 101,590,974.55 106,670,523.27 112,004,049.44 117,604,251.91
45
Using 10.5% of WACC, annual total cost and benefit data are calculated into present value. The summary of NPV calculation is as follows.
Table 4. 13 NPV Calculation of Alternative 1 (in IDR)
Time Horizon Year Present Value of Cost Present Value of Benefit
2017 1,684,856,154
1 2018 2,449,824,200 2,028,262,240
2 2019 2,327,887,249 1,927,308,011
3 2020 2,212,019,558 1,831,378,653
4 2021 2,101,919,037 1,740,224,059
5 2022 1,997,298,632 1,653,606,572
6 2023 1,897,885,578 1,571,300,363
7 2024 1,803,420,685 1,493,090,843
8 2025 1,713,657,665 1,418,774,104
9 2026 1,628,362,487 1,348,156,388
10 2027 1,547,312,770 1,281,053,582
11 2028 1,470,297,203 1,217,290,734
12 2029 1,397,114,989 1,156,701,602
NPV 24,231,856,207 18,667,147,150
Alternative 2: Gramegna Model ECO 2000 Shrink Bundler Calculation of investment costs:
Machine cost = IDR 157,468,763
Freight (shipping cost) = IDR 21,162,000
Insurance = 0.5% x (machine cost + freight) = IDR 893,154 CIF = machine cost + insurance + freight = IDR 179,523,916
Following HS code of 8422.40.00.00 for heat-shrink wrapping machinery: Import duty = 5% x CIF = IDR 8,976,196
PPN = 10% x CIF = IDR 17,952,392 PPh = 2.5% x CIF = IDR 4,488,098
Investment cost = IDR 210,940,602 per machine
Machine speed = 20 bundles per minute
46
Total investment cost = investment cost x machine needed Total investment cost = IDR 1,687,524,813
Calculation of direct labor cost:
There are 2 loaders and 1 pickers needed for each machine. Also 4 packers and 2 taping coordinators are required for the whole process.
Number of loader = 2 x 8 machines = 16 labors Number of picker = 1 x 8 machines = 8 labors Number of packer = 4 labors
Number of taping coordinator = 2 labors Direct labor = 16 + 8 + 4 + 2 = 30 labors
Salary = IDR 2,472,159 per labor per month (UMR of Surabaya) Labor cost = 30 x 2,472,159 x 12 months = IDR 889,977,375 per year
Calculation of material cost:
Price of PVC shrink film (wholesale) = IDR 97,425 per roll Number of PVC shrink film = 16,119 rolls per year
Cost of PVC = 97,425 x 16,119 = IDR 1,570,393,575 per year
Calculation of energy cost:
Power = 20 kW per machine
Energy = 20 kW x 8 hours x 300 days x 8 machines = 384,000 kWh/year Price of electricity = IDR 1,125 per kWh
Energy cost = 1,125 x 384,000 = IDR 432,000,000 per year
Calculation of maintenance cost:
Maintenance cost = IDR 25,535,475 per machine per year
47
Calculation of saving from direct labor reduction:
Labor cost of manual taping process = IDR 2,781,000,000 per year Labor cost of Alternative 2 = IDR 889,977,375 per year
Saving from labor reduction = 2,781,000,000 – 889,977,375 = IDR 1,891,022,625 per year
Calculation of overtime cost elimination:
Overtime cost = IDR 5,457,204 per month
= 5,457,204 x 12 months = IDR 65,486,448 per year
48
Table 4. 14 Projected Cash Flow of Alternative 2 (in IDR)
Time Horizon 1 2 3 4 5 6
Year 2017 2018 2019 2020 2021 2022 2023
Investment Cost
Investment 1,687,524,813
Operational Cost
Direct labor 934,476,244 981,200,056 1,030,260,059 1,081,773,062 1,135,861,715 1,192,654,800
Material 1,648,913,254 1,731,358,916.44 1,817,926,862.26 1,908,823,205.37 2,004,264,365.64 2,104,477,583.92
Energy 453,600,000 476,280,000.00 500,094,000.00 525,098,700.00 551,353,635.00 578,921,316.75
Total Operational Cost 3,036,989,498 3,188,838,972 3,348,280,921 3,515,694,967 3,691,479,715 3,876,053,701
Maintenance Cost 214,497,990 225,222,889.50 236,484,033.98 248,308,235.67 260,723,647.46 273,759,829.83
TOTAL COST 1,687,524,813 3,251,487,488 3,414,061,862 3,584,764,955 3,764,003,203 3,952,203,363 4,149,813,531
Labor Reduction 1,985,573,756 2,084,852,444 2,189,095,066 2,298,549,820 2,413,477,311 2,534,151,176
Overtime cost elimination 68,760,770 72,198,808.92 75,808,749.37 79,599,186.83 83,579,146.18 87,758,103.48
49
Time Horizon 7 8 9 10 11 12
Year 2024 2025 2026 2027 2028 2029
Investment Cost
Investment
Operational Cost
Direct labor 1,252,287,541 1,314,901,918 1,380,647,013 1,449,679,364 1,522,163,332 1,598,271,499
Material 2,209,701,463.12 2,320,186,536.28 2,436,195,863.09 2,558,005,656.24 2,685,905,939.06 2,820,201,236.01
Energy 607,867,382.59 638,260,751.72 670,173,789.30 703,682,478.77 738,866,602.71 775,809,932.84
Total Operational Cost 4,069,856,386 4,273,349,206 4,487,016,666 4,711,367,499 4,946,935,874 5,194,282,668
Maintenance Cost 287,447,821.32 301,820,212.39 316,911,223.01 332,756,784.16 349,394,623.37 366,864,354.53
TOTAL COST 4,357,304,208 4,575,169,418 4,803,927,889 5,044,124,283 5,296,330,497 5,561,147,022
Labor Reduction 2,660,858,735 2,793,901,672 2,933,596,755 3,080,276,593 3,234,290,423 3,396,004,944
Overtime cost elimination 92,146,008.66 96,753,309.09 101,590,974.55 106,670,523.27 112,004,049.44 117,604,251.91
50
Using 10.5% of WACC, annual total cost and benefit data are calculated into present value. The summary of NPV calculation is as follows.
Table 4. 15 NPV Calculation of Alternative 2 (in IDR)
Time Horizon Year Present Value of Cost Present Value of Benefit
2017 1,687,524,813
1 2018 2,942,522,613 1,859,126,268
2 2019 2,796,062,212 1,766,590,572
3 2020 2,656,891,694 1,678,660,724
4 2021 2,524,648,216 1,595,107,476
5 2022 2,398,986,993 1,515,712,986
6 2023 2,279,580,400 1,440,270,258
7 2024 2,166,117,123 1,368,582,598
8 2025 2,058,301,338 1,300,463,102
9 2026 1,955,851,950 1,235,734,170
10 2027 1,858,501,853 1,174,227,039
11 2028 1,765,997,236 1,115,781,349
12 2029 1,678,096,921 1,060,244,721
NPV 28,769,083,363 17,110,501,264
.
Alternative 3: Prometica Sleeve Wrapping Heat Sealing Machine Calculation of investment costs:
Machine cost = IDR 158,015,951
Freight (shipping cost) = IDR 38,303,213
Insurance = 0.5% x (machine cost + freight) = IDR 981,596 CIF = machine cost + insurance + freight = IDR 197,300,760
Following HS code of 8422.40.00.00 for heat-shrink wrapping machinery: Import duty = 5% x CIF = IDR 9,865,038
PPN = 10% x CIF = IDR 19,730,076 PPh = 2.5% x CIF = IDR 4,932,519
Investment cost = IDR 231,828,392 per machine
Machine speed = 14 bundles per minute
51
Total investment cost = investment cost x machine needed Total investment cost = IDR 2,550,112,317
Calculation of direct labor cost:
There are 2 loaders and 1 pickers needed for each machine. Also 4 packers and 2 taping coordinators are required for the whole process.
Number of loader = 2 x 11 machines = 22 labors Number of picker = 1 x 11 machines = 11 labors Number of packer = 4 labors
Number of taping coordinator = 2 labors Direct labor = 22 + 11 + 4 + 2 = 39 labors
Salary = IDR 2,472,159 per labor per month (UMR of Surabaya) Labor cost = 39 x 2,472,159 x 12 months = IDR 1,156,970,588 per year
Calculation of material cost:
Price of PVC shrink film (wholesale) = IDR 97,425 per roll Number of PVC shrink film = 16,119 rolls per year
Cost of PVC = 97,425 x 16,119 = IDR 1,570,393,575 per year
Calculation of energy cost:
Power = 2 kW per machine
Energy = 2 kW x 8 hours x 300 days x 11 machines = 52,800 kWh/year Price of electricity = IDR 1,125 per kWh
Energy cost = 1,125 x 52,800 = IDR 59,400,000 per year
Calculation of maintenance cost:
Maintenance cost = IDR 25,535,475 per machine per year
52
Calculation of saving from direct labor reduction:
Labor cost of manual taping process = IDR 2,781,000,000 per year Labor cost of Alternative 3 = IDR 1,156,970,588 per year
Saving from labor reduction = 2,781,000,000 – 1,156,970,588 = IDR 1,624,029,413 per year
Calculation of overtime cost elimination:
Overtime cost = IDR 5,457,204 per month
= 5,457,204 x 12 months = IDR 87,315,264 per year
53
Table 4. 16 Projected Cash Flow of Alternative 3 (in IDR)
Time Horizon 1 2 3 4 5 6
Year 2017 2018 2019 2020 2021 2022 2023
Investment Cost
Investment 2,550,112,317
Operational Cost
Direct labor 1,214,819,117 1,275,560,073 1,339,338,076 1,406,304,980 1,476,620,229 1,550,451,241
Material 1,648,913,254 1,731,358,916.44 1,817,926,862.26 1,908,823,205.37 2,004,264,365.64 2,104,477,583.92
Energy 62,370,000 65,488,500.00 68,762,925.00 72,201,071.25 75,811,124.81 79,601,681.05
Total Operational Cost 2,926,102,371 3,072,407,489 3,226,027,864 3,387,329,257 3,556,695,720 3,734,530,506
Maintenance Cost 294,934,736 309,681,473.06 325,165,546.72 341,423,824.05 358,495,015.25 376,419,766.02
TOTAL COST 2,550,112,317 3,221,037,107 3,382,088,962 3,551,193,410 3,728,753,081 3,915,190,735 4,110,950,272
Labor Reduction 1,705,230,883 1,790,492,427 1,880,017,049 1,974,017,901 2,072,718,796 2,176,354,736
Overtime cost elimination 68,760,770 72,198,808.92 75,808,749.37 79,599,186.83 83,579,146.18 87,758,103.48
54
Time Horizon 7 8 9 10 11 12
Year 2024 2025 2026 2027 2028 2029
Investment Cost
Investment
Operational Cost
Direct labor 1,627,973,803 1,709,372,493 1,794,841,117 1,884,583,173 1,978,812,332 2,077,752,949
Material 2,209,701,463.12 2,320,186,536.28 2,436,195,863.09 2,558,005,656.24 2,685,905,939.06 2,820,201,236.01
Energy 83,581,765.11 87,760,853.36 92,148,896.03 96,756,340.83 101,594,157.87 106,673,865.77
Total Operational Cost 3,921,257,031 4,117,319,882 4,323,185,877 4,539,345,170 4,766,312,429 5,004,628,050
Maintenance Cost 395,240,754.32 415,002,792.03 435,752,931.64 457,540,578.22 480,417,607.13 504,438,487.48
TOTAL COST 4,316,497,785 4,532,322,674 4,758,938,808 4,996,885,749 5,246,730,036 5,509,066,538
Labor Reduction 2,285,172,473 2,399,431,096 2,519,402,651 2,645,372,784 2,777,641,423 2,916,523,494
Overtime cost elimination 92,146,008.66 96,753,309.09 101,590,974.55 106,670,523.27 112,004,049.44 117,604,251.91
55
Using 10.5% of WACC, annual total cost and benefit data are calculated into present value. The summary of NPV calculation is as follows.
Table 4. 17 NPV Calculation of Alternative 3 (in IDR)
Time Horizon Year Present Value of Cost Present Value of Benefit
2017 2,550,112,317
1 2018 2,914,965,708 1,605,422,311
2 2019 2,769,876,917 1,525,514,413
3 2020 2,632,009,740 1,449,583,831
4 2021 2,501,004,730 1,377,432,600
5 2022 2,376,520,332 1,308,872,606
6 2023 2,258,231,990 1,243,725,101
7 2024 2,145,831,302 1,181,820,232
8 2025 2,039,025,219 1,122,996,600
9 2026 1,937,535,276 1,067,100,842
10 2027 1,841,096,869 1,013,987,225
11 2028 1,749,458,563 963,517,273
12 2029 1,662,381,440 915,559,400
NPV 29,378,050,403 14,775,532,435
4.2.3 Incremental Benefit-Cost Analysis
Incremental benefit-cost analysis is conducted by using equivalent uniform annual cost (EUAC) approach. All NPV data of manual and automated processes are calculated into annual worth, then cost per unit and benefit per unit can be obtained. These data will become the input for incremental benefit-cost analysis. Formula to calculate annual worth is as follows.
( ⁄ )
Table below shows results of annual worth calculation for manual and automated alternatives.
Table 4. 18 Annual Worth of Manual and Automated Alternatives (in IDR)
Manual Alternative 1 Alternative 2 Alternative 3