THE EFFECTS OF ADDING 1 M NaOH, KOH AND HCl SOLUTION
TO THE FRAMEWORK STRUCTURE OF NATURAL ZEOLITE
Supandi Suminta, Supardiand Parikin
Center for Nuclear Industry Materials Technology, National Nuclear Energy Agency Kawasan Puspiptek Serpong Tangerang BANTEN
e-mail: [email protected]
ABSTRACT
Zeolite structures contain (-Si-O-Al-) linkages that form surface pores of uniform diameter and enclosed regular internal cavities and channels of discrete size and shapes. This, however, also depends on the chemical composition and crystal structure of the specific zeolite involved. The main purpose of this study is to investigate the changing of the structural parameters and increasing of cationic exchange and molecular seaving properties. Adding 1M NaOH, KOH and HCl solution to the natural Lampung zeolite built a Na-zeolite, K-zeolite and H-zeolite using ion exchange metods. An identification of the framework of mineral structure of Na-zeolite, K-zeolite and H-zeolite were carried out by Reitveld methods and Gaussian Fitting analysis. X-ray diffraction intensity of Na-zeolite, K-zeolite and H-zeolite were measured by an X-Ray Diffractometer (XRD) at PTBIN-BATAN Indonesia. The refinement of Clinoptilolite and Mordenite phases were carried out and the results of refinement shows that the Na-zeolit, K-zeolite and the control zeolit consisted of Clinoptilolite phase (space group C2/m HEU No.12, Bravais lattice is Base-Centered and crystal system is monoclinic), and the lattice parameters are a = 17,75(8) Å, b = 17,86(2) Å and c = 7,604(6) Å for Na-zeolite and a = 17,78(1) Å, b = 17,97(7) Å and c = 7,45(6) Å for K-zeolite. Fitting analysis was done to the Bragg peaks of diffraction pattern (raw data). The values of 2θ angle and FWHM for the Bragg reflections have decreased in comparison to the control zeolite. The Lampung zeolite are polycrystalline of clinoptilolite phase in monoclinic. The crystalline quality of Lampung zeolite significantly depends on substance and concentration of NaOH, KOH and HCl . The strain (η) of the CONTROL Zeolite, Na-zeolite, K-Na-zeolite, and H-zeolite are 0.095, 0.085, 0.420 and 1.535 respectively. While the crystal size (D) are 62 nm, 71 nm, 102 nm, and 14 nm respectively. It is concluded that the chemical method process of exposing natural zeolite to base increases the crystal size, due to decreasing microstrain, while into acid decreases crystal size, due to increasing microstrain. Hence, The Lampung zeolite structure is damaged due to exposure to acid.
Keywords: X-ray diffraction, microstrain, clinoptilolite, Rietveld method, Gaussian Fitting analysis
INTRODUCTION
230
linked to build up the entire framework. In different zeolites the polyhedral units may be equidimensional, sheet like, or chainlike. The aluminosilicate framework of a zeolite has a negative charge, which is balanced by the cations housed in the cagelike cavities. Zeolites have much more open, less dense structures than other silicates; between 20 and 50 percent of the volume of a zeolite structure is voids. Silicates such as zeolites that have three-dimensional frameworks of tetrahedral are termed tectosilicates. Besides the zeolites, other tectosilicates include quartz and feldspars.
Crystal structures of zeolites which are periodically ordered in 3 dimensions are ordered structures (regular crystalline solids). Statistically disordered structures show periodic ordering in dimension less than 3, i.e. 2, 1 or 0 dimensions. This phenomenon is also called stacking disorder of structurally Periodic Building Unit (PerBU)[1]. In this sense we exclude chemical disorder, e.g. different cation on a particular site, and dynamic disorder, e.g. rotational disorder of template molecules. We also exclude structural disorder within cavities of zeolite frameworks. Consequently, disordered structures are built from periodic 0- 1- 2-dimensional perBU’s which are built from smaller unit, e.g. translation, rotation. The relative orientation of neighboring PerBU’s can be described by stacking modes between the parallel aligned PerBU’s. The stacking mode contains the symmetry element which relates the PerBU’s to each other including lateral translation components given in fraction of the basis vectors of the invariant PerBU. Crystal structures built from PerBU’s are called end-member structures if periodic ordering is achieved in all three dimensions. Disordered structures are those where the stacking sequence of the PerBU deviates from periodic ordering up to statistic stacking sequences. All structures built from the same PerBu, ordered end-member structures and disordered and disordered intermediates belong to the same family of structure type.
The objectives of these study are to determine the crystal structure phase, crystal size and micro-strain of Lampung zeolite with various chemical solution that carried by the natural zeolites to allow appropriate treatment and final utilization of natural zeolites.
EXPERIMENTAL METHOD
Reflux of natural Lampung zeolite was carried out at 150 °C for 6 hours with distilled water. The Na-Zeolite, K-Zeolite and H-Zeolite samples were prepared by using (10 ml/mn) of 1 M NaOH, KOH and HCl solution through the zeolite powder. The powder was placed inside a 1 Liter glass column during the procedure. Following the activation the zeolites was further treated until pH reached neutrality. The powder was then dried through heating at 105 °C. Step counting (0.02 step) of X-ray diffraction measurements were carried out to check the quality of the Na-Zeolite, K-Zeolite and H-Zeolite samples. X-ray diffraction measurements were performed for all zeolite samples by using a Philips instrument at PTBIN-BATAN Indonesia.
RESULTS AND DISCUSSION
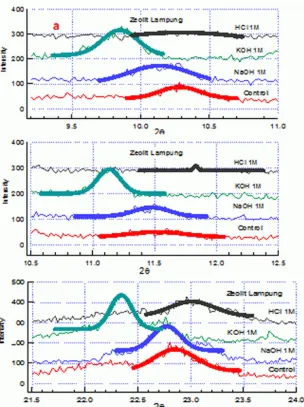
Figure 1 shows the X-ray diffraction pattern with three different chemical solutions and one as a control (1M NaOH, KOH and HCl and control). There was Bragg scattering peaks in the zeolite samples respectively plotting in the figure.
231 Bragg peak in Na-zeolit, K-zeolit, H-zeolit and M-zeolite at three different chemical solutions and at three different peaks are listed in Tabel 1 and 2 and also Figure 1 and 2, respectively
Figure 1: X-ray diffraction pattern of Lampung Zeolite with four different chemical solution: HCl 1M (H-zeolite), KOH 1M (K-(H-zeolite), NaOH (Na-zeolite) and Control (M-zeolite)
232
Table 1 shows the data of Bragg reflection which demonstrates that for the materials of H-zeolite, K-zeolite, Na-zeolite and Control, the value of 2θ angle and FWHM for the Bragg reflections on the peak 1, peak 2 and peak 3 have decreased in comparison to the Control. These changes are caused by adding processes.
Table 1: Bragg peak position (θ), and FWHM data of Lampung zeolite, with various Solution of HCl 1M, KOH 1M, NaOH 1M dan CONTROL
Lampung Zeolit Peak 2θ θ FWHM (β) -
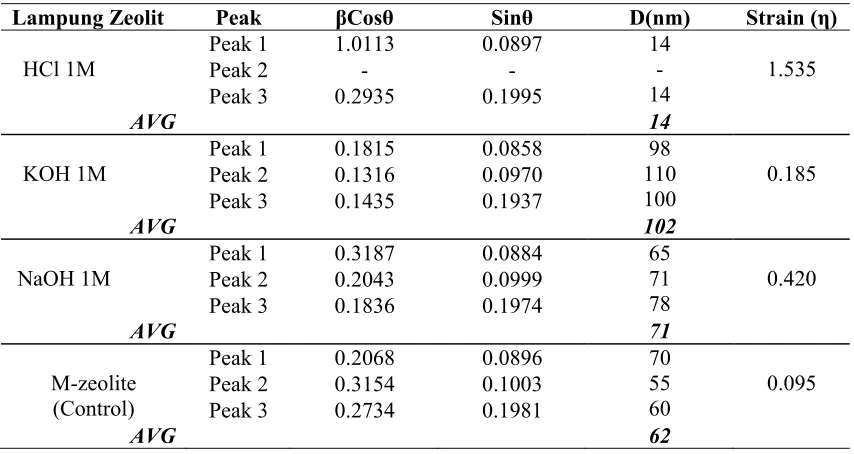
Table 2: Data of crystal size (D) and microstrain of Lampung zeolite with various chemical solution.
Lampung Zeolit Peak βCosθ Sinθ D(nm) Strain (η) zeolite (Control) to calculate cryatal size (D) and microstrain (η). The lattice strain of Clinoptilolite Crystal in the H-zeolite, K-zeolite, Na-zeolite and M-zeolite respectively were estimated through the Hall’s equation [2,3] which is expressed as:
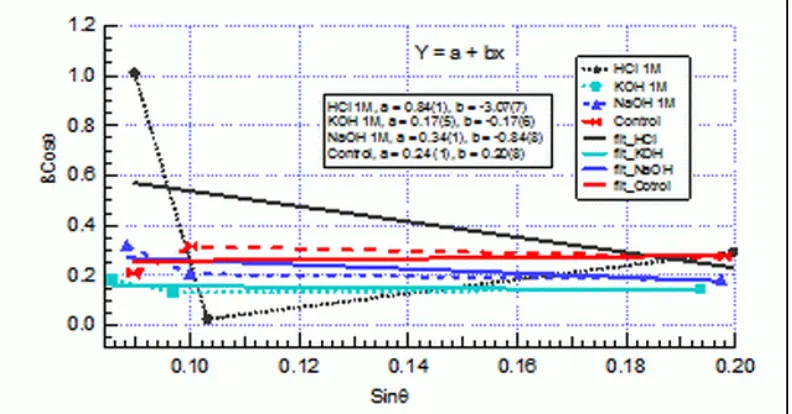
233 where β is the half-width of a given diffraction peak, is the wavelength of X-ray used, η is a measure of the lattice strain[4,5], θ is the Bragg angles and D is the crystallite size. Figure 3 shows the relation between βCosθ and Sinθ for peak 1, peak 2 and peak 3 diffraction peaks of clinoptiloite phase in the Lampung zeolite on H-zeolite, K-zeolite, Na-zeolite and M-zeolite (Control).
The values of lattice strain, η in Eq. (1), are obtained from the slopes of the plot. It is apparent that H-zeolite has larger lattice strain compared to the K-zeolite, Na-zeolite and M-zeolite. Such a large lattice strain of M-zeolite is caused by chemical procsses at the cavity of zeolite and zeolite structure is damaged due to exposure to acid. The crystallite size of K-zeolite, Na-zeolite H-zeolite and M-zeolite are estimated from the calculation of Hall’plots, i.e Eq. (1).
The lattice strain, η value is large on HCl 1 M and decrease with NaOH 1M, KOH 1M and M-zeolite. η value are 0.095 (M-zeolite), 0.185 (KOH), 0.420 (NaOH) and 1.535 (HCl) respectively. While crystal size, D value is large about 102 nm on KOH 1M and decrease with HCL 1M, NaOH 1M and M-zeolit respectively. D values are 62 nm (M-zeolite), 71 nm (Na-zeolite), 102 nm (K-zeolite), and 14 nm (H-zeolite) respectively.
Figure 3: Hall’s plot for diffraction Bragg peaks of Lampung Zeolit at four different chemical solution, HCL 1M (H-zeolite), KOH 1M (K-zeolite), NaOH 1M (Na-zeolite and Control (M-zeolite)
CONCLUSION
234
REFERENCES
[1]. http://www.zeoinc.com/zeolite.shl, 1/6/2008
[2]. B.D. Cullity., and S.R. Stock, Elements of X-ray Diffraction, Third Edition, Prentice Hall, Upper Saddle River,New Jersey 07458, 2001.
[3]. T.Sutomu Minami, Toshiharu Saito, and Masahiro Tatsumisago, Solid State Ionic, 86-88, 415 (1996).
[4]. M. Tatsumisago, A. Taniguchi and T. Minami, J. Am, Ceram.Sos., 76, 235 (1993).