doi:10.17265/2162-5263/2017.06.006
Characterization of the Gold Ore to Acquire an Optimum
Degree of Liberation
Waterman Sulistyana Bargawa and Eko Hardiyanto
Department of Mining Engineering, University of Pembangunan Nasional Veteran Yogyakarta, Yogyakarta 55283, Indonesia
Abstract: Gold ore processing is often ineffective in obtaining gold metal. Various methods have been successfully developed on an industrial scale, but small-scale gold mines are often problematic. The problem of inefficiency of processing is caused by gold ore characterization and evaluation of gold ore preparation process is not implemented. In this study, the conditions of gold ore deposits have a thin thickness (vein). These gold ore deposits have an economic value if they are developed by traditional gold mining. The objective of the research is to identify and characterize gold ore as well as to analyze the optimum condition to obtain the perfect gold mineral liberation degree. Research methods include characterization of gold ore geology, sampling for test preparation using rod mill (amalgamation), gold mineral liberation using time variables and number of rods. After the grinding process, grain size analysis is performed with various mesh sizes, and the analysis of each fraction uses a polarization microscope. The results show that gold ore minerals are associated with pyrite, chalcopyrite, galena and gangue minerals. Gold minerals are fully liberated at a certain size. The results of this research are very useful for the gold ore grinding process to obtain an efficient gold processing.
Key words: Characterization, gold ore, grinding, size distribution, grinding time, rod, degree of liberation.
1. Introduction
Thin-sized gold ore deposits containing high grade gold are often inefficient if the processing is carried out
on an industrial scale. Artisanal and small-scale mining became the community’s choice to develop the gold ore
resource. The gold processing model needs to be developed so that the environmental damage can be mitigated [1]. At present, the community gold
processing has not shown effective results economically [2]. Some problems become obstacles in
developing the people’s mining business. The problem is the limited knowledge of how the gold ore genesis and the geological model of the gold ore vein are.
Artisanal gold ore mining pursues only the gold ore vein direction, making it problematic when the golden
ore veins are gone [3, 4]. In addition, the very simple gold ore processing technology causes recovery of the gold metal is not optimal [5]. Generally, the gold ore
material resulting from the mining activities is reduced
Corresponding author: Waterman Sulistyana Bargawa, Ph.D., senior lecturer, research field: mine exploration.
in grain size manually, and then the material is fed into the amalgamator for processing [6]. Using mercury in
the processing of gold causes potentially pollution to the environment [7]. In addition, tailings from gold processing have high grades. This phenomenon shows
that the processing of gold is not appropriate so that gold recovery is very low.
The potential of gold ore resources with the character of thin vein and high gold grades is attractive to be developed with small-scale mining. Early identification
and characterization have been carried out by Idrus, A., et al. [8] in the research area. Gold ore deposits are
epithermal, low sulfide, formed by hydrothermal solutions and filled in rock fractures. The occurrence of gold ore is associated with quartz-adularia alteration,
carbonate, sericite in low sulfide environments and relatively high silver and gold ratios. Ore minerals are
characterized by the formation of electrons, silver sulfides, sulfate salts and sulfide base metals. This research continues the advanced characterization of
gold ore geology to determine the appropriate preparation method for obtaining precious metals.
Developing the gold mining business of the people is expected to improve the welfare of the community with
the knowledge of effective gold ore preparation. This technical study of gold ore processing becomes attractive. The case study was conducted in
Paningkaban Village, Banyumas District, Central Java Province of Indonesia. The mineralization found in the
research area is relatively associated with quartz veins (vein or veinlets), in Halang Sandstone Units, and on the intrusion bodies present in the study area.
2. Objective
The mineralization of ore found in the research area is sulfide minerals i.e. pyrite, chalcopyrite, sphalerite, galena and arsenopyrite. In general, gold ore processing
in small-scale mining uses an amalgamator, and is less precise in the gold ore preparation stage. Research on
the degrees of gold mineral liberation through the milling process stage is necessary. The objectives of
this study were: (a) analyzing the geological characterization of gold ore vein deposits; (b) analyzing the preparation process for assessing the gold mineral
grain size distribution; (c) calculating the degrees of liberation of the gold miner, resulting from the process
of sieving; (d) determining the number of steel rods in the preparation process using a grinding mill to obtain
gold mineral liberation degrees; (e) obtaining time and number of steel rods for optimal conditions of gold
mineral liberation degrees.
3. Methods and Material
The research was conducted in several stages of activity: literature study, gold ore sampling, sample
preparation, laboratory test and data processing. Preparation activities of gold ore samples were conducted through the crushing stage using the jaw
crusher, milling using rod mill and sieving using vibration sieve, mineralogical analysis (petrography,
ore microscope) and chemical analysis of gold grade. Mineralogy analyzes were conducted to determine the minerals found in the sample, the mineral grain size
using a microscope while the gold ore chemical analysis was conducted to determine the metal mineral grade.
Analysis of the degree of liberation is the activity undertaken to obtain a percentage of the total number
of perfectly liberated minerals, which are present in the mineral (free and bonded minerals). The formulation of degrees of liberation is modified from Oki, T., et al. [9]
namely:
Degree of liberation (%)=no. of perfectly liberated mineral grainsno. of grains of the mineral x 100%
Using Minitab V.16 software, statistical data
processing is used to evaluate the optimum condition of
the milling process. Statistical analysis was performed
to evaluate the effect on the degree of gold mineral
steep hillsides having a relatively northeast-southwest
direction with a weak to strong tendency. Based on geological research, the structure before and during
mineralization is the joint extension and horizontal fault. The geological structure controls the gold ore
mineralization. Based on the vein structure and texture, the four stages of mineralization development are: (a) the initial stage (fluid breccia and quartz vein); (b) the
mid-stage (base metallic carbon); (c) the final stage (end of carbonate); and (d) enrichment. The gold
mineralization in the research area originates primarily in the mid and late stages, especially associated with cockade, crusty form, bladed carbonate base metal
study area are categorized as mineralization type of gold base metal. Vein structures such as massive,
swarm and small angle vein, are also stockwork and vein scattered in diatreme breccia. The ore minerals
consist of gold electrum, silver, pyrite, chalcopyrite, sphalerite, galena, arsenopyrite, caulkite, marcasite, covelite and tenantite commonly associated with
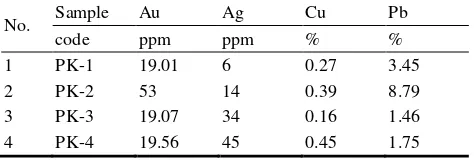
argillic alteration. High gold grade is found in a vein composed of carbonate and slight quartz. Table 1
shows the gold grade and some of the metal minerals from the test results.
The microscope observation shows that gold
minerals are associated with sulfide minerals such as pyrite, chalcopyrite, galena and sphalerite minerals.
Research area is the type of deposition of low sulfide epithermal. The gold ore grade generally ranges from 19.01-53.00 ppm Au. Traditional processing produces
tailings with a high gold grade of 5.00-10.21 ppm Au [10], the recovery of gold < 60% and low degree of
liberation. These data show the inefficient of gold ore processing. Based on the problem, this research
requires an optimal sample preparation step.
4.2 Mineralogy Analysis Results
Analyses of mineral liberation, shape and size of gold grains using polarization microscopy were
performed on the samples. Fig. 1 shows the results of the analysis of the polishing incisions on the samples. Based on the analysis using the microscope, it shows
minerals of the samples consist of pyrite, chalcopyrite, quartz and gold ore minerals.
4.3 Result of Sieve Analysis and Degree of Liberation
Sieve analysis was performed to determine the weight distribution per grain size fraction using ASTM
(American Society Testing and Material) standard sieve with dry method. The degree of liberation was
performed to analyze the liberation of gold granules and other minerals using the polarization microscope of
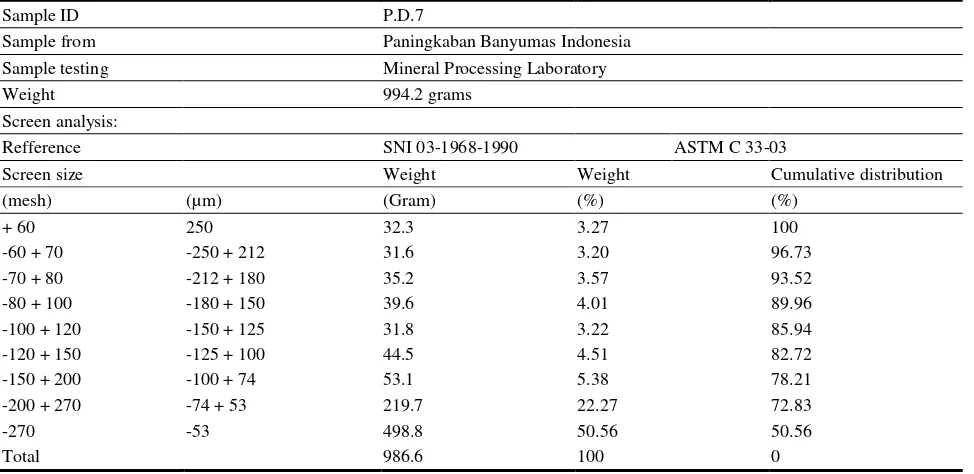
each sample tested on each fraction of the sieving results. Table 2 shows the results of a sieve analysis with the sample identity of P.D.7. The weight gain
percentage of the coarse fraction (+ 60 mesh) was 3.27% and the 70 mesh to 200 mesh fraction showed an
almost equal distribution of 3.20-5.38%. At a 270 mesh fraction, weight percent increased significantly by 22.27-50.56%. This shows that the fine fraction is
associated minerals. Whereas, the degree of liberation of 0% indicates that the gold mineral is still bound to
the mineral association. greater, so it has a greater chance of contact between
the granular surface and the solution. This condition has an impact on increase of gold metal recovery. Gold
grade and other metals in the tailings will be reduced. But if the mineral grain size is too fine, then the process becomes ineffective. Based on the efficiency
Table 1 Gold content and other metal minerals.
Fig. 1 Polish incision from sample PK-3.
Table 2 Result of screen analysis with sample P.D.7.
Sample ID P.D.7
Sample from Paningkaban Banyumas Indonesia
Sample testing Mineral Processing Laboratory
Weight 994.2 grams
Screen analysis:
Refference SNI 03-1968-1990 ASTM C 33-03
Screen size Weight Weight Cumulative distribution
(mesh) (µm) (Gram) (%) (%)
+ 60 250 32.3 3.27 100
-60 + 70 -250 + 212 31.6 3.20 96.73
-70 + 80 -212 + 180 35.2 3.57 93.52
-80 + 100 -180 + 150 39.6 4.01 89.96
-100 + 120 -150 + 125 31.8 3.22 85.94
-120 + 150 -125 + 100 44.5 4.51 82.72
-150 + 200 -100 + 74 53.1 5.38 78.21
-200 + 270 -74 + 53 219.7 22.27 72.83
-270 -53 498.8 50.56 50.56
Total 986.6 100 0
Sample number: 2; Sample code: PK-3;
Description: Rock sample color is white to grey, massive texture, crystal mineral size 0.05-0.8 mm, gangue mineral (88%) carbonate mineral, pyrite mineral (3%), gold mineral (< 1%), galena (2%) and chalcopyrite (6%).
Mineral description:
Pyrite (Py) : yellow color, euhedral form, size 0.1-1 mm, dark interference, isotropic.
Aurum (Au) : yellow gold color, euhedral form, prismatic, size 0.03 mm, bright interference, isotropic.
Galena (Gn) : white silver color, subhedral form, one way hemisphere, size 1 mm, dark interference, isotopic.
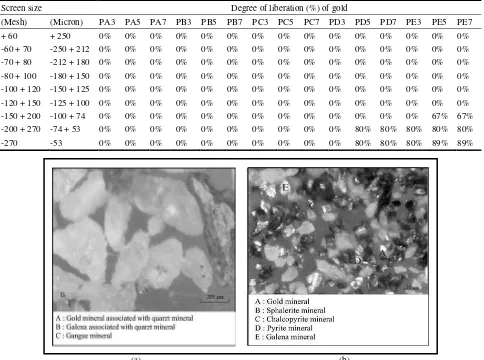
Table 3 Degree of liberation at size fraction.
Screen size Degree of liberation (%) of gold
(Mesh) (Micron) PA3 PA5 PA7 PB3 PB5 PB7 PC3 PC5 PC7 PD3 PD5 PD7 PE3 PE5 PE7
+ 60 + 250 0% 0% 0% 0% 0% 0% 0% 0% 0% 0% 0% 0% 0% 0% 0%
-60 + 70 -250 + 212 0% 0% 0% 0% 0% 0% 0% 0% 0% 0% 0% 0% 0% 0% 0% -70 + 80 -212 + 180 0% 0% 0% 0% 0% 0% 0% 0% 0% 0% 0% 0% 0% 0% 0% -80 + 100 -180 + 150 0% 0% 0% 0% 0% 0% 0% 0% 0% 0% 0% 0% 0% 0% 0% -100 + 120 -150 + 125 0% 0% 0% 0% 0% 0% 0% 0% 0% 0% 0% 0% 0% 0% 0% -120 + 150 -125 + 100 0% 0% 0% 0% 0% 0% 0% 0% 0% 0% 0% 0% 0% 0% 0% -150 + 200 -100 + 74 0% 0% 0% 0% 0% 0% 0% 0% 0% 0% 0% 0% 0% 67% 67% -200 + 270 -74 + 53 0% 0% 0% 0% 0% 0% 0% 0% 0% 0% 80% 80% 80% 80% 80%
-270 -53 0% 0% 0% 0% 0% 0% 0% 0% 0% 0% 80% 80% 80% 89% 89%
(a) (b)
Fig. 2 Mineral appearance on microscope photograph of Sample P.A.5 fraction + 60 mesh (a) and sample P.D.7 fraction -200 + 270 mesh (b).
aspect, the rate of using chemical solution in the treatment is influenced by the particle size. If the
particle size is larger, then the process of gold processing will increase the consumption of chemicals in the extraction process. Conversely, if the grain size
of the material is smoother, the use of chemicals is not effective anymore. Based on the most optimal grain
size, the use of chemicals can be determined, so that the potential for environmental pollution can be mitigated.
Table 4 Variance analysis of grinding process variables to degree of liberation.
Factor Type Levels Values
Rods fixed 3 3; 5; 7
Time fixed 5 0.5; 1; 2; 4; 8
Analysis variance for degree of liberation
Source DF
(Degree of freedom) SS
(Sum of square)
MS
(Mean square)
F
(F test statistic)
P (Formed test of significant)
Rods 2 0.17062 0.08801 1.37 0.081
Time 2 1.13076 0.56538 8.83 0.034
Error 4 0.25604 0.06401
Total 8 1.56282
Fig. 2(a) shows that the gold mineral still associate
with quartz minerals. Fig. 2(b) shows gold mineral has been liberated from impurity minerals such as pyrite, chalcopyrite, quartz, galena and sphalerite.
4.5 Optimum Condition of the Grinding Process
The Minitab-16 software is used to analyze the optimal conditions of the preparation process. To evaluate the effect on gold mineral liberation degree,
authors analyzed the statistics using two variables in
the grinding process i.e. the number of rod variable and
the response time to the degree of liberation.
Based on the Anova test results, when P value is less than 0.05 (< 5%), the time significantly affects the
degree of liberation for gold minerals, while the number of rods is not significantly influenced. The
coefficient of determination R2 indicates the accuracy of this model, and R2 reaches 83.62%. These results show that 83.62% of the variable degrees of liberation
are influenced by the variable number of rods and time.
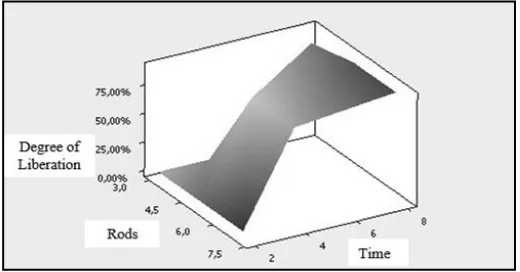
Fig. 3 The influence of the number of rod and time on the degree of liberation.
Fig. 3 shows the effect of time and the number of rod
in grinding on the percentage of degrees of gold mineral liberation based on experimental design. In the condition of grinding time of 4 hours with 5 rods, it
showed significantly on the change of degrees of gold mineral liberation, while there was no significant
change in the subsequent period.
5. Conclusions
Based on the results of the study, the conclusions and suggestion are as:
Characterization of gold ore deposits and preparation
of gold ore grain size can be used to determine the
liberation of gold ore from impurities minerals so as to
increase the recovery of gold metal;
Gold ore deposits with low epithermal sulfide type
are associated with sulfide minerals such as pyrite
minerals, chalcopyrite, galena and sphalerite. Gold ore
minerals can generally be separated at a size of -200
mesh (-0.074 mm) fraction, with a degree of liberation
of 80%;
The result of analysis of sieve on optimum condition
of grinding obtained percent pass in fraction of -200
mesh size equal to 76.74%. The grinding process using
time variables and the number of rods affect the degree
of liberation of 83.62%. The analysis results show that
the optimum condition of grinding to obtain high
degree of liberation is 4 hours using 5 steel rods; The gold mineral particles size with a high degree of
liberation will increase the recovery of gold metal and reduce the consumption of chemical solutions for
processing, thereby reducing the potential of environmental pollution;
Further research can be continued on the gold ore
concentration by not using mercury, so that method can improve the recovery of gold metal and there is
environmental sustainability.
References
[1] Drace, K., Kiefer, A. M., and Veiga, M. M. 2016.
Potential Health Effects and Environmental Justice.” Current Environmental Health Reports 3 (4): 443-9. [2] Krisnayanti, B. D., Vassura, I., Asmara, M. D., Ekawanti,
A., and Suheri, H. 2016. “Analysis of Artisanal Small-scale Gold Mining Sector in West Sumbawa Regency, Indonesia.” Journal of Health & Pollution 6 (12): 26-33. [3] Hoedoafia, M. A., Cheabu, B. S. N., and Korang, V. 2014.
“The Effects of Small Scale Gold Mining on Living Conditions: A Case Study of the West Gonja District of Ghana.” International Journal of Social Science Research 2 (1): 151-64.
[4] Kessey, K. D., and Arko, B. 2013. “Small Scale Gold Mining and Environmental Degradation, in Ghana: Issues of Mining Policy Implementation and Challenges.” Journal of Studies in Social Sciences 5 (1): 12-30. [5] Abbey, C. E., Nartey, R. S., Al-Hassan, S., and
Amankwah, R. K. 2014. “Direct Smelting of Gold Concentrates, a Safer Alternative to Mercury Amalgamation in Small-scale Gold Mining Operations.” AIJRSTEM 5 (2): 174-9.
[6] Appel, P. W. U., and Na-Oy, L. D. 2014. “Mercury-free Gold Extraction Using Borax for Small-scale Gold Miners.” Journal of Environmental Protection 5 (06): 493.
[7] Azimi, S., and Moghaddam, M. S. 2013. “Effect of Mercury Poluttion on the Urban Environment and Human Health.” Environment and Ecology Research 1 (1): 12-20. [8] Idrus, A., Fahmi, H., Warmada, W., Aziz, M., Kolb, J., and Meyer, M. 2015. “Geology and Ore Mineralization of Tertiary Sedimentary Rock Hosted LS Epithermal Gold Deposit at Paningkaban, Banyumas District Central Java, Indonesia.” In SGA Biennial Meeting Proceedings, 299-302.
[9] Oki, T., Yotsumoto, H., and Owada, S. 2004. “Calculation of Degree of Mineral Matter Liberation in Coal from Sink-Float Separation Data.”Minerals Engineering 17 (1): 39-51.