Moment Invariant Features Extraction for Hand Gesture
Recognition of Sign Language based on SIBI
Angga Rahagiyanto, Achmad Basuki, Riyanto Sigit
Graduate School of Informatics and Computer Engineering Politeknik Elektronika Negeri Surabaya
Jl. Raya ITS Sukolilo Surabaya 60111, Indonesia Telp: 6231 5947280 Fax: 6231 5946114
E‐mail: [email protected], {basuki, riyanto}@pens.ac.id
Abstract
SIBI in Indonesian known as standard of Indonesian sign language. To help deaf people Myo Armband becomes an immersive technology for communication each other. The problem on Myo sensor is unstable clock rate. It causes different length data for the same period even on the same gesture. This paper proposes Moment Invariant Method to extract the feature of sensor data from Myo. This method reduces the amount of data as the result is same length of data. The implementation of this method is the user‐dependent feature according to the characteristics of Myo Armband. We tested for gesture of alphabet A to Z based on SIBI (Indonesian Sign Language) with static and dynamic movements. There are 26 classes of alphabet and 10 variants. We use min‐max normalization for guarantying the range of data and K‐Nearest Neighbor method to classify dataset. Performance analysis with leave‐one‐out‐validation method produced an accuracy of 82.31%.
Keywords: SIBI sign language, static movement, dynamic movement, Myo Armband sensors, feature extraction, Moment Invariant. their communication [2] as the Human Computer Interaction (HCI) system in various fields, one of them is sign language. The development of these technologies obtains good communication between human and machine [3] as well as communication for normal people with deaf people.
the movement of static and dynamic movement. Static movement is how to hand movement which refers to the shape of the hand and fingers were silent within a specific time such as sign language for the numbers. The key to the static movement is a pattern or shape of the hand and fingers. Dynamic movement is a series combination of all types movement that form a pattern of movement such as sign language for the word [5]. The key to dynamic motion movement in recent years has attracted the attention of many researchers to develop HCI of sign language. A wide varieties approach both for the movements of static and dynamic motion. The tool used by many researchers to find the exact model is able to recognize a static or dynamic movements quickly and accurately. This modeling any approaches such as statistical modeling approach [6], [7] computer vision [8], [9] and pattern recognition [10], [11] the image processing [12]–[14]. Each modeling has advantages and disadvantages.
This research uses pattern recognition approach with Myo Armband tool. It is use dictionary of sign system for Indonesian language known as SIBI (Sistem Isyarat Bahasa Indonesia). The term SIBI is a national standard language in Indonesia. Myo Armband is a tool in the form of armbands made by Thalmic Labs by identifying gestures of displacement of the arm muscles [15]. Myo Armband uses five sensors; accelerometer, gyroscope, orientation, orientation‐Euler and electromyography (EMG). It is also read the electrical muscle activity and the moving or rotating activity of the hand [16]. Each sensor has a different data scale and size because of clockrate. We proposed a new method in extraction feature to improve the datas. Those are raw data and data mining method to prepare clean data as training data for learning. The first step, begin to make automatically started and ended condition record the raw data from performed signs. The second step, we use extraction feature algorithm to make feature vectors models from data raw. It is using Moment Invariant methods in every sensor Myo. The third step, we use preprocessing from data feature vectors model use Min‐Max method normalization. The last step, we use k‐Nearest Neighbour (kNN) as classification algorithms with Leave‐one‐out (LOO) as validation sampling. Furthermore, this paper will give the exploration of fact and knowledge from hand gesture recognition data feature vectors.
2. RELATED WORKS
voluntary contraction (MVC) value. For feature extraction using two different methods there are: In the temporal domain, the Mean Absolute Value (MAV) and Root Mean Square (RMS) were used and in the frequency domain, coefficients of an Autoregressive Model were used. In the classification process, each movement in the experimental protocol belongs to a 5 class, there are: wrist flexion, wrist extension, forearm pronation, forearm supination, and resting. The results show that it was obtained a higher number of motion class correctly classified with the algorithm using features obtained from EMG signals and kinematics information than the algorithm using features obtained only from EMG signals.
Z. Arief, et al [18] from Graduate School of Engineering Technology Politeknik Elektronika Negeri Surabaya (PENS), Indonesia. Their research compares the 5 extractions feature of 8 pod Electromyography (EMG) signal using MYO armband. The purpose is the representation and information from signal of embedded sensors that are necessary to minimize complexity of implementation and reduce the cost of information processing. The methods of time series extraction feature that evaluated are Mean Absolute Value (MAV), Variance (VAR), Willison Amplitude (WAMP), Waveform Length (WL), and Zero Crossing (ZC). The variety of hand movements are fist, rest, half‐fist, gun‐point, and mid‐finger fold. In their research performs four experiments with same subject, from one experiment will generate 8x5=40 data. From all four experiments show that MAV (44.392; 41.033; 45.414; 43.136) is always gives the best performance than another because MAV is always having lower Total Point (TP).
J. Abreu, et al [19] from Recife, Brazil. Their research proposed about recognition of sign language gestures from the Brazilian Sign Language (LIBRAS) alphabet to improve communications between the deaf and the hearers. This work evaluates the usage of Electromyogram (EMG) data provided by the Myo armband. Using 20 stationaries letter gestures from the LIBRAS alphabet. From among the 26 LIBRAS letters, they exclude the letters H, J, K, X, Y and Z. There are two preprocessing steps, first to perform a full‐ wave rectification on the training sets by inverting the signs of the negative components, and second to compute the mean of each 50 training samples. The classification was performed by binary Support Vector Machines (SVMs) trained with a one‐vs‐all strategy. The worst accuracy results due to either the wrist or finger positions required from letter gestures, namely F (8%), M (8%), P (8%), T (4%) and U (5%). Moreover, letter gestures that could be well performed with extra strength, such as L (77%), R (91%), S (46%) and W (95%), but some letters presented very good results due to having gestures very distinct from others; those are E (76%), L (77%), R (91%) and W (95%).
recognition armband (Myo Armband). The approach is to use a combination of gestural data (Electromyography) that measure the muscle activity and spatial data (accelerometer, gyroscope & orientation) that measures hand movements for the sign recognition. There are 150 data samples gathered for each selected sign. Altogether 750 data samples were collected as the primary dataset. And methods for Feature extraction is use Mean Absolute Value (MAV) & Standard Deviation (SD). The classification method uses Artificial Neural Network (ANN) to identify both linier and nonlinier of captured data set. The results explain that was no significant difference from the results in study 01 for gender differentiation and the ANNs trained using both subject samples were given higher accuracies. In the study 02, the ANN trained using only spatial features provided 88.6% overall accuracy, only gestural features gave 77.5% and the combination of those 2 features offered 94.4% overall accuracy. Overall, person dependent study gave 100% accuracy where person independent study obtained 94.4% accuracy as the final outcome.
3. ORIGINALITY
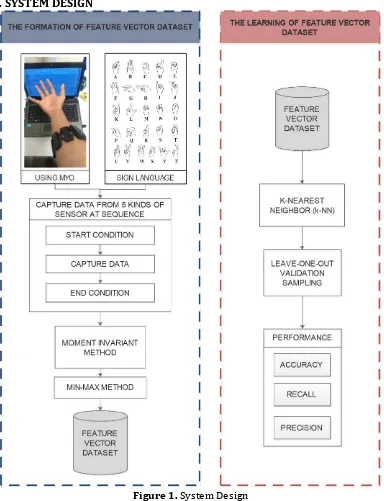
4. SYSTEM DESIGN
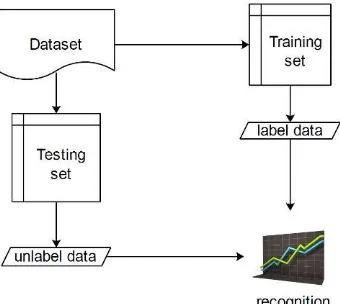
Figure 1. System Design
4.1 The Formation of Feature vectors 4.1.1 Myo Armband
rotational and translational [21]. IMU is used to measure the acceleration and angular rate on 3‐axis which is an important part of the navigation control system. There are variety techniques performed to produce IMU, one of them is combining accelerometer and gyrometer sensors [22]. Thus, Myo armband can uses five types of sensors to help identify gestures performed, consist of: EMG, accelerometer, gyroscope, orientation, and orientation‐euler. This study uses five types of such sensors to identify and analyze the extraction of features from the static and dynamic gestures.
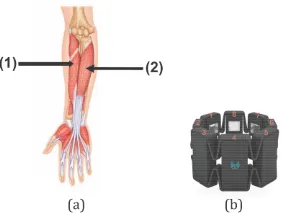
(1) Myo armband is a bracelet. It is using 8 blocks, each blocks contain electrodes / pod Elektromyography (EMG). The function is to read the motion activity of the extensor digitorum muscle and flexor digitorum as shown in figure 2.
Figure 2. (a) Ekstensor Digitorum (1) and Fleksor Digitorum (2), (b) Pod/ Electrodes of EMG Signal Sensor
(2) Sensor accelerometer to provide information about the acceleration in three directions, and rotation in each axis x, y and z and (3) gyroscope sensor is used to measure orientation the law of conservation in angular momentum. Under the direction of the axis according to Figure 3, gyroscope has resulted in the angular velocity of the direction of three axes, namely: axis x named angle psi (front and rear), the y‐axis is called angle phi (right and left), and the z axis is called angle theta (top and bottom).
(4) Orientation sensor at Myo armband determines the angle of movement by calculating the direction of Earth's magnetic field (magnetometer) and gravitation (accelerometer) [23]. In the world of 4D, there is another axis direction perpendicular to the axis x, y, and z indicated by the label w, or called with a fourth axis. This new axis also has a positive or negative direction, which refers to as + w and ‐w. x, y, z and w are used to measure the orientation of the movements are performed. W is the axis direction perpendicular to the axis x, y and z as shown in figure 3 point (b). The Function of Myo armband is to determine direction of the hand position movement that has been done. (5) Euler‐Orientation is a sensor that developed from orientation sensor. It describes a combination of translation and rotation (dynamic) gestures to calculate the value of x, y, z and w in orientation quaternion using calculation [24] to obtain 3‐axis euler ie roll, pitch, and yaw as shown in figure 3 point (c).
4.1.2 SIBI Dataset
The proposed system uses the dictionary SIBI (system isyarat Bahasa Indonesia). SIBI is a standart sign language used in Indonesia to assist in the communication of both deaf and deaf people with a wider society. It is form a systematic order for a set of finger gestures, hands, and various motions to symbolize the Indonesian vocabularies [25]. The focus of this research on finger movements is the A to Z alphabet corresponds to the SIBI. The movement of the finger has represented the static movement as well as dynamic. The gesture illustration describes in figure 4.
Figure 4. Sign Language Alphabet A‐Z on SIBI
4.1.3 Capture Data from 5 Kinds of Sensor at Sequence
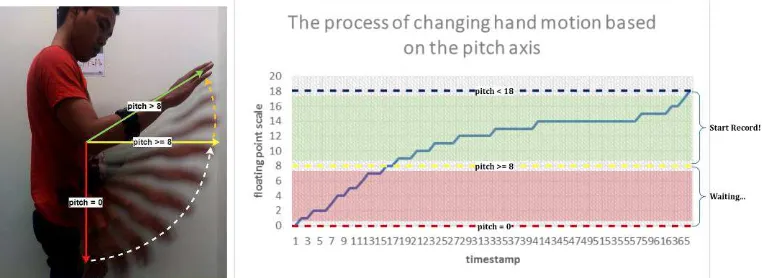
18 18) is one of the free conditions of motion where the minimum requirement of the yellow line has been met. So, the process of recording the data will run automatically on the green box region. The capture process of recording data is done for ±1 second by determining the initial conditions as the minimum point. The goal is to minimize the unnecessary movement. Making it easy to identify gestures and produce accurate data. Researchers do not specify the maximum limit of the process of recording raw data. Because all variations of SIBI’s hand gestures are performed at least above the yellow line.
Figure 5. The Process of Changing Hand Motion Based on the Pitch Axis
The recording process is according to Figure 5 with gesture movement (Figure 4). There are 26 classes of alphabet and 10 variants in each class. A total of 260 datasets will be extracted to produce feature vectors. However, there are some problems caused when the recording process is done.
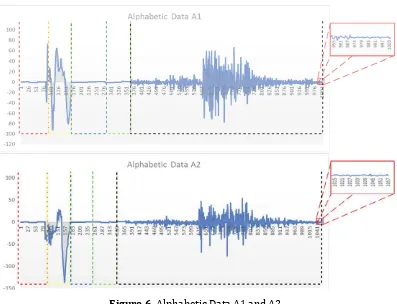
Figure 6. Alphabetic Data A1 and A2.
4.1.5 Extraction Feature with Moment Invariant Method
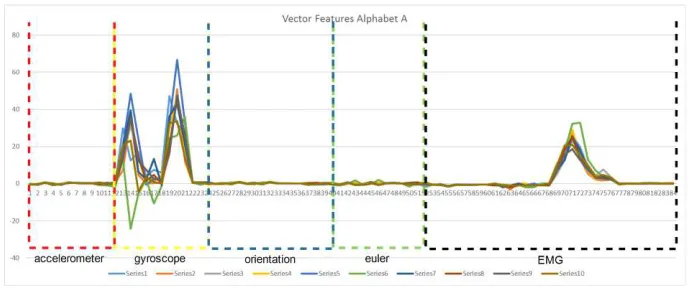
Extraction feature in this study using Moment Invariant (MI) method. Moment is a scalar value that captures a significant feature. This value gives the characteristics of an object that uniquely represents the shape. The basic idea is to describe the object with a set amount that can be measured is called invariant where insensitive to a certain deformation and provide enough power to recognize objects including the different classes [26]. Figure 6 is the result of sensor recording as data. Each data has the same distribution. MI is the character of a pattern. A pattern expressed as a distribution function. 1 movement is considered 1 pattern, so it has the same moment magnitude. The statictical value in the MI method states a pattern. The forming feature vectors by calculating use MI methods (mean, median, standard deviation, and skewness) on each axis of the sensor data. So, from the hand movements that have been made, feature vectors will be formed to represent the data information of each important sensor.
Figure 7. Feature vectors Data Alphabet A.
4.1.6 Normalization Data Model
The next step is to normalize the data feature vectors that has been formed. This study uses Min‐Max method for data normalization because feature vectors data model is not consistent with the scale. Thus requiring a process with normalization. With the following formula:
(
max min)
minnewmax = upper limit of maximum value
newmin = lower limit of minimum value
The advantage of this method is the balance between the values of the comparison data. There is no data was dominant compared to other datas. This process is performed because the feature vectors data model has a significantly difference. We use min‐max normalization for guarantying the range of data. The normalization process is done by finding the maximum and minimum value of each row data. This process is also work by determining the upper limit of the maximum value of 2 and the lower limit of the minimum value is 0. After collecting 260 datasets the next step is to test data by classification method.
4.2 The Learning of Feature Vector Dataset 4.2.1 Classification Method
The classification algorithm consists of two phases: (1) the training phase: a model is constructed from training data. (2) The testing phase: an established training data model is used to assign labels to unlabelled test data. The results of classifications flow model is illustrated as figure 8.
method which is a lazy learner. The K‐NN algorithm is amongst the simplest of all machine learning algorithms. It is working based on the shortest distance from the test sample to the training sample. An example is classified by a majority vote of its neighbours. It is assigned to the class most common amongst k nearest neighbors (k is a positive integer, typically small). Then the majority is taken from k‐NN to be predicted from the test sample by calculating based on Eucledian distance. The formula is as follows:
( )
=∑
d=(
−
)
matrix with dimension D. The basic k‐NN algorithm is composed of two steps: Find the k training examples that are closest to the unseen example. Take the most commonly occurring classification for these k examples (in the case of regression, take the average of these k label values).Figure 8. Classification model flow
4.2.2 Output Prediction
The validation sampling based on figure 8 is a process to divide between training and testing data before the classification algorithm build the model. In our research is using Leave‐one‐out (LOO) with cross validation (CV). K is chosen as the total number of examples (LOO is the generated case of K‐fold CV) in the dataset. We use sign language gesture dataset that contain each sample as sign gesture data and it needs to validate one by one as testing data that will be predicted. With the following formula:
testing once on as many models is develope so that there are a number of data points. The LOO process can be described in figure 9.
Figure 9. Leave‐one‐out cross validation flow
Then to estimating the accuracy of each test uses the table confussion matrix. The table confussion matrix described on figure 10.
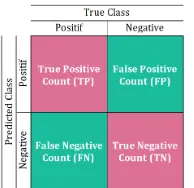
Figure 10. Confussion matrix table
The numbers on the diagonal from the top left to the bottom right (red box) are the correct predictions and the numbers outside of this diagonal are wrong predictions. Measuring the accuracy of the resulting classification model is important; (1) assessing the predictive accuracy in the future, (2) identifying the best classification model among many models is used. Classification performance can be calculated using accuracy, precision and recall measurements which are described in Table 1
Table 1. Classification performance evaluation
Measurement Formula
True Positive Rate TP/TP+FN
True Negative Rate TN/TN+FP
Accuracy TP+TN/TP+TN+FP+FN
Precision TP/TP+FP
Recall TP/TP+FN
5. EXPERIMENT AND ANALYSIS
Experiment and analysis consist of (1) Feature vectors Dataset, (2) Classification Performance Evaluation and the last (3) The interesting facts and analysis of SIBI dataset. Each stage will be described in section 5.1 to 5.3.
5.1 Feature Vectors Dataset
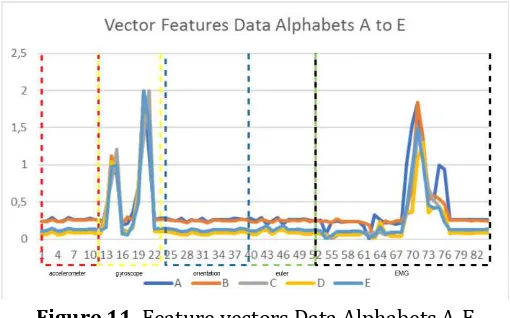
Total 260 data (26 alphabets x 10 times) SIBI gestures according to Figure 4. Example illustration of feature vectors data in alphabet A to E describe in figure 11. There is a pattern difference between the A to E alphabets that results from the feature extraction with MI. The next process is (1) the normalization of the dataset, (2) the classification using k‐NN, (3) the assessment on the classification with leave‐one‐out‐validation and the last (4) measuring the performance of the confussion matrix. Process 1 to 4 has been described in detail in Chapter 4. The next step is to display the classification performance results from the confussion matrix table.
Figure 11. Feature vectors Data Alphabets A‐E
5.2 Classification Performance Evaluation
Table 2. k‐Nearest Neighbor Performance Experiments
Based on Table 2, the best accuracy is obtained with the value k = 1 and k = 2. This is due to the spread of small distance value different between classes with other. The number of k determines how much amount of data has the closest distance then calculated mode for predicted in the most classification class.
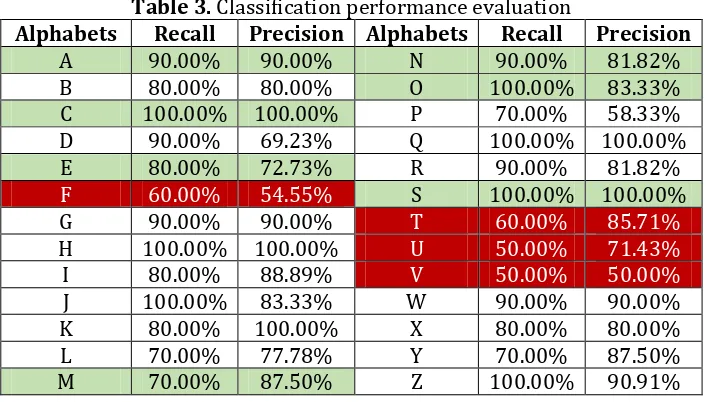
5.3 The Interesting Facts and Analysis of Alphabets SIBI Dataset
After we know classification performance, let us analyze on 26 alphabets sign language SIBI that have been use k‐NN classification with the highest accuracy from table 2 (k = 1). There are several alphabets almost have the same motion but surprisingly has good accuracy results, there are:
Table 3. Classification performance evaluation
Alphabets Recall Precision Alphabets Recall Precision
Table 4. Alphabetic Analysis F
Alphabets Wrong Prediction Classification
F E B J
Alphabet F with prediction errors are alphabet E (2 errors), alphabet B (1 error) and alphabet J (1 error). Based on table 4, the feature graph of EMG almost has the same pattern but not with the gesture movement. This may be due to the same gesture contraction performed.
Table 5. Alphabetic Analysis T
Alphabets Wrong Prediction Classification
T Z I J O
Table 6. Alphabetic Analysis U
Alphabets Wrong Prediction
Classification
U P V
Alphabet U with 4 errors prediction in the alphabet V and 1 error prediction on every P and X alphabet. The largest number of classification errors in the alphabet V. Because based on table 7 feature data in the alphabet U and the alphabet V has an EMG graph pattern that is almost similar among others.
Table 7. Alphabetic Analysis V
Alphabets Wrong Prediction Classification
V P R U
Alphabet V with 3 error predictions in the alphabet U, 2 error prediction in the alphabet R and 1 error prediction on every P. The largest number of classification errors in the alphabet U. It is because based on table 7 feature data in the alphabet U and the alphabet V has an EMG graph pattern that is almost similar among others.
Table 8. Similarity Hand Gestures Analysis
Gesture Pose Alphabets
Hold in fist Type 1
A E S
Circular
C O
Hold in fist Type 2
M N
6. CONCLUSION
According to the experiment result, we conclude that the feature vectors using moment invariant method separate the difference static and dynamic gestures. This method extracts important information for recognizing the gestures without adding or reducing the contained of information. By using data information on the accelerometer, gyroscope, orientation, orientation‐euler and EMG sensors. Then extract all the data into feature vectors. The purpose of this study was to prove the Moment invariant method was able to extract the unique features of each movement even with a simple classification algorithm (k‐Nearest Neighbor). This is evidenced by the accuracy of the recognition of gesture movement that achieves an accuracy of 82.31%. But there is the improvement of feature vectors for some language gesture. Especially in almost similar alphabetic motions as in the alphabet R, U, and V.
It is need further analysis calculations and classification method to improve accuracy and extraction feature data EMG. Especially in the alphabet F, T, U and V which has an accuracy of ±55%. The next development will test it on other people's gestures. To test about what the moment invariant method resilient to the different types of hands and gestures of other does. It will be attempted to use the Neural Network (NN) classification method. Because NN is able to acquire knowledge, generalize, and extract from certain data patterns. By using parallel counting capabilities make the process is easier.
REFERENCES
[1] Sulfayanti, Dewiani, and Armin Lawi, “A real time alphabets sign language recognition system using hands tracking,” 2016 Int. Conf. Comput. Intell. Cybern., pp. 69–72, 2016.
[2] F. Ramirez‐Garibay, C. M. Olivarria, A. F. E. Aguilera, and J. C. Huegel, “MyVox—Device for the communication between people: blind, deaf, deaf-blind and unimpaired,” IEEE Glob. Humanit. Technol. Conf. (GHTC 2014), pp. 506–509, 2014. Recognition,” 2013 Int. Conf. Comput. Sci. Appl., pp. 313–316, 2013. [6] Z. Yang and S. Narayanan, “Modeling Dynamics of Expressive Body
Gestures In Dyadic Interactions,” IEEE Trans. Affect. Comput., vol. XX, no. XX, pp. 1–1, 2016.
Appl. CISIM 2008, pp. 201–206, 2008.
[8] V. Bhame, R. Sreemathy, and H. Dhumal, “Vision based hand gesture recognition using eccentric approach for human computer interaction,” 2014 Int. Conf. Adv. Comput. Commun. Informatics, pp.
[11] “Multi-feature criteria with fuzzy logic pattern recognition for hand gesture classification,” in Midwest Symposium on Circuits and Systems, 2015, vol. 2015–Septe, pp. 1–4.
[12] M. Vanco, I. Minarik, and G. Rozinaj, “Evaluation of static hand gesture algorithms,” 21st Int. Conf. Syst. Signals Image Process., no. May, pp. 83–86, 2014.
[13] Y. Liu et al., “Image processing and recognition of multiple static hand gestures for human-computer interaction,” Proc. - 2013 7th Int. Conf. Image Graph. ICIG 2013, pp. 465–470, 2013.
[14] V. et al Elamaran, “Image Processing Algorithms for Gesture Recognition using MATLAB,” 2014 IEEE Int. Conf. Adv. Commun. Control Comput. Technol., no. 978, pp. 0–1, 2014.
[15] E. H. El‐shazly, M. M. Abdelwahab, A. Shimada, and R. Taniguchi, “Real Time Algorithm for Efficient HCI Employing Features Obtained From MYO Sensor,” IEEE 59th Int. Midwest Symp. Circuits Syst., no. October, pp. 16–19, 2016.
[16] A. A. Hidayat, Z. Arief, and D. C. Happyanto, “LOVETT Scaling with Flex Sensor and MYO Armband for Monitoring Finger Muscles Therapy of Post-Stroke People,” Emit. Int. J. Eng. Technol., vol. 3, no. 2, pp. 60– 76, 2015.
[17] A. F. Ruiz‐olaya, M. Callejas‐cuervo, and A. M. Perez, “EMG-based Pattern Recognition with Kinematics Information for Hand Gesture Recognition,” Signal Process. Images Comput. Vis. (STSIVA), 2015 20th Symp., pp. 1–4, 2015.
[18] Z. Arief, I. A. Sulistijono, and R. A. Ardiansyah, “Comparison of five time series EMG features extractions using Myo Armband,” 2015 Int. Electron. Symp., pp. 11–14, 2015.
[19] J. G. Abreu, J. M. Teixeira, L. S. Figueiredo, and V. Teichrieb, “Evaluating Sign Language Recognition Using the Myo Armband,” Proc. - 18th Symp. Virtual Augment. Reality, SVR 2016, pp. 64–70, 2016.
[21] S. Rawat, S. Vats, and P. Kumar, “Evaluating and Exploring the MYO ARMBAND,” pp. 4–9, 2016.
[22] Wahyudi, A. Susanto, W. Widada, and S. P. Hadi, “Inertial Measurement Unit using multigain accelerometer sensor and gyroscope sensor,”
Proc. 2011 Int. Conf. Electr. Eng. Informatics, ICEEI 2011, no. July, pp. 4– 8, 2011.
[23] T. Harada, H. Uchino, T. Mori, and T. Sato, “Portable orientation estimation device based on accelerometers, magnetometers and gyroscope sensors for sensor network,” IEEE Int. Conf. Multisens. Fusion Integr. Intell. Syst., vol. 2003–Janua, pp. 191–196, 2003.
[24] E. Fresk and G. Nikolakopoulos, “Full Quaternion Based Attitude Control for a Quadrotor,” Eur. Control Conf., pp. 3864–3869, 2013. [25] W. Djojonegoro, Kamus Sistem Bahasa Isyarat Bahasa Indonesia,
Ketiga. Jakarta: Departemen Pendidikan Nasional, 2001.