Merit Research Journal of Agricultural Science and Soil Sciences (ISSN: 2350-2274) Vol. 5(8) pp. 152-165, August, 2017 Available online http://meritresearchjournals.org/asss/index.htm
Copyright © 2017 Merit Research Journals
Original Research Article
Indonesian Crude Palm Oil Export Performance during
the Period (1990Q1-2015Q4)
Prof. Dr. Syamsurijal Tan
1and Prof. Dr. Firwan Tan
2*
Abstract
1
Department of Economics, Faculty of Economics and Business Jambi University, Kampus Pinang Masak, Jln
Jambi, Muaro Bulian Km 15 Mandalo Darat Jambi 36361- Indonesia
2
Department of Economics Faculty of Economics Andalas University. Kampus Unand Limau Manis Padang
25163-Indonesia
*Corresponding Author’s E-mail: [email protected]
This study aims at analysing the Indonesian Crude Palm Oil (CPO) export performance. Therefore, there are two main aspects economically important to study. The first is to examine the competitiveness of Indonesian CPO product in the global market. The second is to examine the Indonesian CPO export volume growth (dependent variable) on its correlation with certain variables (independent variables), i.e. world CPO prices, CPO domestic production, rupiah exchange rate to US dollar, including residual variable. Data observation is quarterly where n = 104 (1990Q1-2015Q4). In this framework, it is used two main tools of analysis i.e. (1)Revealed Comparative Advantage Index (RCA-Index), and (2)Regression Estimation equipped with Error Correction Model (ECM). The implications of research findings are explored deeply by using descriptive analysis. Overall results of studies indicate that Indonesian CPO export performance within (1990Q1-2015Q4) were relatively, fluctuant, unstable and less competitive condition from year to years. Those facts are reflected by the following research findings: (a)the competitiveness of Indonesian CPO exports in the world market during the period of 1990Q1 to 2015Q4 was not strong if it is compared with competitiveness forces of world CPO exports or other exporting countries. Most of RCA-Indices during the period of study were less than one, even though in average is greater than one; (b)the Indonesian CPO export volume growth during the period (1990Q1-2015Q4) was less responsive to the change of independent variables; (c)the CPO world price and the rupiah exchange rate to US dollar variables are found in negative correlation with and have significant effects on Indonesian CPO export volume growth at different magnitudes for both in the long and short-term; (d)the domestic CPO production variable is found in positive correlation with and have significant effects on Indonesian CPO export volume growth at different magnitudes in long and short term; €the coefficient regression residual variable (ECT) is found in negative correlation with and have significant effects on Indonesian CPO export volume growth at different magnitudes in long term. The negative sign of ECT coefficient indicates low rate of adjustment in the short term toward an equilibrium condition long term. In brief, overall independent variables influence significantly dependent variable in the short and long term. Therefore, the Indonesian CPO export performance is in general quite good. But some policies are important to rise in order to increase the Indonesian CPO export competitiveness in global market.
Keywords: Competitiveness, Indonesian CPO Export volume, world CPO prices, domestic CPO production, rupiah exchange rate to US dollar.
INTRODUCTION
Research Problems
In an open economic system requires the role of international trade to accelarate the economic development of a country. The interaction between one country with other in export-import activities will open
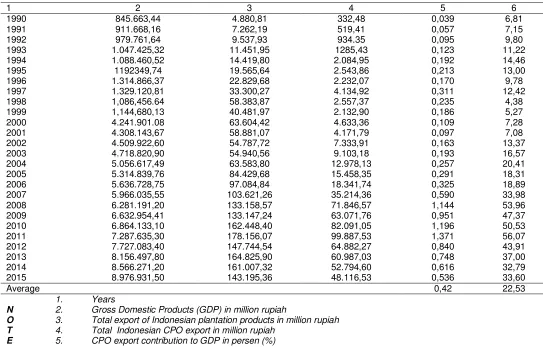
Tabel 1. Contribution of Indonesian CPO export to GDP (1990-2015)
1 2 3 4 5 6
1990 845.663,44 4.880,81 332,48 0,039 6,81
1991 911.668,16 7.262,19 519,41 0,057 7,15
1992 979.761,64 9.537,93 934.35 0,095 9,80
1993 1.047.425,32 11.451,95 1285,43 0,123 11,22
1994 1.088.460,52 14.419,80 2.084,95 0,192 14,46
1995 1192349,74 19.565,64 2.543,86 0,213 13,00
1996 1.314.866,37 22.829,68 2.232,07 0,170 9,78
1997 1.329.120,81 33.300,27 4.134,92 0,311 12,42
1998 1,086,456.64 58.383,87 2.557,37 0,235 4,38
1999 1,144,680,13 40.481,97 2.132,90 0,186 5,27
2000 4.241.901.08 63.604,42 4.633,36 0,109 7,28
2001 4.308.143,67 58.881,07 4.171,79 0,097 7,08
2002 4.509.922,60 54.787,72 7.333,91 0,163 13,37
2003 4.718.820,90 54.940,56 9.103,18 0,193 16,57
2004 5.056.617,49 63.583,80 12.978,13 0,257 20,41
2005 5.314.839,76 84.429,68 15.458,35 0,291 18,31
2006 5.636.728,75 97.084,84 18.341,74 0,325 18,89
2007 5.966.035,55 103.621,26 35.214,36 0,590 33,98
2008 6.281.191,20 133.158,57 71.846,57 1,144 53,96
2009 6.632.954,41 133.147,24 63.071,76 0,951 47,37
2010 6.864.133,10 162.448,40 82.091,05 1,196 50,53
2011 7.287.635,30 178.156,07 99.887,53 1,371 56,07
2012 7.727.083,40 147.744,54 64.882,27 0,840 43,91
2013 8.156.497,80 164.825,90 60.987,03 0,748 37,00
2014 8.566.271,20 161.007,32 52.794,60 0,616 32,79
2015 8.976.931,50 143.195,36 48.116,53 0,536 33,60
Average 0,42 22,53
N O T E S
1. Years
2. Gross Domestic Products (GDP) in million rupiah
3. Total export of Indonesian plantation products in million rupiah 4. Total Indonesian CPO export in million rupiah
5. CPO export contribution to GDP in persen (%)
6. CPO exports contribution to total export of plantation products in persen (%)
Source: Directorate General of Plantation, Oil World and World Bank (processed data)
and services or commodities. The export and import activities have the important role in accelarating economic welfare development of a country, it is reflected by its net contribution in formation of country’s Gross Domestic Product (GDP), see Table 1. It is an evidence in developed countries that their international trading are much dominated by the export of manufacturing products and by the import of natural resource products. On the other hand, for the developing countries such as Indonesia, its imports are dominated by manufacturing product and its export dominated by the commodities that produced in agricultural sector, especially those produced by plantation sub-sector, such as: natural rubber, coffee, cacoa, cinnamon, coconut, tea, clove, and the fresh fruit bunch (FFB) of palm oil which is used as main input in making CPO products.
The Indonesian statistical data presented that the value of contribution of plantation sub-sector to Indonesian GDP was fluctuative while its trend was positive during the periode of 1990-2015. It was reflected by the following facts, see Table 1, i.e: from its contribution to GDP in 1990 was about 4 persen, ten
years later on 2000 enhanced to 11 persen, then increase continously to the highest level at 137 persen in 2011, but turn down slightly to the level at 54 persen in 2015.
154 Merit Res. J. Agric. Sci. Soil Sci.
the conducive business environments in domestic market is very advantageous to support the competitiveness of export products against competitor countries in the global market. The demand of Indonesian CPO and any its derivative products are predicted in increasing trend from year to years, especially buyers that mostly come from some European Contries, USA and China.
In the long term perspective, it is essential that Indonesian governement has to take any policy in order to maintain the stability of CPO export growth and to increase the competitiveness of Indonesian CPO export. In the same time, making action to wide extend the palm oil plantation areas and improve the processing quality FFB toward end product for export oriented.
Before any policy imposed to make an expansion of CPO production and export, it is necessary to define precisely the economic variables which influence significantly the Indonesian CPO export growth performance in the world market.
Research Objectives
The main research objective is to analyze the Indonesian CPO export performance during 26 years starting from production of CPO in Indonesia, and the exchange rate of rupiah to US dollar. Therefore the research objectives correlation between the volume of Indonesian CPO export growth as a dependent variable and its independent variables, i.e: world CPO price, total volume of Indonesian CPO production, and rupiah exchange rate per US Dollar.
Theoretical Framework
Why Do Export-Import Activities Exist?
The theory of comparative advantage is an economic development theory about gains from doing trade for individuals, firms, or nations that arise from differences in their endowment factors or technological progress (Jhigan, 1996; Salvator, 1993).
In an economic model, one country has a comparative advantage over other countries in producing the particular goods and services if they can produce that
goods and services at a lower relative opportunity cost, i.e. at a lower relative marginal cost prior to trade. In fact, one does not compare the monetary costs of production or even the resource costs (labor needed per unit of output) of production. Instead, one tends compare the opportunity costs of producing goods and services across countries. The principle of comparative advantage holds that under free trade, a country will produce more of and consume less of goods and services for which they have a comparative advantage.
Adam Smith first refers to the concept of absolute advantage as the basis for international trade. If a foreign country can supply us with a good cheaper than we ourselves can make it, better buy it from them instead of making it (Jhigan, 1996; Stephen, 1988).
David Ricardo developed the classical theory of country will increase its overall consumption the good for which it has a comparative advantage besides exporting while importing the other good that provided the differences in labor productivity between both countries. In brief, Ricardo's theory implies that comparative advantage model tend to be applied much instead of absolute advantage model in international trade (Jhigan, 1996; Balassa and Noland, 1989).
One of the most popular trade theories is that the theory of comparative advantage which developed by David Ricardo and Hecksher Ohlin (H-O). According to the H-O theory, a country’s comparative advantage is determined by its relative factor scarcity (i.e. its factor endowment ratios, relative to the rest of the world or a set of countries). Their theory explains that a country will be more profitable to produce and to export a product that has its comparative advantage compared to other countries (Salvator, 1993; Tan, 2014; Widayanti, 2009). The comparative advantage can be either in term of low wages of labor or abundant in natural resources or both.
The theory of comparative advantage turned into a competitive advantage theory which developed by Porter (1990), where an export product not only measured in term of labor costs and availability of natural resources but also driven by other factors, i.e.: Product technology, product quality, product design and promotion, and supporting facilities of infrastructure, which in turn will decrease the cost of production and increase the quality of export product.
advantages are in term of relatively low cost of labor (labor intensive) and the availabilty of land resources for plantation areas. This condition could strengthen the competitiveness of CPO product in the world market
Basically, there are several objectives why do export-import activities exist, among others are (a) to obtain purpose of consuming better quality products from other countries, ect., (Tan, 2014; Alatas, 2015; Salvator, 1993).
Export Product Competitiveness
The more global and liberal world economy has created tighter competition among countries in international trade or in export-import activities; it has pushed economic competition shifting from relying on comparative advantage to competitive advantage. The competitiveness of export products depends not only on the growth of domestic production, but also closely related to the efficient use of labor inputs, investment capital, natural resources, skills and technology, and so on. In fact, between comparative and competitive advantages are integrated and complement each other. Comparative advantage can be considered as a necessary condition to achieve competitive export products in the global market (Amalbert et al., 1987; Jhigan, 1996; Widayanti, 2009).
There are at least two main indicators of export products in order to have stronger competitiveness in global market, namely: cheaper prices and better product quality. This condition can be happened, not only because of the benefits derived from cheap labor wages and the abundance of natural resources, but also can apply product technology in accordance with the availability of resources owned, supported by the development of marketing channels and human resource skills (Salvator, 1993; Jhigan, 1996).
Balassa (1990) explains that one way used to measure the competitiveness of export products is by using the formula “Revealed Comparative Advantage Index (RCA)” (Balassa and Noland, 1989). If the RCA Index is greater than unity or one from year to years, meaning there are adequate potentiality and strong competitiveness of the export product in the country. It implies as well that the competitiveness of export products of one country tends to be stronger than the average competitiveness of all export products over the
world. In contrast, if the RCA Index tends to close to zero or much smaller than unity or one, implying the low competitiveness of the export product compared with the same product from other countries in the international market. Therefore, any policy and strategy to accelerate the export growth of a country cannot be released from the influences of other countries, thus it is inevitable that one country must compete with other countries in export-import activities. In case of Indonesia, the exporters are considered as a price taker in the world market, but in buying the fresh fruit bunch in local market to agent/wholesalers, and from agent/wholesalers to farmers tend to exist the monopsony pricing forces This business environment implies that the development of Indonesian CPO export cannot stand alone but it must be adapted to the business environment of external factors from other countries (Hall et al., 2010; Nesti and Tan, 2016; Tan, 2005; Tan, 1985).
The Export Determination
Export product performance can be determined at least in three ways, namely from its growth during the certain period of times, its contribution to GDP and its competitiveness in comparing with other products (Tan, 2014; Magginson WL, 2000). One technique of measuring export performance is by analyzing the fluctuation of its growth monthly and yearly or in certain period of time. A positive export growth implies that the export is in condition of increasing rate compared with the previous years or periods. Export performance can be also measured by analyzing the fluctuation of increasing certain export product contribution to total export products or its contribution to volume of GDP during a
156 Merit Res. J. Agric. Sci. Soil Sci.
According to Widayanti (2009), the price of exported products at the international market will influence the price of exported product in domestic market. The domestic price of exported product (at “f.o.b”) is derivated from the export price at international market. Thus, the supply function of exported product is depended on the price of exported product in the world market with assumption that exporters are in condition as price taker in the world market. It means that the exported product price (at f.o.b. basis) is a derivative price of export product itself at international market. The relative price is the ratio between the export price and the domestic price (Px/Pd). Export prices will have a positive impact on the growth of a country's export supply. If the relative price of export products will be higher, then the number of exported products will tend to increase more and more, and if the opposite happen, will lead to reduced amount of export offered. Moreover, if the rupiah exchange rate per US dollar depreciates, it will boost export growth because the exporter will get a higher Rupiah exchange rate with the same dollar amount. In other words, importer demand will increase if the value of US dollar is more expensive than Rupiah (see, method 1) (Alatas, 2015; Park, 2007; Magginson WL, 2000; Winarno, 2015).
In summary, there is a significant joint effect between domestic CPO production, world CPO prices, and the rupiah exchange rate per US dollar against the export volume of Indonesian CPO. Nevertheless, each variable has the different influence on the export volume of Indonesian CPO. Theoretically speaking, the volume of CPO domestic production and the export price of CPO in the world market should have a positive effect on the growth of Indonesian CPO exports. Nevertheless, the rupiah exchange rate per US dollar tends to have a negative effect on growth of Indonesian CPO exports assuming unchanged in production cost and technological products.
RESEARCH METHODS
Research Approach and Data Sources
This research use quantitative and descriptive approaches. The data observation for the purpose of regression estimation are used quarterly data within the period of 26 years from 1990 to 2015 (n=104). The data are modified from anually data time series with interpolation method.
The types of data are mostly secondary data which have been processed and recorded officially by Indonesian government. However some of other data are also required from the private agency sources. Those data consist of the value and volume of Indonesia CPO
exports, the world CPO export prices and the rupiah exchange rate per US dollar, icluding the value of
Indonesian total exports, the value of world CPO exports, the value of world total exports, total value of export commodity of plantation in Indonesia and total value of export commodity of plantation in the world.
The export value and volume of CPO and then CPO domestic production and its prices are taken from the Directorate General of Plantation Minister of Agriculture of Indonesia. While the world CPO prices are obtained from the World Bank’s data. The Rupiah Exchange Rate against US Dollars and Indonesia's GDP is taken from Indonesian Central Bank (Bank Indonesia). The others related data are explored from several literarture studies.
Analysis Based on RCA-Index
RCA-Index has been used to help assess a country’s export potential. The RCA-Index indicates whether a country is in the process of extending the products in which it has a trade prospective as opposed to situations in which the number of products that can be competitively exported is static. It can also provide useful information about potential trade prospects to new partners. Countries with similar RCA-Index profiles are unlikely to have high bilateral trade intensities unless intraindustry trade is involved. RCA-Index measures, if estimated at high levels of product disaggregation, can focus attention on other nontraditional products that might be successfully exported. The RCA index of country i for product j is often measured by the product’s share in the country’s exports related to its share in world trade:
RCAij = (xij/Xit) / (xwj/Xwt) (2)
Where xij and xwj are the values of country i’s exports of product j and world exports of product j and where Xit and Xwt refer to the country’s total exports and world total exports. A value of RCA-Index less than unity (RCA < 1) implies that the country has a revealed comparative disadvantage in the product. Similarly, if the RCA index exceeds unity (RCA > 1), the country is said to have a revealed comparative advantage in the product. In this study, Xij is the value of Indonesian CPO exports; Xit is the total value of Indonesian export; Wij is the value of world CPO exports; and Wit is the total value of world export.
Analysis Based on Regression Estimation.
rupiah exchange rate to US dollar. In this context, Error Correction Model (ECM) method and its related tools of analysis are used to analyze the influences of independent variables on the dependent variable in the short and long-term.
Error Corection Model
Error-correction model is an econometrical model which is used to correct the deviation of variables from equilibrium conditions in the short term. The short-term dynamics of the variables in regression estimation is frequently happen the deviation from equilibrium condition in the long term. The relationship between short term and long-term variables illustrates that how variables might adjust to any discrepancies in long-run equilibrium relationship. This model was choosen because it can help to calculate and examine the short-term and long-short-term effects of independent variables on the dependent variable. It can corect properly the diviation problems during the periode of short term toward the equilibrium condition in the long term. In term of functional relationships among variables can be written in form of a regression equation as follows:
VCPOEXt =f(WCPOPRt, WCPOPRt, RERUSDt) (3)
Where:
VCPOEXt =Volume of Indonesian CPO export at year t (t= 0-∞) in ton
WCPOPRt = World CPO price at year t (t= 0-∞) in US $
ICPOPDt = Indonesian CPO Production at year t (t= 0-∞) in ton
RERUSDt = Rupiah Exchange Rate per US Dollar at year t (t= 0-∞)
Therefore, from (3) can be formed the initial equation regression estimation model as follows:
VCPOEXt = α0+ α1WCPOPRt + α2ICPOPDt + α3RERUSDt + et (4)
Two conditions must be fulfilled in using ECM (Enders, 2004, Chan Park S, 2007) at least one variable is not stationary at certain level of significance (α) and the variables in equation have a cointegration relationship each other. If both criteria are not fulfilled, then the ECM method cannot be used to examine the problems of deviation and cointegration. If the data are not cointegrated at certain level, therefore the model must be run by using doubled log equation (Park, 2007; Walter, 2010). Referring to Agus and Prawoto (2016), they said that cointegration among variables might be existed in long term, therefore the regression equation model must be performed in econometrical doubled log equation, as
follows:
LogVCPOEXt = α0 + α1LogWCPOPRt + α2LogICPOPDt +
α3LogRERUSDt + et (5)
The regression equation (5) requires three kinds of econometrical tests that must be done, i.e.: (a) stationarity test (unit root test); (b) integration degree test; and (c) cointegration test. Moreover, the initial model of econometrical equation in the long-term can be composed as follows:
VCPOEXt = β 0 + β 1WCPOPRt + β 2ICPOPDt + β 3RERUSDt + ɛt (6)
In term of doubled log equation, the econometrical equation model in the short-term should be as follows:
LogVCPOEXt = β0 + β1LogWCPOPRt + β2LogICPOPDt +
β3LogRERUSDt + ɛt (7)
Hence, in the long-term, econometrical doubled log equation model should be as follows:
∆LogVCPOEXt = β0 + β1∆LogWCPOPRt +
β2∆LogICPOPDt + β3∆LogRERUSDt + β4ECT + ɛt (8)
Hypothesis Testing
There are several tests that should be run in order to understand well about the relationships between dependent variable and independent variables. The hypothesis is that the joint contribution of independent variables influences significantly the dependent variable instead of separate contribution. In this case, we can apply the simultaneous econometrical testing by using F-test. Unlike t-tests that can asses only one regression coefficient at a time, the F-test can assess multiple coefficients simultaneously.
158 Merit Res. J. Agric. Sci. Soil Sci.
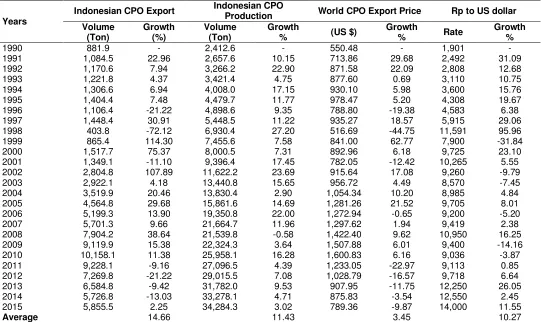
Table 2. Indonesian CPO Export Growth (1990-2015)
Years
Indonesian CPO Export Indonesian CPO
Production World CPO Export Price Rp to US dollar Volume
(Ton)
Growth (%)
Volume (Ton)
Growth
% (US $)
Growth
% Rate
Growth %
1990 881.9 - 2,412.6 - 550.48 - 1,901 -
1991 1,084.5 22.96 2,657.6 10.15 713.86 29.68 2,492 31.09
1992 1,170.6 7.94 3,266.2 22.90 871.58 22.09 2,808 12.68
1993 1,221.8 4.37 3,421.4 4.75 877.60 0.69 3,110 10.75
1994 1,306.6 6.94 4,008.0 17.15 930.10 5.98 3,600 15.76
1995 1,404.4 7.48 4,479.7 11.77 978.47 5.20 4,308 19.67
1996 1,106.4 -21.22 4,898.6 9.35 788.80 -19.38 4,583 6.38
1997 1,448.4 30.91 5,448.5 11.22 935.27 18.57 5,915 29.06
1998 403.8 -72.12 6,930.4 27.20 516.69 -44.75 11,591 95.96
1999 865.4 114.30 7,455.6 7.58 841.00 62.77 7,900 -31.84
2000 1,517.7 75.37 8,000.5 7.31 892.96 6.18 9,725 23.10
2001 1,349.1 -11.10 9,396.4 17.45 782.05 -12.42 10,265 5.55
2002 2,804.8 107.89 11,622.2 23.69 915.64 17.08 9,260 -9.79
2003 2,922.1 4.18 13,440.8 15.65 956.72 4.49 8,570 -7.45
2004 3,519.9 20.46 13,830.4 2.90 1,054.34 10.20 8,985 4.84
2005 4,564.8 29.68 15,861.6 14.69 1,281.26 21.52 9,705 8.01
2006 5,199.3 13.90 19,350.8 22.00 1,272.94 -0.65 9,200 -5.20
2007 5,701.3 9.66 21,664.7 11.96 1,297.62 1.94 9,419 2.38
2008 7,904.2 38.64 21,539.8 -0.58 1,422.40 9.62 10,950 16.25
2009 9,119.9 15.38 22,324.3 3.64 1,507.88 6.01 9,400 -14.16
2010 10,158.1 11.38 25,958.1 16.28 1,600.83 6.16 9,036 -3.87
2011 9,228.1 -9.16 27,096.5 4.39 1,233.05 -22.97 9,113 0.85
2012 7,269.8 -21.22 29,015.5 7.08 1,028.79 -16.57 9,718 6.64
2013 6,584.8 -9.42 31,782.0 9.53 907.95 -11.75 12,250 26.05
2014 5,726.8 -13.03 33,278.1 4.71 875.83 -3.54 12,550 2.45
2015 5,855.5 2.25 34,284.3 3.02 789.36 -9.87 14,000 11.55
Average 14.66 11.43 3.45 10.27
Source: Dirjen of Estate Crops. Minister of Agriculture of Indonesia 2015 (processed data)
dependent variable, and vice versa if t-statistics < t-table. The coefficient of determination is (R2), it measures the relationships between independent variables on the dependent variable. When the value of R2 is greater than zero or approaches to one or equal to one, implying that explanatory variables (or independent variables) are highly correlated with each other in explaining dependent variable. R2 is worth between zero to one (0 ≤ R2 ≤ 1). R2 is better when the value of R nearly equal to one (1).
EMPIRICAL FINDINGS
Indonesian CPO Export Growth
Table 1 describes mainly the Indonesian CPO export growth in its relation with the world CPO export prices, domestic CPO production, and rupiah exchange rate within the period of 1990-2015.
The development and growth of CPO export during the period of 1990 to 2015 was fluctuant and unstable. The growth of CPO export in average was around 14.66%, while domestic CPO production, CPO export
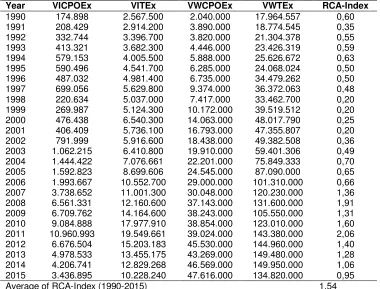
Table 3. RCA-Index of Indonesian CPO Export (1990-2015)
Year VICPOEx VITEx VWCPOEx VWTEx RCA-Index
1990 174.898 2.567.500 2.040.000 17.964.557 0,60 1991 208.429 2.914.200 3.890.000 18.774.545 0,35 1992 332.744 3.396.700 3.820.000 21.304.378 0,55 1993 413.321 3.682.300 4.446.000 23.426.319 0,59 1994 579.153 4.005.500 5.888.000 25.626.672 0,63 1995 590.496 4.541.700 6.285.000 24.068.024 0,50 1996 487.032 4.981.400 6.735.000 34.479.262 0,50 1997 699.056 5.629.800 9.374.000 36.372.063 0,48 1998 220.634 5.037.000 7.417.000 33.462.700 0,20 1999 269.987 5.124.300 10.172.000 39.519.512 0,20 2000 476.438 6.540.300 14.063.000 48.017.790 0,25 2001 406.409 5.736.100 16.793.000 47.355.807 0,20 2002 791.999 5.916.600 18.438.000 49.382.508 0,36 2003 1.062.215 6.410.800 19.910.000 59.401.306 0,49 2004 1.444.422 7.076.661 22.201.000 75.849.333 0,70 2005 1.592.823 8.699.606 24.545.000 87.090.000 0,65 2006 1.993.667 10.552.700 29.000.000 101.310.000 0,66 2007 3.738.652 11.001.300 30.048.000 120.230.000 1,36 2008 6.561.331 12.160.600 37.143.000 131.600.000 1,91 2009 6.709.762 14.164.600 38.243.000 105.550.000 1,31 2010 9.084.888 17.977.910 38.854.000 123.010.000 1,60 2011 10.960.993 19.549.661 39.024.000 143.380.000 2,06 2012 6.676.504 15.203.183 45.530.000 144.960.000 1,40 2013 4.978.533 13.455.175 43.269.000 149.480.000 1,28 2014 4.206.741 12.829.268 46.569.000 149.950.000 1,06 2015 3.436.895 10.228.240 47.616.000 134.820.000 0,95
Average of RCA-Index (1990-2015) 1,54
Source: Directorate General of Plantation Minister of Agriculture RI, World Bank (processed data)
Notes:
VICPOEx = The value of Indonesian CPO exports in US $ VITEx = The value of Indonesian total exports in US $ VWCPOEx = The value of world CPO exports in US $ VWTEx = The value of world total exports in US $ RCA = Revealed Comparative Advantage Index
US dollar during the period of 1990-2015. It means that the depreciation of rupiah to US dollar tends to add and create new demand for Indonesian CPO export in the world market.
The highest Indonesian CPO export growth was occurred in 1999, i.e. 114.30% a year after Indonesian monetary crisis in 1998. At the same year the domestic production growth was only 7.58% while the world CPO price expanded extraordinary by 62.77% from previous years (-44.75%) despite that the exchange rate growth was in minus sign (-31.84%). Thus conclusion is that the increase in export volume of CPO in 1999 driven largely by increasing in world CPO prices.
The lowest export growth of CPO during the period of 1990-2015 occurred in 1998, i.e. -72.12%. It was caused mostly by the drastic decline of world CPO export price by 44.75%. In contrast rupiah depreciation policy (95.96%) imposed by the government of Indonesia at that period was unable to boost considerably export growth. The interesting thing is that the amount of CPO domestic production during the period of 1990-2015 increased continuously from 2,412.6 tons (1990) turn into 34,284.3
tons in 26 years later (2015) or increase around 14 times. While the total quantity of CPO export (in ton) increased fluctuant from year to year at the same period of time, i.e. from 881.9 tons (1990) turn into 5,855.5 tons (2015) in 26 years later or increase around 7 times. This express the increasing of domestic CPO production is not totally for export but a part of that utilized to satisfy the domestic demand, or it may be for the purpose to produce derivative products of CPO in domestic market. It reflected by the difference between total domestic CPO production and total CPO export that tends to be greater and greater throughout the time.
In preliminary conclusion, three independent variables, i.e. world CPO prices, the domestic CPO production, and rupiah exchange rate per US dollar contributed significantly on CPO export volume of Indonesia throughout the time (1990-2015).
RCA-Index and Competitiveness
160 Merit Res. J. Agric. Sci. Soil Sci.
competitiveness of Indonesian CPO exports computed by using the RCA-Index within 26 years from 1990 to 2015. RCA-Index is 1.54 in average which is greater than 1 (one), illustrates that the competitiveness of Indonesian CPO exports is relatively superior in comparing to the average competitiveness of world CPO exports. It is understandable because Indonesia has an absolute and comparative advantages in term of cost of CPO production due to low cost of labor input and natural resource wealth including the availability of land sources for plantation purpose. Interesting thing, when viewed by annually growth, the most of RCA-index was smaller than 1 (one) before the year of 2006 or from 1990 to 2006, it indicats that during that period of time the competitiveness of Indonesian CPO export product was relatively lower than the competitiveness of the world's CPO export products from other countries. However, from 2007 to 2014, the RCA-Index was relatively greater than one, excepted in 2015 (RCA-Index = 0.95), implying that: (a) the world economic crisis recovery in 2006 has a positive impact on demand for Indonesian CPO export products; (b) there were the technological and skill improvements in CPO production in domestic market starting from the year of 2007 so that the decreasing of CPO export prices in international market not too much influence on Indonesian CPO production and exports.
Nevertheless, the fluctuation of RCA-Indexes from year to year (1090-2015) can be considered as a reflection of unstable competitiveness condition of Indonesian CPO export performance. Mostly the value of RCA-Index was less than one in average or RCA < 1 during the period of 1990-2006. It was greater than one only from 2007 to 2014, and than turn down to be less than one again in 2015 (RCA < 1). It was the facts that showed the competitiveness of Indonesian CPO export products still much influenced by the external variables at international level. Or in the other word implies that Indonesian exporters of CPO are still in condition of as a price taker facing the importer’s countries are as price makers. In a simple conclusion, Indonesian CPO-export depend on demand forces from the word market. Therefore, Indonesian CPO exporters are in position as price takers or as a price follower in the word market.
Regression Estimation
Before running the regression estimation, the stationarity data should be examined, for this purpose there are two statistical tests that are necessary to conduct, i.e. unit root test and cointegration test.
Unit Root Test
The uniformity data in regression equation are examined by using the unit root test at 10% level of significance
(α = 5%, 10%) and detecting the the degree of probability (p-value), if p-value < α, therefore H0 is rejected and H1 accepted and the data are considered as the stationary data. And if the otherwise happened whereas p-value >
α, implying that the data are not stationary. A stationary time series is one which statistical properties such as mean, variance, autocorrelation, etc. are all constant over time
Carrying out of the unit root test is for the reason to verify whether all variables contain unit root or stationary data or not at all or not at certain level of α. The results of testing have found that the variables, i.e. the volume/amount of Indonesian CPO export (VCPOEXt), the Indonesian CPO production or domestic CPO production (ICPOPDt), and the rupiah exchange rate to US dollar (RERUSDt) are not stationary at a certain level of α, but the variable of world CPO export price (WCPOPRt) is stationary (see, Table 4).
In conclusion, these findings indicated that the regression estimation supported by ECM is relevance to be used and can be applied in this research because of it fulfills the criterias required (refer to regression equation 4).
Table 4 describes the results of stationary data test at level which shows that all of variables have critical < t-stat at level of α = 5%. In term of p-values, the result of testing shows that most of variables are not stationary because of its p-values > α, excepted for p-value of variable i.e: WCPOPRtwhich is stationary by the reason its p-value smaller than α = 5% (p-value < α). Since most of all variables are not stationary, except one variable only, i.e. WCPOPRt, thus it obliges to advanced the stationary testing at the first difference level (see, Table 5).
From the results of stationary test at the first difference level as it is described by Table 5 above shows that all variables can be accepted from point of view t-test (t-critical < t-stat at level of α = 5%). However, this testing results at first difference level shows that only world CPO price variable is stationary data (p-value < α = 5%), but the rests of variables are in condition of data which are not stationary at first difference level testing. Since only one variable is stationary, i.e. indipendent variable WCPOPRt. Thus, it is required to continue to conduct stationary data testing at second difference level for all variables under studies (see, Table 6).
After running the stationary data testing at second difference level as it is described by Table 6, the results indicate that all variable data of regression equation are in stationary condition.
Table 4. Stationary Test Results at Level of 26 Years Observation (n=104) 1990Q1-2015Q4
Table 5. Stationary test results At First Difference Level of 26 Years Observations (N=104) (1990Q1-2015Q4)
Variables Method t-stat t-crit p-value Interpretation
VCPOEXt ADF -1.944980 -2.892536 0.3106 Data is not stationary
WCPOPRt ADF -2.866386 -2.893956 0.0534 Stationary data
ICPOPDt ADF -1.820741 -2.893956 0.3684 Data is not stationary
RERUSDt ADF -1.859040 -2.893956 0.3501 Data is not stationary
Table 6. Stationary test results at second difference level of 26 observations (n=104) (1990q1-2015q4)
VARIABLES Method t-stat t-crit p-value Interpretation
VCPOEXt ADF -5.245455 -2.892536 0.0000 Stationary data
WCPOPRt ADF -4.285180 -2.893956 0.0009 Stationary data
ICPOPDt ADF -5.760540 -2.893956 0.0000 Stationary data
RERUSDt ADF -5.742354 -2.998064 0.0000 Stationary data
Table 7.Regression results in the long term of 26 years Observations (n=104)(1990Q1-2015Q4)
Variables Coefficient Standard Error t-statistic p-value f-statistic
VCPOEXt 663.0370 151.9555 4.363362 0.0000
0.000000
WCPOPRt -0.016533 0.006451 -2.562732 0.0119
ICPOPDt 0.328464 0.021125 15.54839 0.0000
RERUSDt -0.416964 0.083666 -4.983653 0.0385
critical < t-stat and p-value < α (refer to Table 6). In brief conclusion, it is believed that all variables in regression equation are stationary at the same level. Thus the following testing should be done, is cointegration test for all observation variables.
Cointegration Test
After all variables are found as in form of stationary data at the second difference level (table 6), then it is needed to advance the method to testing significancy of all variables under studies. In this context, cointegration test method must be conducted in order to examine the effects of all independent variables on the dependent variable. The first step is to carry out the test in order to estimate the magnitude values of each variable under studied in the long term. The results of estimation can be described by Table 7.
The results of regression as it is mentioned by Table 7 above, can be written in a simple form of a regression equation model as follows:
VCPOEXt = 663.0370 - 0.016533 WCPOPRt + 0.328464 ICPOPDt - 0.416964 RERUSDt + ɛt (4.363362) (2.562732) (15.54839) (-4.983653)
After regressing the independent variables to the dependent variable, then the next step is to look at the value of the unit roots of the residual variable which is considered statistically as a standard error variable or the variable of Error Correction Term (ECT) of regression equation (see,Table 8).
OLS, Long Term Regression
Ordinary Least Squares (OLS) model aims to determine
Variables Method t-stat t-crit (p-value) Interpretation
VCPOEXt ADF -1.384803 -2.892536 0.5866 Data is not stationary
WCPOPRt ADF -2.857701 -2.892536 0.0543 Stationary data
ICPOPDt ADF -2.923534 -2.893589 0.9997 Data is not stationary
RERUSDt ADF -1.791021 -2.893589 0.7583 Data is not stationary
162 Merit Res. J. Agric. Sci. Soil Sci.
Table 8. Root Unit Test Results on Residual Regression of 26 years Observations (n=104) (1990Q1-2015Q4)
Variable Method t-statistic t-crit p-value
ETC ADF -2.892536 -2.892879 0.0674
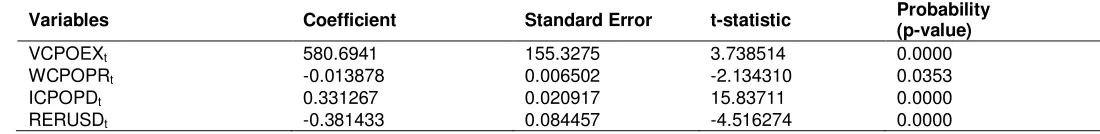
Table 9. O.L.S. Regression result in the short term of 26 years observations (N=104), (1990Q1-2015Q4)
Variables Coefficient Standard Error t-statistic Probability
(p-value)
VCPOEXt 580.6941 155.3275 3.738514 0.0000
WCPOPRt -0.013878 0.006502 -2.134310 0.0353
ICPOPDt 0.331267 0.020917 15.83711 0.0000
RERUSDt -0.381433 0.084457 -4.516274 0.0000
Table 10. ECM, Regression results for long term of 26 years observations (N=104), (1990Q1-2015Q4)
Variables Coefficient Standard Error t-statistic p-value
ᵝ0 567.1544 67.03700 8.460319 0.0000
D(WCPOPRt) -0.013152 0.002806 -4.686416 0.0000
D(ICPOPDt) 0.337287 0.009032 37.34449 0.0000
D(RERUSDt) -0.389300 0.036451 -10.68014 0.0000
ECTt (-1) -0.889425 0.042933 20.71668 0.0000
the effect of independent variables on the dependent variable in the long term. Table 9 describes the results of OLS Regression estimation of independent variables in the short term against the dependent variable, i.e. the export volume of Indonesian CPO from 1990 to 2015.
There are three independent variables, i.e:. (1) world CPO price (CPOEPR), (2) domestic CPO production (ICPOPD) and (3) rupiah exchange rate to US dollar (RERUSD). The results of estimation by using OLS can be seen in Table 9.
Table 9 describes the results of simultaneously OLS regression estimation in the short term, it can be written as a simple form of a regression equation in double log model as follows:
LogVCPOEXt = 580.6941 - 0.013878 LogWCPOPRt + 0.331267 LogICPOPDt – 0.381433 LogRERUSDt + ɛt (3.738514) (2.134310) (15.83711) (-4.516274)
Where: F-statistic = 134.3198; F-probability = 0.0000; R2 = 0.804375
ECM, Short Term Regression
Error Correction Model (ECM), in some leteratures, is called as Error Correction Mechanisme (ECM) or Error Correction Term (ECT) which is used for time series data analysis. Its role is to equilibre the relationships between economic variables in short term with those in the long term. Thus to see the effects of independent variables on the dependent variable in the long term, the regression of the short term by OLS must be run by entering the
previous residual (-1) as the regression residual which is represented by ECT variable. The results of computing are described by the following Table 10 In econometrical regression equation, the statistical facts in the long term as presented by table 4.7, can be performed as follows:
∆Log VCPOEX = 567.1544 + 0.013152 ∆Log WCPOPRt + 0.337287 ∆Log ICPOPDt - 0.389300 ∆Log RERUSDt - 0.889425 ECTt
(8.460319) (4.686416) (37.34449) (-10.68014) (20.71668)
Where: F-statistic = 648.1869; F-probability = 0.0000; R2 = 0.963937; D = ∆
ECONOMIC IMPLICATION
condition as price takers in the world market so that they are not yet able to control the world CPO price for their owned benefits, they tend to follow or to adapt the price imposed by importers.
The accuracy of influences of independent variables are quite strong due to the value of determination coefficients in the long term which is equal to 0.80 and in the short term that is equal to 0.96. These facts explain that the contribution of all independent variables in explaining the dependent variable is roughly 80 percent in the long term and approximately 96 percent in the short term. The remaining are explained by other variables outside the model (residual variable) such as the external variables which are created by the economic expansion of importing countries, it could be in term of product quality development, products and services innovation, product technology design, marketing networks and strategy, importer’s government policies, etc.
In regard of partial testing on domestic CPO production variable, the result shows that in the long term, t-statistic is equal to 15.84 and p-value or probability is equal to 0.00. By using a significant level at five percent (α =5%) the result of testing hypothesis indicates that there is a positive influence of CPO domestic production variables on the export volume of Indonesian CPO during the period 1990Q1-2015Q4. Its value of elasticity domestic production will increase Indonesian CPO export volume about 0.33 percent. In the short term, the result of calculation yields t-statistic equal to 37.34 and probability (p-value) is 0.00, meaning the domestic CPO production not induce significantly on the expansion of Indonesian CPO export as the dependent variable even if at a confidence level equal to ten percent (α =10%). This condition indicates that the competitiveness of Indonesian CPO exports is relatively weak in the international market. This problem can be occurred because of high cost of domestic CPO production as the impacts of inefficiencies in the production process, lack of product technology improvement, less strategy in developing marketing networks and services, lack of human resources skills, etc.
In the long term, the results of regression estimation shows that the world price of CPO variable has t-statistic equal to -2.13 and p-value equal to 0.03 while in the short term t-statistic equal to -4.67 with p-value equal to 0.00. And then its coefficient is in negative sign, implying that the world CPO price variable has negative and significant impact on the export volume of Indonesian CPO. In the long term, the increase in world CPO price by one percent will decrease slightly the export volume of CPO around 0.014 percent. In the short term, the coefficient of
price elasticity decreases a little bit to 0.013. Since the negative sign of coefficient WCPOPRt indicates that there is a tendency of Indonesian to manufacture more CPO in domestic market in order to sale more final products or derivative products of CPO in the global market.
In the long term, the study proved that the independent variable of rupiah exchange rate per US dollar has a negative and significant effect on Indonesian CPO export volume growth. It can be seen from t-statistic at -4.52 and p-value at 0.00, while in the short term t-statistic is equal to -10.68 with p-value is equal to 0.00, so that it can be concluded that the exchange rate of rupiah to US dollar has a negative and significant effect on export volume growth at five percent of level of significance (α = 5%). The elasticity of coefficient is equal to - 0.38 in the long term and - 0.39 in the short term. Its implication is that the rupiah exchange rate increase by one percent then will reduce the export volume of CPO around 0.38 percent and 0.39 percent respectively.
164 Merit Res. J. Agric. Sci. Soil Sci. CPO, including its derivative products within the country. 2) The competitiveness of Indonesian CPO exports in the world market during the period of study (1990-2015) was not so strong in comparing with competitiveness forces of other countries, it was reflected by instability, and the fluctuation of RCA-Index values within 26 years (1990-2015). Most of RCA-Index values during that period were less than one, the trend reverse was happened only in 2007 to 2014 (RCA>1) due to improvement the domestic production of FFB and CPO products that in turn accelerates CPO export growth.
3) Indonesian CPO export performance within 26 years from 1990 to 2015 was fluctuant and unstable condition. It is indicated by the fluctuation of the CPO export volume growth in its relationships with the independent variables, i.e. world export CPO prices, domestic CPO production, and the exchange rate rupiah to US dollar. In economic point of view, this condition tends to indicate low competitiveness of Indonesian CPO’s exporters in the world market.
4) The independent variables in the long term and short-term influence significantly on the Indonesian CPO export volume growth.
5) Indonesian CPO domestic production per se has positive impact significantly in the short term and the long term on the Indonesian CPO export volume growth (1990-2015). This condition can be taken to mean that the domestic production tend related to increasing in domestic consumption and the development of processing industries to derive more derivatives of FFB and CPO products domestically.
6) The world CPO export price per se shows a positive and very significant relationship as a determinant of the growth of export volume of Indonesian CPO both in the long and short term during the period of study (1990-2015). From an economic perspective, such a condition further reinforces the opinion that the competitiveness of Indonesian CPO exporters is still relatively weak in international competition.
7) The rupiah exchange rate per US dollar per se shows a negative and significant influence on the CPO export volume growth in both short-term and long-term. Of course, it is a logic condition because it matches with the theoretical mechanisms. However, it is also a signal that
Indonesian rupiah not too significant as the strategic tool to increase the competitiveness of Indonesian CPO export product in the world market.
8) The variable ECT (as a residual variable) shows a negative sign and considered significantly influence on the volume of Indonesian CPO export. Nevertheless, the sign negative of ECT coefficient implies relatively slow rate of adjustment process in the short term to return to an equilibrium condition in the long term.
Recommendation
1. For the purpose of increasing the quality of Indonesian CPO export performance, it requires government policy intervention, particularly in case of to facilitate and stimulate the growth of FFB-CPO and its derivative products for export. The expectation is that in one day Indonesian producers and exporters of FFB and CPO can be as price maker in the world market
2. This research only using the data within 26 years with 104 observations during the period of 1990Q1- 2015Q4. Regression estimation with only three variables independents. If more variable independents are used, it might improve this research results. Those variables are such as product quality, marketing strategy, the availability of plantation land, the government specific policies, including the demand factors come from the importer country, etc. Therefore, for the further research in the future, is important to extend the duration of data observations as well as the number of independent variables in regression estimation model, and operated by using the simultaneous equation approach.
3. The future research must be designed properly. For that, deeper study should be done in the framework of analyzing the industrial system of FFB products. The next study must analyze deeply the product development process in the integrated system (primary –secondary-tertiary). The competitiveness of FFB’s derivative products can increase significantly if the development of those products at primary level is integrated with secondary and tertiary level at the same time.
REFERENCES
Alatas A (2015). Trend of Palm Oil Production and Export (CPO) Indonesia. Master of Management Agribusiness. Gadjah Mada University. Yogyakarta
Amalber Marie-Noel, Barreau Jean, Delahaye Jacqueline (1987). Economie D’entreprise, published by Imprimerie Louis-Jean, Paris, edition SIREY.
Anwary AA (2011). Predicted Rupiah Exchange Rate Against US Dollar Using Fuzzy Time Series. Informatics Engineering Program Department of Mathematics. Faculty of Math and Science. Semarang: Diponegoro University.
Balassa B, Noland M (1989). Revealed Comparative Advantage in Japan and United States. J. Int. Econ. Integration, p. 8-22
Hall, S.,Hondroyiannis, G.,Swamy, P.A.V.B.,Tavlas, G.,Ulan, M (2010). Exchange Rate Volatility and Export Performance: Do Emerging Market Economics Resemble Industrial Countries or other Developing Countries. Economic Modeling.
Jhigan ML (1996). Development Economics and Planning, Published by PT. Rajagrafindo Persada, Jakarta.
Joersen TS, M Fathorrozi (2003). Theory of Micro Economics. Jakarta: Salemba Four
Magginson WL (2000), Small Business Management: An Entrepreneur’s Guidebook, International Edition, Published by Irwin McGraw-Hill
Nesti L, F Tan (2016). The Marketing Effeciency of CPO in West Sumatra, A study of Exporter Competitiveness In Buying FFB in Local Market, a dissertation for P.hD degree, Faculty of Economics Andalas University
Park CS (2007). Contempory Engineering Economics, Fourth Edition, published by Pearson Prentice Hall.
Porter ME (1990). What is Strategy. Harvard Business Review. Salvator D (1993). International Economics. New York: Macmillan
Publishing Company.
Shinichi I, Roy B (2009). Decentralization Policies in ASIAN Development, published by World Scientific Publiching Co. Pte.Ltd, Singapore 596224.
Simorangkir, Iskandar and Suseno (2004). Exchange Rate System and Policy. No. Kebanks central Series 12. Jakarta: PPSK of Bank Indonesia.
Stephen M (1988). Industrial Economics, Economic Analysis and Public Policy, Second Edition, Macmillan Publishing Company, New York USA.
Tan F (1985). The natural Rubber Marketing in Indonesia A Study of Competitiveness among exporters, A Thesis for Master Degree in Economics, Thammasat University, Bangkok-Thailand
Tan S (2014). International Trade (Theory and Some Applications), published by Faculty of Economics, University of Jambi
Tan S (2016). Regional Development Planning, Theory and Its Implications, published by Faculty of Economics University of Jambi Tan, Firwan (2005) The price efficiency in Vertical Integrated Market of
Natural Rubber Industry in Indonesia, published by Management and Economic Development Journal, University of Jambi, Vol 4 No.1.
Thobarry AA. (2009). Effect Analysis of Exchange Rate, Interest Rate, Inflation Rate and GDP Growth Against Stock Price Index of Property Sector, Empirical Study on Indonesia Stock Exchange Period of Observation Year 2000-2008.
Tribasuki A, Nano P (2016). Regression Analysis in Economic and Business, Research Accompanied by SPSS and Eviews. Surabaya: Rajawali Pers.
Walter E (2010), Applied Econometric Time Series, published by JOHN WILEY & SONS Inc, USA.
Widayanti S (2009). Indonesia Export Analysis. Discourse Vol. 12 No. 1. Winarno WW (2015). Analytical Econometrics and Statistics with