USER REQUIREMENTS GATHERING FOR 3D GEOGRAPHIC INFORMATION IN THE
UNITED KINGDOM
K. Wonga and C. Ellulb
a Department of Computer Science, University College London, UK - [email protected]
b Department of Civil, Environmental and Geomatic Engineering, University College London, UK - [email protected]
KEY WORDS: 3D GIS; 3D geoinformation; requirements gathering; user requirements; United Kingdom.
ABSTRACT:
Despite significant developments, 3D technologies are still not fully exploited in practice due to the lack of awareness as well as the lack of understanding of who the users of 3D will be and what the user requirements are. From a National Mapping & Cadastral Agency and data acquisition perspective, each new 3D feature type and element within a feature added (such as doors, windows, chimneys, street lights) requires additional processing and cost to create. There is therefore a need to understand the importance of different 3D features and components for different applications. This will allow the direction of capture effort towards items that will be relevant to a wide range of users, as well as to understand the current status of, and interest in, 3D at a national level. This paper reports the results of an initial requirements gathering exercise for 3D geographic information in the United Kingdom (UK). It describes a user-centred design approach where usability and user needs are given extensive attention at each stage of the design process. Web-based questionnaires and semi-structured face-to-face interviews were used as complementary data collection methods to understand the user needs. The results from this initial study showed that while some applications lead the field with a high adoption of 3D, others are laggards, predominantly from organisational inertia. While individuals may be positive about the use of 3D, many struggle to justify the value and business case for 3D GI. Further work is required to identify the specific geometric and semantic requirements for different applications and to repeat the study with a larger sample.
1. INTRODUCTION
In recent years, significant developments in data acquisition techniques, visualisation, image-processing, and computing power have facilitated the increasing prevalence of 3D geographic information (3D GI) (Jazayeri et al., 2014). Despite this progress, 3D technologies are still not fully exploited in practice (Stoter et al., 2013). This may be due to a lack of awareness - while 2D GIS is used in a wide number of different applications, practitioners may not necessarily be aware of the potential or availability of 3D technologies. In addition, another barrier to uptake is the lack of understanding of who the users of 3D will be and what the user requirements are (Stoter et al., 2013).
User requirements for 2D geographic information evolved both due to emerging technology and the efforts of data producers, such as National Mapping & Cadastral Agencies (NMCAs), working iteratively with their end users over many years. Historically, 2D map content may have initially been derived from digitized paper maps. Given the more recent emergence of 3D geographic information, this iterative process has not yet taken place, and we have, to a certain extent, tabula rasa or a clean slate (albeit with consideration to backwards compatibility with existing 2D data). This opportunity offers a high degree of freedom for both users and data producers to define what 3D geographic information is and what they may require from it. The multitude of choice is both a benefit and detriment. Whereas a user may express the desire for as much information as can be captured, from the NMCA and data acquisition perspective, each new 3D feature type and element within a feature added (such as doors, windows, chimneys, street lights) requires additional processing and cost to create. There is therefore a need to understand the importance of different 3D features for different applications (e.g. roofs for solar). Understanding the user requirements is paramount in producing effective, usable, and cost-efficient 3D geographic information.
Many authors have conducted requirements analysis for 3D data (see Section 2.1). However, as with 2D geographic information
it can be posited that requirements will vary from country to country and user group to user group, due to factors including the maturity of the local GI industry and issues such as the presence or absence of a cadastre. Exploring requirements at national level may highlight similarities or differences and will allow local NMCAs to prioritise their work towards the needs of the national audience. Addressing the user perspective will help inform the design and development of 3D data, creating products that are effective and usable. In addition, the requirements gathering exercise should highlight some of the problems users currently face in the process of implementing or extending their work into the third dimension.
This study adopts a user-centred design approach (as explained in Section 2.2 & 3) in understanding the user needs for 3D geographic information within the United Kingdom. In addition, the paper explores the barriers to the adoption of 3D and attempts to identify which applications GIS which will benefit most from the use of three-dimensional geographic information. This study also provides some preliminary views as to the current status of, and understanding of, 3D GI in the UK
2. BACKGROUND 2.1 Requirements gathering studies for 3D GI
There have been many recent studies exploring the different aspects of requirements for 3D (Stoter et al. 2013; Walter 2014; Sargent et al., 2015; Biljecki et al., 2015; Stoter et al., 2016a; Stoter et al., 2016b).
manufacturers will invest heavily into the field, overcoming many of the existing problems identified in the study (Walter 2014). Biljecki et al. (2015) conducted a desk-based review of existing literature to investigate the utilisation of 3D city models. The authors conclude that 3D city models were used in at least 29 uses cases within more than 100 applications, although only 5 use cases utilised 3D city models beyond visualisation (Biljecki et al. 2015). Stoter et al. (2016a) detailed the experiments and latest efforts on 3D mapping within seven European NMCAs, from the production of a common national 3D visualisation environment in Sweden to the expansion of online web portals to incorporate 3D capabilities in Switzerland. While some countries (Switzerland and the Netherlands) already offer 3D building geometry, others (Poland and Finland) have begun similar programs with the aim of releasing 3D datasets in the next 2 years (Finland). The authors concluded that while significant steps have been made, 3D data produced was still underused (Stoter et al. 2016a). From a more technical perspective, Stoter (2016b) presented the results from a workshop focusing on the sharing of generalisation requirements for NMCAs. Specific to the UK, Sargent et al. (2015) outlined the research efforts of Ordnance Survey in designing a 3D product, with a focus on the variety of 3D building heights available. The authors concluded that with the large investment in the processes and infrastructure, NMCAs “need to get 3D modelling almost right the first time” – and produce data that is fit for purpose, of a high enough quality and that can be maintained and developed over time. To help understand this mismatch between availability of 3D data and its use, EuroSDR 3D SIG have recently completed a study on identifying the economic value of 3D geographic information (Wong 2015; Stoter et al. 2016). Six use cases were selected for value chain analysis, with two selected (Floor Management and Urban Planning) for further cost-benefit analysis study (EuroSDR 2017). Detailed results will be published by the end of 2017.
2.2 User-centred design
User-centred design is the process in which end-users influence how a design takes shape (Abras et al. 2004). It places a high importance on usability and user needs at every stage of product development leading to more effective, efficient, and safer products with higher levels of acceptance and success (Sharp et al., 2002), and a large part of user-centred design is the gathering and understanding of user requirements.
2.2.1 Requirements gathering methods: Requirements gathering or elicitation is the process of collecting the requirements of a system from users, customers, and other stakeholders with the goal of producing a set of requirements which is, as far as possible, complete, consistent, relevant and reflects what the users want (Sommerville and Sawyer, 1997). There are many suggested approaches and frameworks in gathering user requirements (Alexander and Beus-Dukic, 2009; Goldsmith, 2004; Miller, 2009; Pohl, 1994; Sommerville and Sawyer, 1997) but all involve the use of one or more quantitative or qualitative requirements gathering methods. Traditional gathering techniques include questionnaires and surveys, interviews, focus groups, observation, and document analysis (Tuunanen, 2003).
Requirements gathering methods are often used in combination as a means of triangulation - this allows the researcher to draw upon multiple sources of evidence and seek convergence and corroboration through different data sources and methods (Bowen, 2009). It can be seen to provide a “confluence of evidence that breeds credibility” (Eisner, 1991). The
mixed-methods approach allow different methodologies to compensate for each other.
2.2.2 Questionnaires and interviews: Of the requirements gathering methods, the two most commonly used are questionnaires and interviews. Sharp et al. (2007) suggests that interviews and questionnaires are best used during the beginning and early part of the design cycle, with focus groups, on-site observation, role playing and usability testing better suited for the mid to late stages. Self-administered surveys and questionnaires provide a quick and relatively cheap way to gather quantitative and qualitative data from a large group of people. The process takes a relatively short period of time and the use of web-based questionnaires can allow for easy dissemination to the respondents.
Gill et al. (2008) notes that there are three fundamental types of research interviews: structured; semi-structured and; unstructured. Each vary in levels of organisation. Where structured interviews are essentially verbally administered questionnaires, unstructured interviews are entirely open, without any preconceived theories or ideas. Semi-structured interviews provide a few key questions that can define the subject area, but with the flexibility for interviewees to add more detail and allow for discovery of information that may not have been previously considered pertinent by the researcher. Qualitative data methods are believed to provide a “deeper” understanding of social phenomena than from quantitative methods such as questionnaires (Gill et al., 2008). Interviews, however, can be costly and time-consuming in setting up, interviewing, transcribing, and analysing.
3. METHODOLOGY
3.1 Selecting a Requirements Elicitation Method
The choice of requirements elicitation methods was based on meeting the following needs to address the research objectives:
1. There must be a balance between breadth (to ensure as many potential users of 3D geographic information are covered) and depth (to ensure that enough useful information can be elicited);
2. Combining diverse elicitation approaches should optimise the quality of the data (as suggested by Bowen, 2009). Consistency within respondents can be checked by gathering similar information using various methods.
3. The technique(s) should be administrable within the time-frame of the study;
may be appropriate in future work to gain a deeper understanding of the user.
3.2 Participants
The main target group of the questionnaire and interviews were professionals who work either directly or indirectly with geographic information. As the applications of GI are numerous, a fully random sample that covered all the areas of interest would be difficult to ascertain. Therefore, a purposive maximum variation sample used in this study, whereby a wide range of participants were selected to sample for heterogeneity and maximise diversity relevant to the research questions. The participants were recruited within the authors’ personal network, Ordnance Survey’s network, through online special interest groups, mailing lists and social media. The web-based questionnaire was distributed via email and the use of chain sampling recruited further participants within the acquaintances of existing participants.
3.3 Formulating the questions
The full questionnaire can be found at: https://opinio.ucl.ac.uk/s?s=43711. Participants were asked a range of questions which fell within four sections:
1. Overview of GIS experience 2. Who are your end users? 3. Knowledge of 3D GIS
4. Existing and potential uses of 3D or 3D GIS
Sections 1 and 3 aimed to understand the awareness of the participant of both 2D and 3D geographic information technologies. Section 2 and 4 explored the applications and specific tasks the participant may use geographic information for in 2D and 3D, as well as both currently and potentially in the future. As users may not be familiar with 3D GI, caution was taken to ensure that participants were able to understand the questions and articulate their views by not using overly technical language.
3.1 Ethics and data protection
Only summarised results are presented in this study, which ensure that individual participants cannot be identified, allowing for open and candid discussions. Adequate measures were carried out to ensure confidentiality of the participants’ responses1.
3.2 Pilot and full study
A pilot study of the questionnaire was carried out with 10 participants to pre-test the questions prior to the full-scale study. This allowed the identification of any problems with any ambiguities, vagueness, or inaccuracies. Two main changes resulted from the pilot. Firstly, participants found the questionnaire to be too long and disliked repetition of questions between use of 2D and 3D. Secondly, participants found hypothetical questions on 3D GI (e.g. “Is there anything you would love to be able to do in 3D?”) very difficult to answer. The final questions were altered accordingly to incorporate the feedback from the pilot.
1This study is compliant with the Data Protection Act 1998. Data Protection
Registration Number: Z6364106/2016/01/27. UCL Ethics Project ID Number: 8319/001.
2Coding carried out using NVivo11, a computer aided qualitative data analysis tool
For the full study, the final questionnaire was delivered on a web-based survey tool. The tool provided a framework to distribute surveys, manage responses and generate summary reports. Semi-structured interviews were carried out in person with a guide to structure the process, corresponding to the four sections outlined in section 3.3.
3.3 Data analysis
Each interview was recorded and transcribed manually. Both the responses from the questionnaires and the interviews were imported and coded.2 For the interviews, thematic analysis was selected as the most appropriate approach in answering the research questions. It provided a clear structure to record patterns within the data using a transparent, coherent, and consistent coding strategy. The framework was designed to seek for repetition, similarities and differences within the data allowing for responses from participants of a wide-range of backgrounds to be analysed under a single framework.
4. RESULTS 4.1 Summary of the questionnaire results
A total of 64 responses were received, although at different levels of completion. From the total, 35 responses were fully completed. The disparity in completion rate can be attributed to the structure of the questionnaire. While it begins with relatively simple and closed questions, the latter half included open-ended questions which required the participants to produce an original and personal response. The incomplete responses were not discarded as the replies to the closed-ended questions were still useful. The sample size n for each question is noted in the caption of each of the figures below to indicate the absolute number of responses. A selection of results is presented below.
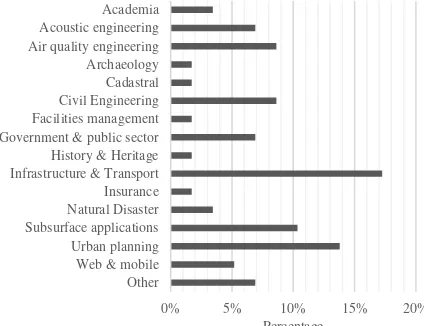
Figure 1 presents the distribution of professions the participants work in. Although there was overrepresentation within infrastructure & transport and urban planning, there was otherwise a good spread of participants. Note that of the suggested applications, the following sectors were not represented by any participant: arts & entertainment, emergency services, forestry, navigation & routing, solar, and virtual reality & gaming.
Figure 1. Which sector do you work in? (n=53)
0% 5% 10% 15% 20%
Other Web & mobile Urban planning Subsurface applications Natural Disaster Insurance Infrastructure & Transport History & Heritage Government & public sector Facilities management Civil Engineering Cadastral Archaeology Air quality engineering Acoustic engineering Academia
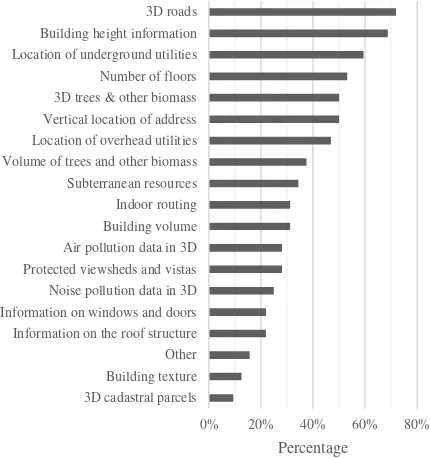
Potential of 3D geographic information: Participants were presented with a list of suggested 3D geographic information and were asked which they would use it within their day-to-day work. Note that the participants were free to interpret what each category of 3D information represented and its content included. For example, the category of 3D roads encompasses everything from simple 2.5D linear features with a single height to “true” 3D features that can model complex bridges and overpasses. This simplification allowed the participants more freedom to consider the 3D information and its applications more abstractly, without being overburdened with technical details.
Figure 2. If you had access to any of the following 3D information, which would you use in your day-to-day work?
(n=32)
Figure 2 shows the wide range of potential 3D geographic information selected by the participants. The top six include: 3D roads (72%); building height (69%); location of underground utilities (59%); number of floors of a building (53%) and; vertical location of an address (50%). The participants were asked to elaborate on their perceived potential uses of the different 3D information. The responses, however, were predominantly single-sentenced and vague. There was a tendency to allude to 3D being “useful” and “beneficial” without explicitly defining its application.
Requirements by application: The spread of user groups show in Figure 1 allowed the exploration of differences in requirements between the sectors. Participants identifying themselves from the urban planning sector tended towards a dichotomous approach in requirements. 3D information on building attributes such as height, number of floors, vertical location of addresses as well as other infrastructure such as roads were highly selected. There was, however, little to no interest in other suggested 3D geographic information, perhaps due to the scale the participants worked in. Urban planners tend to work at a regional or local scale, thus building scale information on volume, windows and doors, texture, and roof structure may not have been of interest. In contrast, air quality & acoustic engineers may work at building and/or street scale, as both pollutant and signal propagation can vary immensely over a short distance. The results showed that participants who identified themselves as air quality or acoustic engineers had similar requirements to urban
planners but had additional interest in building scale information. Looking towards the subsurface application sector, the expected requirements for underground utility and mineral information were confirmed by the results. There is, however, an equal level of interest in above ground information. Within the free-text area, participants from the subsurface application sector expressed that above ground information would be useful for tasks such as assessing anthropogenic change and exposure analysis for identifying infrastructure vulnerable to certain natural hazards.
While general trends could be extracted from each sector, additional work with a larger sample is required to identify more specific information on 3D requirements. Further, revising the question to allow for a less binary response would be useful in gauging the level of interest for each piece of 3D geographic information.
4.1.1 Awareness of 3D GI: This was assessed through four questions:
• Are you aware of 3D data and/or 3D GIS?
• Do you actively use 3D data and/or 3D GIS?
• Do your day-to-day deliverables include a 3D
component or any aspect of the vertical dimension?
• If you are not using 3D data and/or 3D GIS, why?
Of the participants, 54% of the participants have at least a basic understanding or are actively using 3D, while 31% have either just heard of it in passing or would like to learn more. 14% have no knowledge or awareness of 3D. A question on the participant’s active use of 3D data and/or GIS reveals that that just under a quarter (23%) of participants actively use 3D, with another 17% of participants indicating they use 3D, but only rarely. It is promising to see that while 57% of participants don’t use 3D, of that group, 92% have expressed interest in using 3D in the future. A follow-up binary question asked the participants if their day-to-day deliverable included a 3D component or any aspect of the vertical dimension. This was a simple question used to identify the split of the participants and their perception on the third dimension in their work. The result showed that 69% of the participants consider their work to have a component of 3D. This is in stark contrast to the previous question where only 23% of the participants actively use or interact with 3D.
Lastly, participants were asked “If you are not using 3D data and/or 3D GIS, why?”. The aim was to directly enquire about the specific barriers to the adoption of 3D within their organisation. Two responses stand out as the barrier to 3D: 1) Role currently does not include 3D (29%) and; 2) Did not know it existed (35%). Participants were asked to elaborate on further in free texts. Some of the comments include:
“It often exceeds level of detail required i.e. we get an answer in 2D that is accurate enough. Additional cost is not worth it.”
“3D software is still slow and requires a lot of pre- processing of the data. Also, often not required for the type of business questions that are being asked.”
“A lot of the use cases we have would not benefit from the additional overhead of dealing with 3D.”
0% 20% 40% 60% 80%
3D cadastral parcels Building texture Other Information on the roof structure Information on windows and doors Noise pollution data in 3D Protected viewsheds and vistas Air pollution data in 3D Building volume Indoor routing Subterranean resources Volume of trees and other biomass Location of overhead utilities Vertical location of address 3D trees & other biomass Number of floors Location of underground utilities Building height information 3D roads
3D Information Participants’ comments
Vertical location of address
I think we would find most useful the floor plans of buildings and their actual heights. For example, they have actual building heights in Ordnance Survey data which is great, because we can create 3D models of our estate if we want. However, it’s not much use to use when we’re trying to display the complexity of the urban estate as it’s known with its different floors. So, it’d be good to understand the vertical location of each of those floors.
Roof structure It’s quite helpful because we have a contract to maintain and work out how to get up to the green roofs. They are often built without access to them. We’ve got a dataset of green roofs, but that’s really hard to get updated because nobody’s monitoring them
We tried to find information on the roof, the footprint of the roof for each of the buildings, but we couldn’t get it. We had done building surveys, we had done floor plates of buildings for all the buildings down the street, but no one had ever done the roof part of it.
3D Cadastral parcels
We own cables on the outside of the building, but somebody else owns the building, yet there’s an overhang and we’re responsible… well it gets complicated.
…it’d be useful for the Land Registry and it would be useful if they had some sort of cadastral mapping which was 3D.
To handle complex ownership situations that we have… How we deal with it at the moment is we just register the footprint of the building and the airspace is dealt within the legal documentation. It doesn’t necessarily need to be “mapped” to a high degree of accuracy.
Air and noise pollution in 3D
I can see them being useful for planning purposes to prove that you aren’t really adding to noise pollution if you’re higher up. For example, if you have a roof terrace on a restaurant or a pub, then noise pollution might be bad.
If you need to take into account, let’s say, noise pollution at different levels in your planning application that would force our hand and suddenly make a 3D dataset of noise pollution extremely valuable to us, which we would then be willing to pay for.
View sheds and shadow analysis
Because of planning and working with planners and on their protected views, having 3D to see the building heights and information on protected views would be great.
For estate regeneration, they have to think about the impact on surrounding buildings when proposing new buildings. If you are going to put someone else into the shade, that’s a big deal. So, I imagine that 3D data would be useful for modelling that.
Utilities We got so many old services, that are redundant, but are in the public realm but nobody has the ownership for. Knowing when they are going to put in a service instead of just showing up and it’s there or you come across them randomly.
Trees and other biomass
We own and manage forests, but we also have the responsibility to manage trees on a lot of rural
estate…The next step from there I can see is what are the trees, how big are they, are they mature, are they young, what’s the likelihood they need some sort of risk assessment, are they more likely to fall over, for example.
Volume of trees and other biomass could be useful for total contribution type work and to look at carbon sequestration
We also capture details on the height information of trees because the network, for the sub-surface sections, you need to monitor some of this vegetation because they have a direct relationship with the (rail) track. By knowing the embankment, and the nature of the land, you can determine if a landslips or treefall or leaves might happen.
Figure 3. If you are not using 3D data and/or 3D GIS, why not? (n=34)
4.2 Summary of the interview results
Eight face-to-face interviews were carried out with 13 participants. The interviewees were involved in a variety of different GI applications including six from local government, and one representative each from real-estate, energy, environmental planning, transport services, subsurface, construction, and tourism. These sectors were selected to include the some of the dominant applications that were suggested within previous user studies (see Section 2.1).
4.2.1 Current state of 3D geographic information: The interviewees were either actively involved existing uses of 3D within their organisations or were aware of work done by colleagues involving 3D:
“We will use it when we are using multi criteria analysis, I’m sure, and for a very few purposes on-shore, we probably use it but we employ consultants to do things like viewsheds.”
There is an understanding of which part of their work contained inherently 3D components but are represented in 2D. For example:
“Yes, we got tons of underground layers, tunnels basically, but the data is just stored as lines at the moment. This means you wouldn’t know which tunnel is above the other, as it’s still 2D.”
There was, however, a lack of clear developed examples of the use of 3D GI.
4.2.2 Barriers to 3D geographic information adoption: Part of the design of the interview was identify areas where inadequacies from 2D representation could be potentially solved with the use of 3D information. On six occasions, the inadequacies indicated by the interviewees focused more on inherent 2D data quality issues. For example:
Currency – “If it’s insufficient, then there is no data. The
accuracy and currency of the data can also be an issue. For instance, if the data is very old and things have changed, and it’s not updated then you have an issue where it affects the decision.”
Missing data – “More often than not, either you don’t have
the data you want…or it doesn’t exist.”
The participants also identified other barriers to the adoption of 3D beyond the data itself. In some instances, the data quality issue is inherently 3D. One example is the quality of utilities data:
“The big thing that was missing, really, was the 3D element. So, they’ll give you the 2D, tell you where it is, but they won’t tell you how deep below ground it is. Or if they did, it would be a nominal value which might or might not be correct.”
Beyond data quality, there were also organisational or business-related barriers which are difficult to overcome by individuals. resulting in the continuation along its current trajectory:
“The organisation will probably be a little bit behind in the way they think about 3D and the future utility of it because they are so engrained in their day to day processes.”
This resistance to organisational change can be further split into resource and routine rigidity:
“We have a big workload and we don’t have enough requests from the business to start spending time on it.”
“…it’s expensive and we’ve never been taught or trained to do that.”
Time and cost is clearly a factor when considering the uptake of 3D geographic information. The lack of a business-case meant that the interviewees were not driven to invest neither time nor money into 3D geographic information. There was a lack of proven cases and the perceived benefit of 3D over existing 2D procedures was less than the total investment into the technology. From an individual perspective, the interviewees were generally positive about the potential of 3D, but the concept tend to be outside their expert and knowledge domain. This unfamiliarity often made 3D seem to be overly complex:
“It’s a little bit overwhelming at the moment in terms of the technical-ness of it. It just feels very different. So, from that point of view it just feels like a whole new other thing to learn about and try to figure out how to use.”
Six of the interviewees expressed that they did not know how to interact with or handle 3D data. Although some interviewees and their organisations were 3D capable, the majority did not have the hardware capable to handle 3D. Existing software was also inadequate. The lack of suitable tools to handle, manipulate and interchange 3D data meant that custom applications had to be created in-house.
Lastly the lack of expert knowledge has led to many misconceptions of 3D among the users interviewed. There is a need to define the place and function of 3D geographic information. While some interviewees were aware of the limitations and the capability of 3D GI, others were less well informed. This led to an unrealistic expectation of what 3D GI could deliver – e.g. 3D GI is unlikely to replace detailed architectural CAD models. There is therefore a need to define what 3D GI excels at, but also the limitations of the technology.
4.2.3 Benefits of 3D geographic information adoption: The interviewees could identify a number of benefits of implementing 3D within their organisation and day-to-day work. The responses, however, were relatively vague and lacked concrete examples of benefits.
4.2.4 Potential uses of and user requirements for 3D geographic information: The interviewees were positive about 3D and had many ideas of potential uses of 3D within their fields. A selection of responses is presented in Table 1.
0% 10% 20% 30% 40%
Did not know it existed Lack of knowledge Lack of data Lack of software Lack of hardware No 3D in role
5. DISCUSSION
The objective of this study was to investigate the user requirements for three-dimensional geographic information and to provide an indication of the state of 3D GI as well as assessing the barriers to the adoption of 3D within the UK. Key findings and recommendations are presented below.
5.1 Requirements for 3D geographic information
Of the wide range of potential 3D geographic information selected by the participants, the top six include: 3D roads (72%); building height (69%); location of underground utilities (59%); number of floors of a building (53%) and; vertical location of an address (50%). The interest from the participant is not only in building-centric information, but equally, the information on the surrounding infrastructure (utilities and roads). Derived 3D information such as air and noise pollution analysis, view shed analysis and shading analysis were also of great interest to the participants. Although the survey participants and interviewees were able to provide one or two examples of potential applications, additional work is required to reveal more specific applications for different geometric and semantic features. This would allow data producers such as NMCAs to justify in producing and providing certain additional 3D information which would meet the 3D needs of specific applications. In general, participants and interviewees found it difficult to articulate what they might want from 3D GI – especially those where 3D is not within their expert domain. Although in both the questionnaire and interviews, participants were able to provide some loose examples, additional work is required to reveal more specific applications for different geometric and semantic features.
Within this study, the inherent selection bias within both the questionnaire and interviews due to the sampling methodology (outlined in section 3.2) must be noted. This lead to overrepresentation in some sectors and underrepresentation in others. For example, the high number of participants interested in 3D roads (Figure 2) reflected the number of participants selecting infrastructure and transport as their sector (Figure 1). The sampling method also focused on professionals already involved with geographic information. It was assumed that in areas where 2D geospatial data is used, there was potential to extend the workflow into 3D since the world around us is three-dimensional. However, there may be applications where 3D does not improve an existing process, but makes new applications possible (Stoter et al. 2013). These applications are unlikely to be captured using the current population sample. Nevertheless, the results provide a useful insight into the current state of 3D with the United Kingdom from a user perspective.
With regards to the requirements, a distinction must be made whether the interest is due to: a) the data is useful to the participant because of the inherent additional information it provides through 3D; or b) the data is useful to the participant, because the information is currently unavailable/not collected/does not exist. For example, the roof structure of buildings in 3D is inherently useful because of its dimensionality. Conversely, the 3D location of utilities is useful – but more so because often the data is currently missing or incomplete. Data producers must therefore be cautious in distinguishing if a requirement for 3D geographic information is useful from providing additional functionality from the third dimension, or if simply serves to fill the void of missing 2D data.
5.2 Current status of 3D in the UK
Within the participants, 54% have at least a basic understanding of 3D or are actively using 3D. Further, 69% of the participants considered their work to have a component of 3D – yet in contrast, only 23% of the participants actively use or interact with 3D information. Participants could be broadly split into two groups: 1) the early adopters and; 2) the late majority. The early adopters were characterised by organisations who have the ability and resources to try out new technologies and integrate new ideas. These tend to be organisations who already utilised 3D to a certain extent within their day-to-day operations and possessed a much better understanding of the capabilities of 3D GIS. The second group, the late majority, were characterised by a lack of knowledge and resources to adopt 3D. Although they may be optimistic and positive about the technology, they tended to have high or unrealistic expectations of the capability of 3D GIS. The late majority tend to not have the time or monetary resources to investigate new technologies such as 3D and tend to wait for the business need to push them into new ways of working. They may also still be struggling with existing 2D implementations of GIS. There is therefore a need to educate the late majority to help overcome any barriers in investing in and adopting 3D technology.
Comparatively, the requirements for and barriers to 3D geographic information in the United Kingdom exhibit similar traits to that of other European countries identified in Stoter et al., (2016a). Data availability, however, is still an issue in the UK as there is a lack of open 3D city models compared to other countries. While the supplementary Building Height Attribute dataset has established Ordnance Survey within the 3D field, there is a need for a committed national program to continue the momentum. Part of the problem will be achieving a balance of being a provider of licensed paid data, in an otherwise open-data era.
Despite the disparity between data availability, the United Kingdom suffers from the same dominant barriers to the adoption of 3D GI as other countries. The lack of awareness and education, the high investment cost, and the lack of clear business cases inevitably limits the emergence of the early majority to allow for 3D, as a technology, to gain critical mass and traction within the field. Improving the level of knowledge of 3D within GI users should help dispel any misconceptions and inflated expectations of the technologies within the user groups. As suggested by Walter (2014), an inevitable realisation of the market potential of 3D GIS from the software and hardware manufacturers should result in higher investment into the field and hopefully overcome many of these barriers.
5.3 Summary of recommendations
The recommendations of this study are summarised below:
Understanding application-specific user requirements – As 3D is more complex than 2D, a single, multiple-purpose dataset is impractical and unfeasible. By understanding application-specification requirements, 3D datasets can be tailored for different users to suit their needs. From the questionnaires and interviews, the results indicate that building-centric information is desirable but in addition to information on the surrounding infrastructure as well. Further work is required to identify specific building level geometry and semantic requirements.
educate the late majority to help overcome any barriers in investing in and adopting 3D technology.
Defining the economic value of 3D GI - Participants struggle to see the value of 3D GI, despite being able to see the potential within their workflow. The ability to define an exact value of extending to 3D should help build a convincing business case to justify the investment.
5.4 Future work
Several opportunities for future work arose from this study. Firstly, repeating the exercise with a larger sample and with non- experts would be beneficial. Secondly, further work is required in capturing more specific user requirements for specific applications of 3D GI. In particular, there is a need for a more detailed understanding of the usefulness of specific 3D geometric and semantic features in relation to specific applications. The challenge here is in capturing a representative sample of adequate size to encompass the multitude of GI-applications as well as acquiring enough detail to elicit comprehensive requirements.
Requirements gathering forms the first steps of the user-centred design process. Once the goals and requirements have been defined, the iterative development of design solutions with users should be carried out. Note that this must not be a linear process; for 3D GI, new use cases are expected to emerge over time (Biljecki et al., 2015) thus there is also a need for continued requirements gathering to capture any new applications.
6. CONCLUSION
Understanding the user requirements and needs is an important step towards designing 3D data that is effective and usable. The results from this study show that within the UK, while some applications lead the field with a high adoption of 3D, others are laggards, predominantly from organisational inertia. While individuals may be positive about the use of 3D, many struggle the justify the value and business case for 3D GI. Further work is required to identify the specific geometric and semantic requirements for different applications.
REFERENCES
Abras, C., Maloney-Krichmar, D. and Preece, J., 2004. User-centered design. Bainbridge, W. Encyclopedia of Human-Computer Interaction. Thousand Oaks: Sage Publications, 37(4), pp.445-456.
Alexander, I.F., Beus-Dukic, L., 2009. Discovering requirements: how to specify products and services. John Wiley & Sons.
Biljecki, F., Stoter, J., Ledoux, H., Zlatanova, S. and Çöltekin, A., 2015. Applications of 3D city models: State of the art review. ISPRS International Journal of Geo-Information, 4(4), pp.2842-2889.
Bowen, G.A., 2009. Document analysis as a qualitative research method. Qualitative research journal 9, 27-40.
Eisner, E.W., 1991. The enlightened eye: Qualitative inquiry and the enhancement of educational practice. Prentice Hall.
EuroSDR 2017. Identifying the economic value of 3D geoinformation, http://www.eurosdr.net/workshops/identifying-economic-value-3d-geoinformation
Gill, P., Stewart, K., Treasure, E., Chadwick, B., 2008. Methods of data collection in qualitative research: interviews and focus groups. British dental journal 204, 291-295.
Goldsmith, R.F., 2004. Discovering real business requirements for software project success. Artech House.
Harris, L.R., Brown, G.T.L., 2010. Mixing interview and questionnaire methods: Practical problems in aligning data.
Jazayeri, I., Rajabifard, A., Kalantari, M., 2014. A geometric and semantic evaluation of 3D data sourcing methods for land and property information. Land Use Policy 36, 219 - 230.
Miller, R.E., 2009. The Quest for Software Requirements. Maven Mark Books.
Pohl, K., 1994. The three dimensions of requirements engineering: a framework and its applications. Information systems 19, 243-258.
Sargent, I, Holland, D., Harding, J. 2015. The Building Blocks of User-Focused 3D City Models. ISPRS International Journal of GeoInformation, 4(4), 2890–2904.
Sharp, H., Rogers, Y. and Preece, J., 2007. Interaction design: beyond human-computer interaction.
Sommerville, I., Sawyer, P., 1997. Requirements engineering: a good practice guide. John Wiley & Sons, Inc.
Stoter, J.E., Streilein, A., Pla, M., Baella, B., Capstick, D., Home, R., Roensdorf, C., Lagrange, J.P. 2013. Approaches of national 3D mapping: Research results and standardisation in practice. In Proceedings of the 8th 3DGeoInfo Conference & WG II/2 Workshop, Istanbul, Turkey, 27–29 November 2013.
Stoter, J., Vallet, B., Lithen, T., Pla, M., Wozniak, P., Kellenberger, T., Streilein, A., Ilves, R. and Ledoux, H., 2016a. STATE-OF-THE-ART OF 3D NATIONAL MAPPING IN 2016. International Archives of the Photogrammetry, Remote Sensing & Spatial Information Sciences, 41.
Stoter, J., van Altena, V., Post, M., Burghardt, D. and Duchêne, C., 2016b. Automated Generalisation Within NMAs in 2016. ISPRS-International Archives of the Photogrammetry, Remote Sensing and Spatial Information Sciences, pp.647-652.
Tuunanen, T., 2003. A new perspective on requirements elicitation methods. JITTA: Journal of Information Technology Theory and Application 5, 45.
Walter, V., 2014. A survey on state of the art of 3D Geographical Information Systems. European Spatial Data Research, EuroSDR Official Publication No. 64, 66-113.