Professor;
%
Associate Proffesor;
%
Assistant Proffesor;
%
Lecturer;
%
Others;
%
TABLE 2. ACADEMIC CLASSIFICATION OF TEACHING STAFF 2015
GRAPH 1. ACADEMIC CLASSIFICATION OF TEACHING STAFF 2015
*) Graduate School's lectures are from facultiesDATA UM
UM's Data
TABLE 1. GENERAL DATA (AS OF DECEMBER 2015)
Total Student Body
Total Teaching Staff
Total Administration Staff
Total Budget (IDR)
2
Land Area (m )
2
Building Area (m )
2
Laboratories (m )
31,405
936
729
589,503,642,000
517,932
82,833.64
18,284.82
NO FACULTY PROFESSOR
ASSOCIATE PROFESSOR
ASSISTANT
PROFESSOR LECTURER OTHERS TOTAL
Male Female Male Female Male Female Male Female Male Female Male Female
1. Faculty of Education 13 3 49 26 32 14 7 6 6 6 107 55
2. Faculty of Letters 23 3 26 21 28 24 13 12 8 5 98 65
3. Faculty of Mathematics
and Science 11 6 58 33 31 19 8 8 8 12 116 78 4. Faculty of Economics 7 2 24 11 16 18 2 8 3 7 52 46
5. Faculty of Engineering 5 - 58 12 42 19 13 4 7 4 125 39
6. Faculty of Sport
Science 1 - 14 1 11 5 3 4 5 6 34 16
7. Faculty of Social
Science 6 1 36 5 15 5 4 3 3 6 64 20
8. Faculty of Educational
Psychology 1 - 3 2 1 4 1 5 1 3 7 14
9. Graduate School *) - - - -
TABLE 4. RATIO OF TEACHING STAFFS TO STUDENT 2015
TABLE 5. APLICANTS, ENROLLED AND RATIO OF NEW TESTED BACHELOR
STUDENT ACCEPTANCE FOR SNMPTN 2015
* The u er of stude s does ot i lude Graduate S hool's Stude t
bh C! / Ü[ Çò Ç9! / I LbD {Ç! CC {ÇÜ59bÇ w! ÇLh
Faculty of Education 162 3,751 1:23
2. Faculty of Letters 163 4,479 1:27
3. Faculty of Mathematics and Science 194 3,269 1:17
4. Faculty of Economics 98 5,686 1:58
5. Faculty of Engineering 164 5,376 1:33
6. Faculty of Sport Science 50 1,907 1:38
7. Faculty of Social Science 84 3,089 1:37
8. Faculty of Educational Psychology 21 768 1:37
Total 936 28,325 1:30
9. Graduate School - 3,080 -
Total 936 31,405 1:34
NO FACULTY APPLICANTS NO OF ENROLLED NO COMPETATION (%) DEGREE OF
1. Faculty of Education 412 8,313 4.96
2. Faculty of Letters 439 7,939 5.53
3. Faculty of Mathematics and Science 398 8,083 4.92
4. Faculty of Economics 610 15,989 3.82
5. Faculty of Engineering 590 12,044 4.90
6. Faculty of Sport Science 174 2,974 5.85
7. Faculty of Social Science 383 5,154 7.43
8. Faculty of Educational Psychology 100 3.242 3.08
Total 3,106 63,738 4.87
TABLE 3. EDUCATIONAL BACKGROUND OF TEACHING STAFFS 2015
GRAPH 2. EDUCATIONAL BACKGROUND OF TEACHING STAFFS 2015
NO FACULTY DOCTORATE MASTER BACHELOR TOTAL
Male Female Male Female Male Female Male Female
1. Faculty of Education 45 12 57 39 5 4 107 55
2. Faculty of Letters 38 26 54 38 6 1 98 65
3. Faculty of Mathematics and
Science 49 27 66 49 1 2 116 78
4. Faculty of Economics 27 19 24 27 1 0 52 46
5. Faculty of Engineering 31 9 89 30 5 0 125 39 6. Faculty of Sport Science 12 1 19 11 3 4 34 16 7. Faculty of Social Science 20 2 43 18 1 - 64 20
8. Faculty of Educational
Psychology 4 1 3 13 - - 7 14
9. Graduate Programs *) - - - -
Total 226 97 355 225 22 11 603 333
*) Graduate School's lecture are from the faculties
DOCTORATE;
%
MASTER; 80 2%
TABLE 8. TOTAL STUDENT OCCORDING TO GENDER 2015
GRAPH 3. TOTAL STUDENT OCCORDING TO GENDER 2015
NO FACULTY MALE FEMALE TOTAL
TOTAL % TOTAL %
1. Faculty of Education 1,023 27.28 2,728 72.72 3,751
2. Faculty of Letters 1,777 39.67 2,702 60.33 4,479
3. Faculty of Mathematics and Science 702 21.47 2,567 78.53 3,269
4. Faculty of Economics 2,061 36.24 3,625 63.67 5,686
5. Faculty of Engineering 3,545 65.94 1,831 34.06 5,376
6. Faculty of Sport Science 1,443 75.66 464 24.34 1,907
7. Faculty of Social Science 1,409 45.61 1,680 54.39 3,089
8. Faculty of Educational Psychology 240 31.25 528 68.75 768
9. Graduate School 1,363 44.25 1,717 55,75 3,080
Total 13,563 43.19 17,842 56.81 31,405
, , , , , , Faculty of
Educatio Faculty of
Letters Faculty of Mathe atics
a d Scie ce
Faculty of
Eco o ics Faculty of
E gi eeri g Faculty of Sport Scie ce Faculty of Social Scie ce Faculty of
Educatio al Graduate , , , , , , , , , , , , , , FEMALE MALE
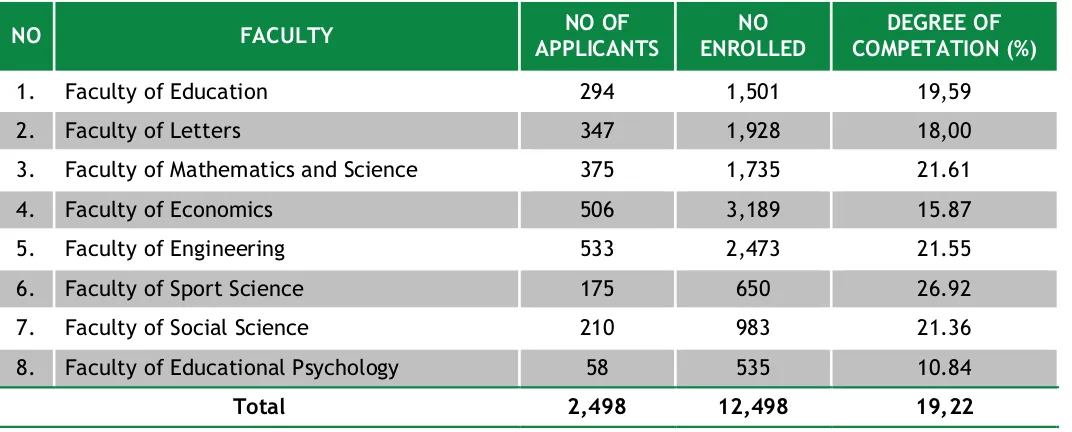
TABLE 7. APLICANTS, ENROLLED AND RATIO OF NEW TESTED BACHELOR
STUDENT ACCEPTANCE FOR MANDIRI 2015
NO FACULTY NO OF
APPLICANTS
NO ENROLLED
DEGREE OF COMPETATION (%)
1. Faculty of Education 294 1,501 19,59
2. Faculty of Letters 347 1,928 18,00
3. Faculty of Mathematics and Science 375 1,735 21.61
4. Faculty of Economics 506 3,189 15.87
5. Faculty of Engineering 533 2,473 21.55
6. Faculty of Sport Science 175 650 26.92
7. Faculty of Social Science 210 983 21.36
8. Faculty of Educational Psychology 58 535 10.84
Total 2,498 12,498 19,22
TABLE 6. APLICANTS, ENROLLED AND RATIO OF NEW TESTED BACHELOR
STUDENT ACCEPTANCE FOR SBMPTN 2015
NO FACULTY NO OF
APPLICANTS
NO ENROLLED
DEGREE OF COMPETATION (%)
1. Faculty of Education 345 5,498 6.28
2. Faculty of Letters 325 6,089 5.34
3. Faculty of Mathematics and Science 292 5,982 4.88
4. Faculty of Economics 469 9,533 4.92
5. Faculty of Engineering 464 10,137 4.58
6. Faculty of Sport Science 171 2,779 6.15
7. Faculty of Social Science 281 4,228 6.65
8. Faculty of Educational Psychology 76 1,592 4.77
TABLE 11. TOTAL GRADUATES 2015
No Faculty of Education Male Female Total
Total % Total %
1. Doctorate (S3) 433 58.60 306 41.40 739
2. Master (S2) 930 39.72 1,411 60.28 2,341
3. Bachelor (S1) 11,578 42.33 15,769 57.67 27,347
4. Diploma (D3) 622 63.60 356 36.40 978
5. Diploma (D2) - - - - -
6. Non Degree - - - - -
Total 13,563 43.20 17,842 56.80 31,405
Doctorate S ;
%
Master S ;
,
%
Bachelor S ;
,
%
Diploma D ;
%
GRAPH 4. TOTAL GRADUATES 2015
TABLE 10. GRADE POINT AVERAGE (GPA) BY FACULTY 2015
No Faculty
Study Program Doctorate
(S3)
Master (S2)
Bachelor (S1)
Diploma (D3)
Diploma (D2)
1 Faculty of Education - - 3,55 - -
2 Faculty of Letters - - 3,37 3,45 -
3 Faculty of Mathematics and Science - - 3,35 - -
4 Faculty of Economics - - 3,46 3,41 -
5 Faculty of Engineering - - 3,32 3,21 -
6 Faculty of Sport Science - - 3,38 - -
7 Faculty of Social Science - - 3,34 - -
8 Faculty of Educational Psychology - - 3,26 - -
9 Graduate School 3,63 3,70 - - -
TABLE 9. TOTAL STUDENT BY FACULTY 2015
NO FACULTY
STUDY PROGRAM
TOTAL Doctor Master Bachelor Diploma
(D3)
Diploma (D2)
1 Faculty of Education - - 3,751 - - 3,751
2 Faculty of Letters - - 4,302 177 - 4,479
3 Faculty of Mathematics and Science - - 3,269 - - 3,269
4 Faculty of Economics - - 5,479 207 - 5,686
5 Faculty of Engineering - - 4,782 594 - 5,376
6 Faculty of Sport Science - - 1,907 - - 1,907
7 Faculty of Social Science - - 3,089 - - 3,089
8 Faculty of Educational Psychology - - 768 - - 768
9 Graduate School 739 2.341 - - - 3.080
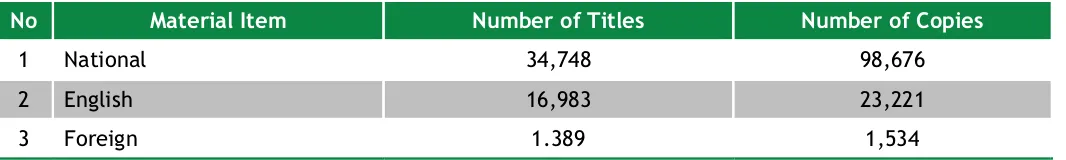
TABLE 12. LIBRARY COLLECTION 2015
TABLE 13. RESEARCH TITLE AND FUNDING 2015
No Material Item Number of Titles Number of Copies
1 National 34,748 98,676
2 English 16,983 23,221
3 Foreign 1.389 1,534
No Funding Sources No of Titles Total Funding (IDR) Teaching Staff Involved