SEZE NÁHUATL, MICHOACÁN APINAYÉ BARASANA HUITOTO, M¥N¥CA COFÁN KAINGÁNG BANAWÁ AMUNDAVA USPANTECO POKOMAM, EASTERN LENCA MIXTEC, ALACATLATZALA
CH' OL, TUMBALÁ WAYUU BAFAW- BALONG /GWI /ANDA ANII BIALI BOLON YESKWA AKUM JORTO AWING ABAR ABON IKULU BESME DAZA APACHE, KIOWA FALA TEMACINE TAMAZIGHT GASCON
GASCON, ARANESECORSICAN GAGAUZ AARI ARRERNTE, EASTERN MALAGASY, ANTANKARANA BUNABA ALAWA SARA SILAKAU DUANO' BESISI AOHENG KAYAN, BUSANG BERAWANPALUANGANA
ASUMBOA DAYI MAORI BUTMAS-TUR BAKI AMBRYM, NORTH GUSAN ARAFUNDIBIYOM ABAGA IWAM AMTOALATIL DORI BUHUTU AIKLEP BIJORI AGARIYA ASURI HINUKH RUTULLEZGI SHE BLANG LAHU HMAR MOINBA ZAIWA BUGAN ERGONG
Towards A Categorization of Endangerment of the World's Languages
Geographic distribution of the 102 languages included in this study (Data from Ethnologue, 14th edition)
©2004 SIL International
TOWARDS A CATEGORIZATION OF ENDANGERMENT OF THE WORLD’S
LANGUAGES
by
M. Paul Lewis
Abstract Introduction Methodology
Languages Selected
Other Characteristics of the Sample The Evaluation Framework
Data Sources
A Categorization of the Level of Endangerment of the Languages Selected Scoring Considerations
Summary Results
Conclusions and Recommendations Summary Conclusions
Recommendations References
Table 1 – Languages Selected from Africa Region Table 2 – Languages Selected from Americas Region Table 3 – Languages Selected from Asia Region Table 4 – Languages Selected from Europe Region Table 5 – Languages Selected from the Pacific Region
Table 6 – Factor 1: Intergenerational Language Transmission Scale
Table 7 – Factor 3: Proportion of Speakers Within the Total Reference Group Table 8 – Factor 4: Loss of Existing Language Domains
Table 9 – Factor 5: Response to New Domains and Media
Table 10 – Factor 6: Materials for Language Education and Literacy
Table 11 – Factor 7: Governmental and Institutional Language Attitudes and Policies Table 12 – Factor 8: Community Members’ Attitudes toward Their Own Language Table 13 – Factor 9: Amount and Quality of Documentation
Table 14 – Language Endangerment Evaluation for Languages of Africa Table 15 – Language Endangerment Evaluation for Languages of the Americas Table 16 – Language Endangerment Evaluation for Languages of Asia
Abstract1
Language endangerment is a serious concern. Efforts to define what an “Endangered Language” is have been hampered by the complexity of the phenomenon, which has made it difficult to provide a succinct, generalizable, and readily comprehensible categorization scheme. At the UNESCO Experts Meeting on Safeguarding Endangered Languages (March 2003) a framework was proposed (Brenzinger et al. 2003) which uses nine factors of vitality and endangerment as a useable and relatively objective heuristic for the assessment of endangerment. This paper applies that framework to a diverse selection of the world’s languages sampled from the Ethnologue
(Grimes 2000) on the basis of geographic location and size in order to initiate and evaluate the feasibility of a comprehensive assessment of the state of the world’s languages. The usefulness, accuracy, and generalizability of this UNESCO framework is evaluated. The framework is applied to 100 languages from all parts of the world demonstrating different vitality profiles for different languages and exposing the varied nature of language endangerment. The nine factors considered are: (1) Intergenerational language transmission; (2) Absolute numbers of speakers; (3) Proportion of speakers within the total population; (4) Loss of existing language domains; (5) Response to new domains and media; (6) Materials for language education and literacy; (7) Governmental and institutional language attitudes and policies; (8) Community members’ attitudes towards their own language; and (9) Amount and quality of documentation.
Introduction
The endangerment and potential loss of the world’s linguistic diversity is a serious concern. Since the publication of a major article in the journal Language, (Hale, Krauss et al., 1992) linguists have increasingly turned their attention to the dangers of language loss and death and to the consequences of the loss of languages both as a source of data for their craft and as a decrease in the ethnolinguistic diversity in the world.
Even before 1992, however, linguists, sociolinguists, and linguistic anthropologists were developing a growing body of literature devoted to the phenomena which precipitate, accompany, and result from the processes of language shift, (e.g., Clyne 1981, Dow 1987, Dow 1988, Dressler 1981, Fishman 1964, Fishman 1966/1972, Fishman 1972, Gal 1978), language obsolescence, (e.g., Campbell and Muntzel 1989, Dorian 1973, Dorian 1977, Dorian 1980, Dorian 1986, Dorian 1989, Dressler 1972), and language death, (e.g., Denison 1977, Dimmendal 1989, Dorian 1981, Dressler and Wodak-Leodolter 1968, Dressler and Wodak-Leodolter 1977, Mufwene 2000). Another area of interest is the study of how language policy and language planning interventions can affect either positively or negatively the outcomes in situations where language maintenance is in question, (e.g., Fishman 1991, Fishman 2000). Attempts to catalog and map the languages of the world have also become an activity of increasing interest (Grimes 1992, 1996, 2000; Voegelin and Voegelin 1964–1966: Wurm, Adelaar and Crevels, forthcoming).
1 This paper was originally prepared for a poster session at the 2003 Annual Meeting of the American
In March 2003, the Intangible Cultural Heritage Unit of UNESCO sponsored an Experts Meeting on Safeguarding Endangered Languages in which the loss of the world’s linguistic diversity was considered by an assembled group of delegates representing the minority and minoritized ethnolinguistic groups, governments, and nongovernmental organizations. Prior to that meeting, an “ad hoc expert group” prepared a proposal (Brenzinger, Yamamoto et al. 2003) for the evaluation and measurement of the level of endangerment of the world’s languages. Nine factors are proposed:
1. Intergenerational language transmission; 2. Absolute numbers of speakers;
3. Proportion of speakers within the total population; 4. Loss of existing language domains;
5. Response to new domains and media; 6. Materials for language education and literacy;
7. Governmental and institutional language attitudes and policies; 8. Community members’ attitudes towards their own language; and 9. Amount and quality of documentation.
The proposal suggests that for each language, a score should be assigned to each of the nine factors. The combined scores of the factors then provide a measure of the level of endangerment and a sense of the level of urgency for remedial and revitalization efforts to be undertaken. The ad hoc expert committee emphasizes that no single factor should be considered in isolation since a language that seems relatively secure in terms of one factor may require “immediate and urgent attention due to other factors” (Brenzinger, Yamamoto et al. 2003:10). A more detailed description of the scoring mechanism is given below.
The goal of this paper is to test the proposed framework by applying it to a small but broad sample of the world’s languages. This test of the proposed assessment metric has the following general objectives:
1. To identify the ways in which the proposal is not well-founded theoretically or in which the levels proposed are not adequately formulated;
2. To identify the factors that have been proposed that are well-founded but for which there has been little data gathered by those studying the languages of the world; and
3. To identify the factors for which data may have been gathered but has not been published or is not easily accessible or interpretable.
The goal is to improve the framework, make it more practical, and promote its broader use.
Methodology
Languages Selected
intended to be a definitive categorization of the level of endangerment of any of the selected languages since such an endeavor would require a much deeper and more detailed analysis in each case. This study is intended to help identify the difficulties in determining such a categorization, however, deriving either from the lack of information about the languages being considered, from the way in which that information is archived and disseminated, or from the nature of the proposed framework itself.
The Ethnologue (Grimes 2000) was used as the primary source of an overall inventory of the languages of the world. The languages were selected with the following desiderata in mind:
1. Large, international languages (e.g., English, Chinese, Japanese, Spanish, French, German, Russian, etc.) were excluded.
2. The Ethnologue divides the world into five regions: Africa, Americas, Asia, Europe, and the Pacific. A target selection of twenty languages from each region was sought in an attempt to provide breadth to the sample being considered. The actual final selection consists of twenty-one languages from Africa, twenty from the Americas, twenty-one from Asia, nineteen from Europe, and nineteen from the Pacific.
3. Countries within those regions were selected on the basis of their known (or estimated) level of linguistic diversity. Thus countries which have large numbers of languages (e.g., Brazil, Cameroon, India, Indonesia, Nigeria, Papua New Guinea) were given some priority in the selection process. 4. No consideration was given to the current status of endangerment of the
languages being selected. Although the Ethnologue does provide a categorization of the languages it lists as either Living, Nearly Extinct, or Extinct, that categorization was not considered in the selection process. The selection process resulted in the inclusion of one language that the Ethnologue
categorizes as Extinct, (Mesmes of Ethiopia), six languages categorized as Nearly Extinct, (three from the Americas, three from the Pacific) and ninety-three languages categorized as Living.
5. Languages were chosen that were likely to be minority languages within the regions or countries where they are spoken. For the most part, this was based on the population figure provided by the Ethnologue and takes into account the differences in area norms for language size as described by J. Grimes (1986). The languages selected represent thirty-eight “hub countries.” A hub country is the home country associated with a language in the Ethnologue.Several of the languages chosen are spoken in more than one country. Wherever possible, data on the language has been collected for each of the countries in which there are speakers. In each of these cases the analysis takes into account that the situation of the language in terms of endangerment may differ from country to country. The analysis, then, covers a total of sixty-four countries where the selected languages are spoken.
The sample that resulted is decidedly not a random one in the statistical sense, though some randomization techniques were employed. (A country in a given region was selected, I counted down to the fifth language in the list of languages for that country and examined the figures for total population, number of speakers, etc. If those met the criteria listed above, I selected the language for the sample; counted down another five languages and repeated the process. If the language did not meet the criteria, I counted down another five languages in the list, and repeated the inspection process and so on.)
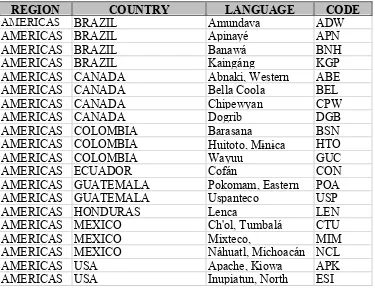
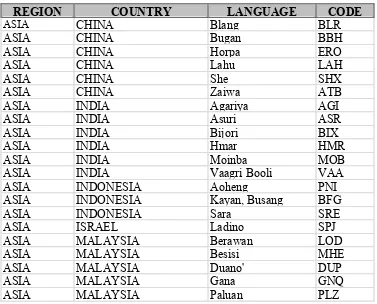
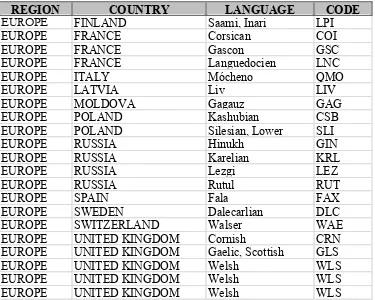
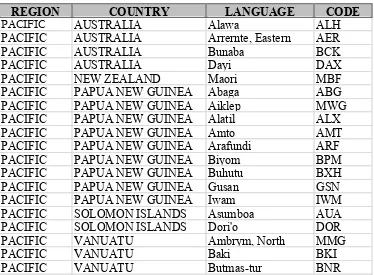
Tables 1 through 5 show the lists of languages for each of the Ethnologue regions sorted by the hub country associated with that language by the Ethnologue.
Other Characteristics of the Sample
Since the sample was selected somewhat randomly, there was no conscious plan to attempt to deal with closely related languages or languages that might be considered to be constituents of a macro-language. The Ethnologue definitions and decisions regarding differentiation between languages were taken as a basis for the analysis, and varieties identified by a distinct Ethnologue language code were taken to be distinct languages.
Table 1 – Languages Selected from Africa Region
REGION COUNTRY LANGUAGE CODE
AFRICA ALGERIA Temacine Tamazight TJO
AFRICA BENIN Anii BLO
AFRICA BENIN Biali BEH
AFRICA BOTSWANA /Anda HNH
AFRICA BOTSWANA /Gwi GWJ
AFRICA BURKINA FASO Bolon BOF
AFRICA CAMEROON Abar MIJ
AFRICA CAMEROON Akum AKU
AFRICA CAMEROON Awing AZO
AFRICA CAMEROON Bafaw-balong BWT
AFRICA CHAD Besme BES
AFRICA CHAD Dazaga DAK
AFRICA ETHIOPIA Aari AIZ
AFRICA ETHIOPIA Mesmes MYS
AFRICA ETHIOPIA Seze SZE
AFRICA MADAGASCAR Malagasy, XMV
AFRICA NIGERIA Abon ABO
AFRICA NIGERIA Bada BAU
AFRICA NIGERIA Ikulu IKU
AFRICA NIGERIA Jorto JRT
Table 2 – Languages Selected from Americas Region
REGION COUNTRY LANGUAGE CODE
AMERICAS BRAZIL Amundava ADW
AMERICAS BRAZIL Apinayé APN
AMERICAS BRAZIL Banawá BNH
AMERICAS BRAZIL Kaingáng KGP
AMERICAS CANADA Abnaki, Western ABE
AMERICAS CANADA Bella Coola BEL
AMERICAS CANADA Chipewyan CPW
AMERICAS CANADA Dogrib DGB
AMERICAS COLOMBIA Barasana BSN
AMERICAS COLOMBIA Huitoto, Mˆnˆca HTO
AMERICAS COLOMBIA Wayuu GUC
AMERICAS ECUADOR Cofán CON
AMERICAS GUATEMALA Pokomam, Eastern POA
AMERICAS GUATEMALA Uspanteco USP
AMERICAS HONDURAS Lenca LEN
AMERICAS MEXICO Ch'ol, Tumbalá CTU
AMERICAS MEXICO Mixteco, MIM
AMERICAS MEXICO Náhuatl, Michoacán NCL
AMERICAS USA Apache, Kiowa APK
Table 3 – Languages Selected from Asia Region
REGION COUNTRY LANGUAGE CODE
ASIA CHINA Blang BLR
ASIA CHINA Bugan BBH
ASIA CHINA Horpa ERO
ASIA CHINA Lahu LAH
ASIA CHINA She SHX
ASIA CHINA Zaiwa ATB
ASIA INDIA Agariya AGI
ASIA INDIA Asuri ASR
ASIA INDIA Bijori BIX
ASIA INDIA Hmar HMR
ASIA INDIA Moinba MOB
ASIA INDIA Vaagri Booli VAA
ASIA INDONESIA Aoheng PNI
ASIA INDONESIA Kayan, Busang BFG
ASIA INDONESIA Sara SRE
ASIA ISRAEL Ladino SPJ
ASIA MALAYSIA Berawan LOD
ASIA MALAYSIA Besisi MHE
ASIA MALAYSIA Duano' DUP
ASIA MALAYSIA Gana GNQ
Table 4 – Languages Selected from Europe Region
REGION COUNTRY LANGUAGE CODE
EUROPE FINLAND Saami, Inari LPI
EUROPE FRANCE Corsican COI
EUROPE FRANCE Gascon GSC
EUROPE FRANCE Languedocien LNC
EUROPE ITALY Mócheno QMO
EUROPE LATVIA Liv LIV
EUROPE MOLDOVA Gagauz GAG
EUROPE POLAND Kashubian CSB
EUROPE POLAND Silesian, Lower SLI
EUROPE RUSSIA Hinukh GIN
EUROPE RUSSIA Karelian KRL
EUROPE RUSSIA Lezgi LEZ
EUROPE RUSSIA Rutul RUT
EUROPE SPAIN Fala FAX
EUROPE SWEDEN Dalecarlian DLC
EUROPE SWITZERLAND Walser WAE
EUROPE UNITED KINGDOM Cornish CRN
EUROPE UNITED KINGDOM Gaelic, Scottish GLS
EUROPE UNITED KINGDOM Welsh WLS
EUROPE UNITED KINGDOM Welsh WLS
Table 5 – Languages Selected from the Pacific Region
REGION COUNTRY LANGUAGE CODE
PACIFIC AUSTRALIA Alawa ALH
PACIFIC AUSTRALIA Arrernte, Eastern AER
PACIFIC AUSTRALIA Bunaba BCK
PACIFIC AUSTRALIA Dayi DAX
PACIFIC NEW ZEALAND Maori MBF
PACIFIC PAPUA NEW GUINEA Abaga ABG
PACIFIC PAPUA NEW GUINEA Aiklep MWG
PACIFIC PAPUA NEW GUINEA Alatil ALX
PACIFIC PAPUA NEW GUINEA Amto AMT
PACIFIC PAPUA NEW GUINEA Arafundi ARF
PACIFIC PAPUA NEW GUINEA Biyom BPM
PACIFIC PAPUA NEW GUINEA Buhutu BXH
PACIFIC PAPUA NEW GUINEA Gusan GSN
PACIFIC PAPUA NEW GUINEA Iwam IWM
PACIFIC SOLOMON ISLANDS Asumboa AUA
PACIFIC SOLOMON ISLANDS Dori'o DOR
PACIFIC VANUATU Ambrym, North MMG
PACIFIC VANUATU Baki BKI
PACIFIC VANUATU Butmas-tur BNR
Nevertheless, in several cases, languages that were chosen, using criteria from other sources, might be categorized as closely related variants of a larger macro-language or of a language chain.
One example of this is the relatively close relationship between Karelian and Livonian. Similarly, Gascon and Languedocien are sometimes considered to be varieties within the larger Langue d’Oc complex. I have made no attempt to treat these larger language complexes as single units in this analysis.
In cases where the language chosen is but one member of such a complex but no other members of the complex have been included in the sample, I have made no attempt to consider data about the larger complex or other constituents of it. Thus, Scottish Gaelic is considered here in isolation from other Gaelic varieties, Ladino is considered without reference to other Romance varieties (e.g. Gascon, Fala), and Walser and Lower Silesian are considered independently of each other and of other Germanic languages with which they are closely related.
The Evaluation Framework
Population Number. The evaluation framework is described and justified in (Brenzinger, Yamamoto et al. 2003). I provide only summary descriptions here in tables 6–13.
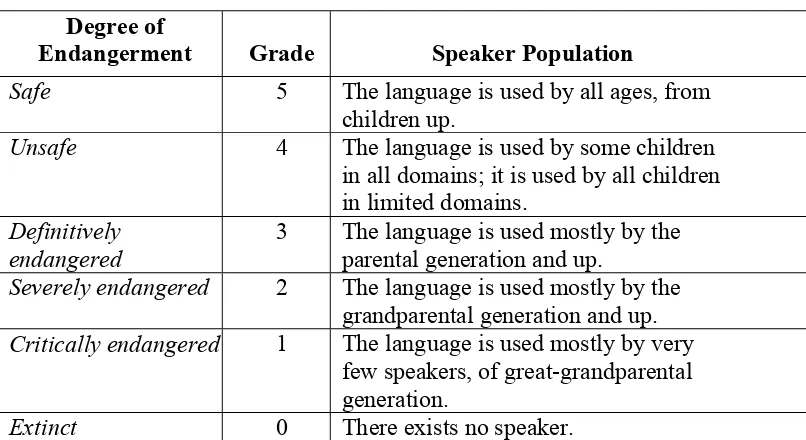
Table 6 – Factor 1: Intergenerational Language Transmission Scale (Brenzinger, Yamamoto et al. 2003:11)
Degree of
Endangerment Grade Speaker Population
Safe 5 The language is used by all ages, from
children up.
Unsafe 4 The language is used by some children in all domains; it is used by all children in limited domains.
Definitively endangered
3 The language is used mostly by the
parental generation and up.
Severely endangered 2 The language is used mostly by the grandparental generation and up.
Critically endangered 1 The language is used mostly by very few speakers, of great-grandparental generation.
Extinct 0 There exists no speaker.
The UNESCO Experts group clearly states that absolute population numbers alone are not enough to provide any clear indication of the relative endangerment of a language. Yet, ceteris paribus, a smaller group is likely to be under greater pressure than a larger group.
Population figures are often difficult to obtain since sources frequently differ in the criteria they use in collecting the data. Government census data may provide numbers for those who comprise the ethnic group but may not necessarily represent accurately the number of speakers of the language. Different kinds of population data may be available from different time periods making comparisons and analysis difficult. In addition, whether speakers (and which speakers) use the language as their first or second language (and at what levels of proficiency) may also be significant factors in evaluating the language endangerment situation.
With these complicating factors in mind, it would seem desirable that a more robust system for evaluating the significance of population numbers should be developed. Such a system would, wherever possible, take into account the following factors:
These, taken together and in combination with Factor 3 (Proportion of Speakers within the Total Population), should provide a method to evaluate the population statistics in terms of a scale of endangerment as with the other factors proposed by the UNESCO experts. I have not attempted to formulate such a method here but simply report the “first language speaker population” figure provided by the Ethnologue.
Table 7 – Factor 3: Proportion of Speakers Within the Total Reference Group (Brenzinger, Yamamoto et al. 2003)
Degree of Endangerment Grade
Proportion of Speakers Within the Total Reference Population
Safe 5 All speak the language.
Unsafe 4 Nearly all speak the language.
Definitively endangered
3 A majority speak the language.
Severely endangered 2 A minority speak the language.
Critically endangered 1 Very few speak the language.
Extinct 0 None speak the language.
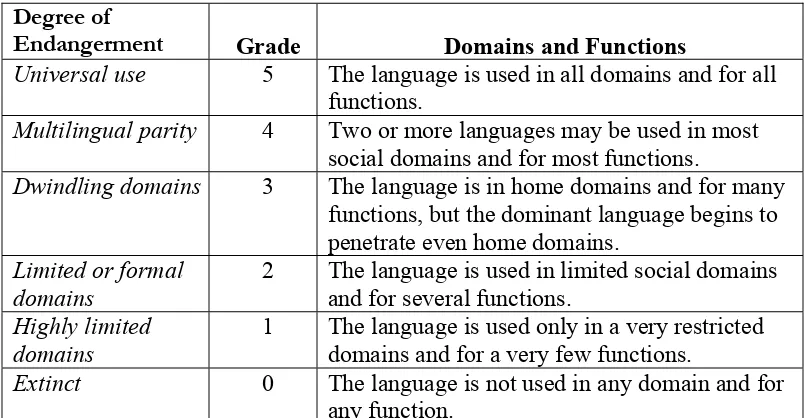
Table 8 – Factor 4: Loss of Existing Language Domains (Brenzinger, Yamamoto et al. 2003)
Degree of
Endangerment Grade Domains and Functions
Universal use 5 The language is used in all domains and for all functions.
Multilingual parity 4 Two or more languages may be used in most social domains and for most functions.
Dwindling domains 3 The language is in home domains and for many functions, but the dominant language begins to penetrate even home domains.
Limited or formal domains
2 The language is used in limited social domains
and for several functions.
Highly limited domains
1 The language is used only in a very restricted
domains and for a very few functions.
Table 9 – Factor 5: Response to New Domains and Media (Brenzinger, Yamamoto et al. 2003)
Degree of
Endangerment Grade
New Domains and Media Accepted by the Endangered Language Dynamic 5 The language is used in all new
domains.
Robust/active 4 The language is used in most new domains.
Receptive 3 The language is used in many domains.
Coping 2 The language is used in some new domains.
Minimal 1 The language is used only in a few new domains.
Inactive 0 The language is not used in any new domains.
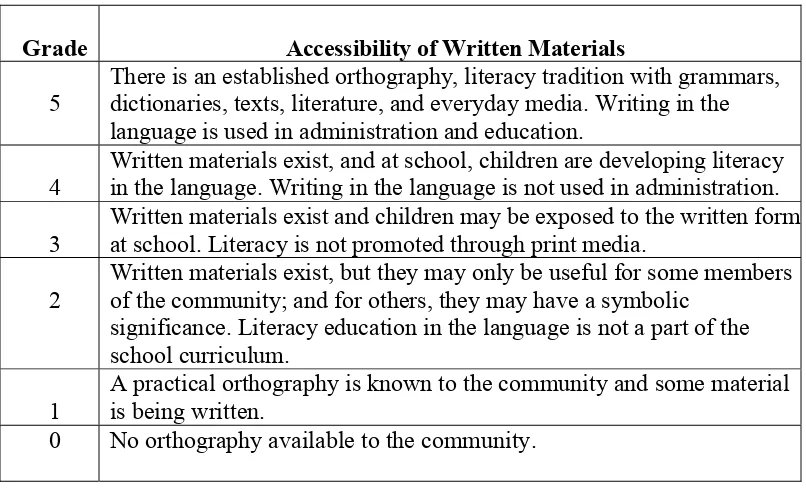
Table 10 – Factor 6: Materials for Language Education and Literacy (Brenzinger, Yamamoto et al. 2003)
Grade Accessibility of Written Materials
5
There is an established orthography, literacy tradition with grammars, dictionaries, texts, literature, and everyday media. Writing in the language is used in administration and education.
4
Written materials exist, and at school, children are developing literacy in the language. Writing in the language is not used in administration.
3
Written materials exist and children may be exposed to the written form at school. Literacy is not promoted through print media.
2
Written materials exist, but they may only be useful for some members of the community; and for others, they may have a symbolic
significance. Literacy education in the language is not a part of the school curriculum.
1
A practical orthography is known to the community and some material is being written.
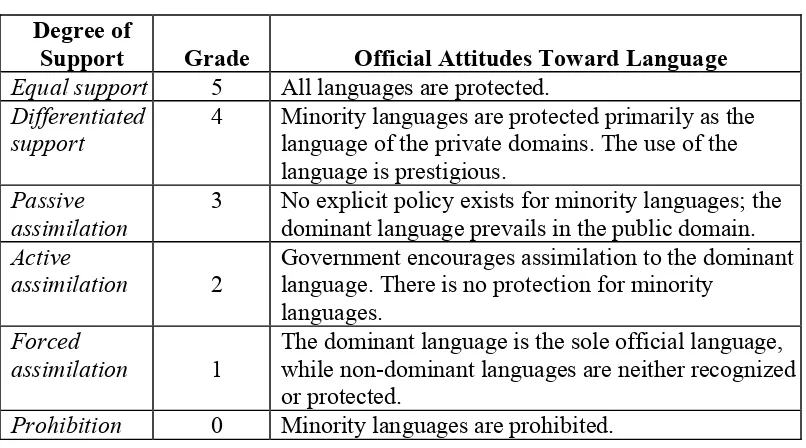
Table 11 – Factor 7: Governmental and Institutional Language Attitudes and Policies (Brenzinger, Yamamoto et al. 2003)
Degree of
Support Grade Official Attitudes Toward Language Equal support 5 All languages are protected.
Differentiated support
4 Minority languages are protected primarily as the
language of the private domains. The use of the language is prestigious.
Passive assimilation
3 No explicit policy exists for minority languages; the
dominant language prevails in the public domain.
Active
assimilation 2
Government encourages assimilation to the dominant language. There is no protection for minority
languages.
Forced
assimilation 1
The dominant language is the sole official language, while non-dominant languages are neither recognized or protected.
Prohibition 0 Minority languages are prohibited.
Table 12 – Factor 8: Community Members’ Attitudes toward Their Own Language (Brenzinger, Yamamoto et al. 2003)
Grade Community Members’ Attitudes toward Language
5 All members value their language and wish to see it promoted.
4 Most members support language maintenance.
3 Many members support language maintenance; others are
indifferent or may even support language loss.
2 Some members support language maintenance; others are
indifferent or may even support language loss.
1 Only a few members support language maintenance; others are
indifferent or may even support language loss.
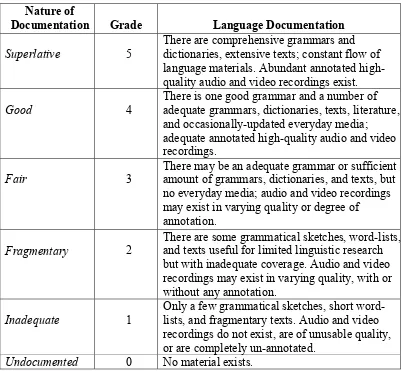
Table 13 – Factor 9: Amount and Quality of Documentation
Nature of
Documentation Grade Language Documentation
Superlative 5
There are comprehensive grammars and dictionaries, extensive texts; constant flow of language materials. Abundant annotated high-quality audio and video recordings exist.
Good 4
There is one good grammar and a number of adequate grammars, dictionaries, texts, literature, and occasionally-updated everyday media; adequate annotated high-quality audio and video recordings.
Fair 3
There may be an adequate grammar or sufficient amount of grammars, dictionaries, and texts, but no everyday media; audio and video recordings may exist in varying quality or degree of annotation.
Fragmentary 2
There are some grammatical sketches, word-lists, and texts useful for limited linguistic research but with inadequate coverage. Audio and video recordings may exist in varying quality, with or without any annotation.
Inadequate 1
Only a few grammatical sketches, short word-lists, and fragmentary texts. Audio and video recordings do not exist, are of unusable quality, or are completely un-annotated.
Undocumented 0 No material exists.
Data Sources
The initial source of data, as described above, was the Ethnologue, fourteenth edition (Grimes 2000) which provided the basic inventory of languages for each region and each country. Summary information about each language was obtained from the
Ethnologue database including data on population, countries in which the language is spoken, linguistic affiliation, and, less consistently, data on domains of use, bilingualism, literacy, and functions assigned to the language within a country (e.g. official language, national language, etc.).
The SIL Bibliography (www.ethnologue.com)
Rosetta Project (www.rosettaproject.org)
OCLC FirstSearch (newfirstsearch.oclc.org) which provided access to the ERIC and Article First databases.
The UNESCO Redbook of Endangered Languages (
www.tooyoo.l.u-tokyo.ac.jp/Redbook/index.html)
House of the Small Languages (www.houseofthesmalllangauges.org)
In a large number of cases, the Google© search engine was also used; however, most of
those searches resulted in hits on one or more of the databases listed above. Occasionally, links were found to other websites containing significant references to the languages being investigated.
While every attempt was made to be thorough, it was impossible and impractical for the purposes of this paper to be exhaustive in the search for language-specific descriptions, documentation, and policy information. One clear observation emerging from this research process is the high level of circularity in the sources with many sources citing each other and most reformatting and re-issuing the Ethnologue or UNESCO Redbook data, often without attribution. The evaluation of language documentation is meant only to be suggestive rather than definitive. It is assumed that for each case those closer to the situation would be more aware of, and know how to access and consult, the existing documentation. Much of that documentation may not be indexed or publicized in any of the searchable electronic databases.
A Categorization of the Level of Endangerment of the Languages Selected
Tables 14 – 18 show the summary results of the application of the proposed evaluation framework to the data that I was able to collect for each of the 100 languages in the sample.
Scoring Considerations
For each of the five major regions of the world, the tables list the languages in alphabetical order with the evaluation scores for each factor by language. The tables show the data only for the “hub country” of the language. By separating the data for each language in each country where there are speakers, it is possible to create a separate profile of endangerment for situations where the environment differs because of differences in group size, language use patterns, and government language policies. A language that may be more highly threatened in one country may be less so in another location. While there is some data on the languages in other countries where there are speakers, that search was largely unproductive. I provide some summary statistics below.
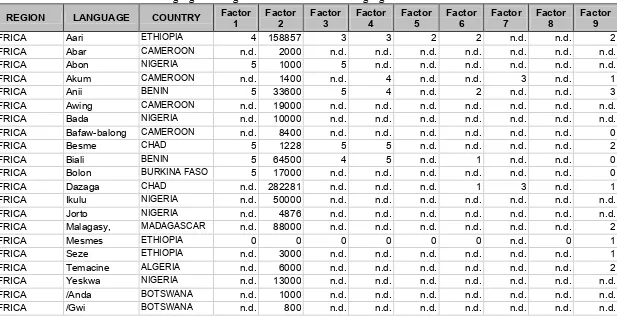
Table 14 – Language Endangerment Evaluation for Languages of Africa
REGION LANGUAGE COUNTRY Factor
1
Factor 2
Factor 3
Factor 4
Factor 5
Factor 6
Factor 7
Factor 8
Factor 9
AFRICA Aari ETHIOPIA 4 158857 3 3 2 2 n.d. n.d. 2
AFRICA Abar CAMEROON n.d. 2000 n.d. n.d. n.d. n.d. n.d. n.d. n.d.
AFRICA Abon NIGERIA 5 1000 5 n.d. n.d. n.d. n.d. n.d. n.d.
AFRICA Akum CAMEROON n.d. 1400 n.d. 4 n.d. n.d. 3 n.d. 1
AFRICA Anii BENIN 5 33600 5 4 n.d. 2 n.d. n.d. 3
AFRICA Awing CAMEROON n.d. 19000 n.d. n.d. n.d. n.d. n.d. n.d. n.d.
AFRICA Bada NIGERIA n.d. 10000 n.d. n.d. n.d. n.d. n.d. n.d. n.d.
AFRICA Bafaw-balong CAMEROON n.d. 8400 n.d. n.d. n.d. n.d. n.d. n.d. 0
AFRICA Besme CHAD 5 1228 5 5 n.d. n.d. n.d. n.d. 2
AFRICA Biali BENIN 5 64500 4 5 n.d. 1 n.d. n.d. 0
AFRICA Bolon BURKINA FASO 5 17000 n.d. n.d. n.d. n.d. n.d. n.d. 0
AFRICA Dazaga CHAD n.d. 282281 n.d. n.d. n.d. 1 3 n.d. 1
AFRICA Ikulu NIGERIA n.d. 50000 n.d. n.d. n.d. n.d. n.d. n.d. n.d.
AFRICA Jorto NIGERIA n.d. 4876 n.d. n.d. n.d. n.d. n.d. n.d. n.d.
AFRICA Malagasy, MADAGASCAR n.d. 88000 n.d. n.d. n.d. n.d. n.d. n.d. 2
AFRICA Mesmes ETHIOPIA 0 0 0 0 0 0 n.d. 0 1
AFRICA Seze ETHIOPIA n.d. 3000 n.d. n.d. n.d. n.d. n.d. n.d. 1
AFRICA Temacine ALGERIA n.d. 6000 n.d. n.d. n.d. n.d. n.d. n.d. 2
AFRICA Yeskwa NIGERIA n.d. 13000 n.d. n.d. n.d. n.d. n.d. n.d. n.d.
AFRICA /Anda BOTSWANA n.d. 1000 n.d. n.d. n.d. n.d. n.d. n.d. n.d.
Table 15 – Language Endangerment Evaluation for Languages of the Americas
REGION LANGUAGE COUNTRY Factor
1
Factor 2
Factor 3
Factor 4
Factor 5
Factor 6
Factor 7
Factor 8
Factor 9
AMERICAS Abnaki, Western CANADA 1 20 1 1 0 2 3 1 3
AMERICAS Amundava BRAZIL n.d. 50 n.d. n.d. n.d. n.d. 4 n.d. n.d.
AMERICAS Apache, Kiowa USA 1 18 1 0 0 n.d. 2 n.d. 3
AMERICAS Apinayé BRAZIL n.d. 800 4 5 n.d. 4 4 n.d. 3
AMERICAS Banawá BRAZIL n.d. 100 n.d. n.d. n.d. n.d. n.d. 4 1
AMERICAS Barasana COLOMBIA n.d. 350 n.d. n.d. n.d. 1 4 n.d. 3
AMERICAS Bella Coola CANADA 2 20 1 2 n.d. 1 2 n.d. 3
AMERICAS Chipewyan CANADA 3 4000 3 n.d. n.d. 2 3 n.d. 3
AMERICAS Ch'ol, Tumbalá MEXICO n.d. 90000 n.d. n.d. n.d. n.d. 3 n.d. 3
AMERICAS Cofán ECUADOR 5 800 5 5 n.d. 4 4 4 4
AMERICAS Dogrib CANADA 5 2110 3 5 n.d. 3 3 3 4
AMERICAS Huitoto, COLOMBIA n.d. 1700 n.d. n.d. n.d. n.d. n.d. n.d. 3
AMERICAS Inupiatun, N. AK USA 3 n.d. n.d. n.d. n.d. 2 3 n.d. 4
AMERICAS Kaingáng BRAZIL n.d. 18000 n.d. n.d. n.d. n.d. n.d. n.d. 3
AMERICAS Lenca HONDURAS n.d. 0 n.d. n.d. n.d. n.d. 3 n.d. 1
AMERICAS Mixteco, Alaca. MEXICO 4 25000 4 5 n.d. 2 3 4 3
AMERICAS Náhuatl, MEXICO n.d. 3000 n.d. n.d. n.d. n.d. 3 n.d. 2
AMERICAS Pokomam, GUATEMALA 3 12500 2 2 n.d. 3 3 2 3
AMERICAS Uspanteco GUATEMALA 5 3000 4 4 n.d. 3 4 n.d. 3
Table 16 – Language Endangerment Evaluation for Languages of Asia
REGION LANGUAGE COUNTRY Factor
1
Factor 2
Factor 3
Factor 4
Factor 5
Factor 6
Factor 7
Factor 8
Factor 9
ASIA Agariya INDIA n.d. 55757 n.d. n.d. 2 n.d. 4 n.d. 0
ASIA Aoheng INDONESIA n.d. 2630 n.d. n.d. n.d. n.d. n.d. n.d. n.d.
ASIA Asuri INDIA n.d. 16596 n.d. n.d. n.d. n.d. 4 n.d. 1
ASIA Berawan MALAYSIA n.d. 870 n.d. n.d. n.d. n.d. n.d. n.d. 1
ASIA Besisi MALAYSIA 5 1356 5 5 n.d. n.d. n.d. n.d. 1
ASIA Bijori INDIA n.d. 2391 n.d. n.d. n.d. n.d. 4 n.d. 0
ASIA Blang CHINA 5 24000 5 5 n.d. 2 4 4 3
ASIA Bugan CHINA n.d. 3000 n.d. n.d. n.d. n.d. n.d. n.d. 1
ASIA Duano MALAYSIA n.d. 1922 4 n.d. n.d. n.d. n.d. n.d. n.d.
ASIA Gana MALAYSIA 1 2000 n.d. 1 n.d. n.d. n.d. n.d. n.d.
ASIA Hmar INDIA n.d. 50000 n.d. n.d. n.d. 3 4 n.d. 1
ASIA Horpa CHINA 4 38000 3 5 n.d. n.d. 4 2 2
ASIA Kayan, Busang INDONESIA n.d. 3000 n.d. n.d. n.d. n.d. n.d. n.d. 0
ASIA Ladino ISRAEL 3 100000 3 2 n.d. 3 n.d. n.d. 3
ASIA Lahu CHINA 5 411476 4 5 n.d. 3 4 4 3
ASIA Moinba CHINA 5 36000 4 5 n.d. n.d. 4 n.d. 2
ASIA Paluan MALAYSIA n.d. 5000 n.d. n.d. n.d. n.d. n.d. n.d. n.d.
ASIA Sara INDONESIA n.d. 200 n.d. n.d. n.d. n.d. n.d. n.d. n.d.
ASIA She CHINA 3 911 2 3 n.d. 0 4 2 2
ASIA Vaagri Booli INDIA n.d. 10000 n.d. n.d. n.d. n.d. 4 n.d. n.d.
Table 17 – Language Endangerment Evaluation for Languages of Europe
REGION LANGUAGE COUNTRY Factor
1
Factor 2
Factor 3
Factor 4
Factor 5
Factor 6
Factor 7
Factor 8
Factor 9
EUROPE Cornish GREAT BRITAIN 2 0 1 1 1 2 3 2 3
EUROPE Corsican FRANCE 5 281000 n.d. 4 n.d. n.d. 4 3 4
EUROPE Dalecarlian SWEDEN n.d. 1500 4 n.d. n.d. n.d. 3 n.d. 1
EUROPE Fala SPAIN 5 10500 4 4 n.d. 2 3 3 1
EUROPE Gaelic, GREAT BRITAIN 2 88892 3 3 1 5 3 3 4
EUROPE Gagauz MOLDOVA 5 173000 4 4 n.d. n.d. 2 4 1
EUROPE Gascon FRANCE 3 250000 3 2 0 2 3 3 4
EUROPE Hinukh RUSSIA 4 200 3 1 n.d. 0 n.d. 3 3
EUROPE Karelian RUSSIA 3 35000 2 2 n.d. n.d. n.d. n.d. 2
EUROPE Kashubian POLAND 2 2000 2 2 n.d. n.d. 3 n.d. n.d.
EUROPE Languedocien FRANCE 5 5000 2 2 n.d. 2 2 2 4
EUROPE Lezgi RUSSIA n.d. 257000 n.d. n.d. n.d. n.d. n.d. n.d. 1
EUROPE Liv LATVIA 2 35 1 1 n.d. n.d. n.d. n.d. 3
EUROPE Mócheno ITALY n.d. 1900 n.d. n.d. n.d. n.d. n.d. n.d. n.d.
EUROPE Rutul RUSSIA 3 20000 5 1 n.d. 0 n.d. 3 2
EUROPE Saami, Inari FINLAND 3 250 2 2 n.d. 1 n.d. n.d. 2
EUROPE Silesian, Lower POLAND 3 n.d. n.d. n.d. n.d. 1 n.d. n.d. 1
EUROPE Welsh GREAT BRITAIN 4 508098 2 2 n.d. 4 4 3 4
Table 18 – Language Endangerment Evaluation for Languages of the Pacific
REGION LANGUAGE COUNTRY Factor
1
Factor 2
Factor 3
Factor 4
Factor 5
Factor 6
Factor 7
Factor 8
Factor 9
PACIFIC Abaga P. N. G. 1 5 1 1 n.d. n.d. 4 n.d. 0
PACIFIC Aiklep P. N. G. n.d. 3697 n.d. n.d. n.d. n.d. 4 n.d. n.d.
PACIFIC Alatil P. N. G. n.d. 125 n.d. n.d. n.d. n.d. 4 n.d. 1
PACIFIC Alawa AUSTRALIA 1 20 2 1 0 0 2 n.d. 2
PACIFIC Ambrym, North VANUATU n.d. 2850 n.d. n.d. n.d. n.d. n.d. n.d. 1
PACIFIC Amto P. N. G 5 200 4 3 1 2 4 2 0
PACIFIC Arafundi P. N. G n.d. 733 n.d. n.d. n.d. n.d. 4 n.d. 1
PACIFIC Arrernte, AUSTRALIA 4 2000 3 3 1 4 3 3 4
PACIFIC Asumboa SOLOMON IS 5 20 5 4 n.d. n.d. n.d. n.d. 2
PACIFIC Baki VANUATU 4 200 3 4 n.d. 2 n.d. 4 0
PACIFIC Biyom P. N. G n.d. 380 n.d. n.d. n.d. n.d. n.d. n.d. 1
PACIFIC Buhutu P. N. G 5 1350 5 4 n.d. 4 4 4 3
PACIFIC Bunaba AUSTRALIA 1 100 1 1 0 1 2 1 2
PACIFIC Butmas-tur VANUATU n.d. 525 n.d. n.d. n.d. n.d. n.d. n.d. 1
PACIFIC Dayi AUSTRALIA 3 200 2 2 n.d. n.d. 4 n.d. 1
PACIFIC Dorio SOLOMON IS n.d. 2406 4 n.d. n.d. n.d. n.d. n.d. n.d.
PACIFIC Gusan P. N. G n.d. 794 n.d. n.d. n.d. n.d. 4 n.d. 1
PACIFIC Iwam P. N. G n.d. 3000 n.d. n.d. n.d. n.d. n.d. n.d. 1
Cells for which there was no data available or for which the data reported did not align well with the factors as framed by the UNESCO expert group are filled with the abbreviation “n.d.” (no data). This designation for Factor 9 (Amount and Quality of Documentation) may mean only that I was unable to locate any references to the languages in the sources I searched. There are a few cases where I selected “0” for this factor indicating that I had a fair degree of certainty that there was no significant amount of documentation readily available. In those cases, it may well be that those more familiar with the language, the language family, or the geographic region could readily identify sources for documentation that would raise the score of the language for this factor.
I made no attempt to evaluate the quality of the documentation that I was able to find references to. Primarily, I evaluated each language on the basis of the kinds of documents that I could locate. The existence of grammatical, phonological, and lexical (vocabularies, dictionaries, semantic studies) materials on the language caused me to give a higher score on this factor than if there were only wordlists or general studies that are more ethnographic in nature. I also considered whether there was literature in the language and what kinds of materials were being produced, if that literature was current, and if literature production was ongoing.
Summary Results
No claim is made here that the results of this application of the framework to the selected languages is an accurate and fair assessment of the level of endangerment of those languages. The data collected are far too sparse and incomplete and the application of the framework far too cursory. Nevertheless, there are some trends in the results that merit comment.
Missing Data
One of the first and very obvious observations about the summary tables is the large number of cells for which no data were available. This is as much a comment about the nature of the databases I consulted as it is about the UNESCO evaluation framework itself. To a certain extent, the proposed framework is asking some new questions and the existing data repositories don’t have the data, or have not organized their data in such a way that they can readily answer those questions. While some information was available for most of the language-in-country pairs in the sample, there were only a few for which information on all 9 of the factors was found.
to what governmental attitudes or policies are now or (perhaps more importantly) what they were in the past and how that has affected the decisions made by speakers of the languages.
By counting the number of cells in each table containing non-null values and dividing that by the total number of cells (nine factors multiplied by the number of languages), I was able to calculate a percentage of data actually collected for each region. Table 19 shows the results of that calculation.:
Table 19 – Percent Data Available by Region
REGION HUB COUNTRY ALL COUNTRIES
Africa 33% 35%
Americas 58% 35%
Asia 59% 37%
Europe 66% 50%
Pacific 66% 53%
Only in Africa does the inclusion of the non-hub countries provide a greater amount of data for analysis, although the general level of data available for the languages selected from Africa is the lowest of the five regions.
It should also be noted that the differential between the two percentages differs markedly from region to region. The generally higher level of data availability for the languages of Europe and the Pacific is accompanied by a smaller differential between the hub-country-only analysis and the analysis including all of the countries where speakers were identified as being present (16 percentage points for Europe and 13 percentage points for the Pacific). This contrasts with the higher differentials in the Americas (23 percentage points) and Asia (22 percentage points). The inference to be drawn from these numbers is that the level of documentation in Europe and the Pacific is generally higher (more is known and reported) than in the Americas and Asia though in all of the regions (except Africa) much more is known (and reported) about the hub countries than about the others.
Another noticeable trend in the data is that there is more documentation for larger and (by definition, no doubt) better-known languages than for the smaller and less well-known languages. Thus, for example, Cornish, Maori, Welsh, and Scottish Gaelic (all languages of Europe) are far more thoroughly described and documented (at least in their hub countries) than Besme, Dayi, or Gana..
Another factor where there is largely no data available is Factor 5, Response to New Domains and Media. There are some cases where inferences could be made on the basis of a comment or observation in the descriptive material, the databases giving information about the state of the world’s languages are not tracking how language communities are responding to the introduction of new forms of media and new language functions in their societies. Thus, while this factor may well be an important one for the evaluation of language endangerment, up to this point there has been little systematic collection of data that can help us make that evaluation.
Data Fit
I have already mentioned how the questions being asked by the UNESCO framework are, in some ways, new ones. Factor 5, as described above, asks for a particular kind of data that, for the most part, has not been collected or, at least, has not been reported in such a way as to answer directly the question being asked.
There are other ways in which the questions being asked by the UNESCO framework do not directly fit the data as currently organized. In this section, I will briefly examine each factor in terms of the ‘fit’ of the data to the question being asked.
Factor 1 – Intergenerational Language Transmission
There are fairly frequent comments regarding the users of the languages in the sources I consulted. However, these do not align themselves very well with the levels of intergenerational transmission proposed by the UNESCO framework. The most frequent annotation in the Ethnologue, for example, for Ages of Speakers is “All Ages”. Only in one case, did I find a more detailed analysis which gave the actual number of speakers in various age cohorts.
A more significant difficulty, however, is the mixture within this factor of two kinds of information that need to be taken together in order to provide an answer to the question being asked. One kind of information deals with the ages of the speakers. Is the language being used by children? The other kind of information deals with the domains of use of the language. This component isn’t clearly stated at each scoring level of the scale. (Are children speaking the language? Are some children speaking it in some domains?). The analyst needs to consult not only the data on the speakers but also the (much scarcer) data on domains of use in order to be able to answer this question adequately.
Factor 2 – Absolute Number of Speakers
Some of the issues related to this factor have already been discussed. Comparable population numbers are hard to find and interpret. In spite of that fact, the population number is the single statistic, flawed as it may be, that was almost universally available. The inclusion of a single factor which presents, without interpretation, a raw number among eight others which provide an evaluative scale, seems a bit anomalous, and not very helpful.
Factor 3 – Proportion of Speakers Within the Population
In a number of cases, the answer to this question was either directly indicated in the data sources or could be inferred from a combination of data or comments provided. Given a reasonably reliable total population number and a similarly reliable estimate of speakers, the proportion asked for is easily calculable.
What is more difficult is determining exactly what is meant by a ‘speaker’. Ethnologue, for example, tracks for many languages the L1 Speaker population, the number of monolingual speakers, and in some cases the number of speakers who use the language as a second language. The proposed framework doesn’t differentiate between these various kinds of speakers. At the very least, the proposal should give instructions to the analyst as to how a ‘speaker’ is defined for the purposes of this evaluation.
Factor 4 – Loss of Existing Language Domains
This factor represents a case where the perspective of the framework doesn’t coincide well with the perspectives of the data sources. Both are concerned about documenting the situation of the languages in terms of their use, but the data sources take a more synchronic perspective describing what domains the languages are (or were, at the time of the observation) being used in. The framework takes a more diachronic perspective asking about what domains the languages are no longer being used in. This difference makes it difficult, at times, to determine an adequate answer to the question based on the data available. Certainly the synchronic descriptions are indicative of language endangerment if the core domains (home, friends, neighborhood) are no longer associated with the language in question, but the fact that languages are assigned different functions does not necessarily indicate that language shift is underway. The UNESCO experts are clearly aware of this and explicitly provide for it in the choices they provide for this factor, but the overall difference in perspective remains.
Factor 5 – Response to New Domains and Media
This factor has already been discussed in regards to the nearly universal lack of data. Only in a few cases was I able to make an estimate as to the level of acceptance of new domains and media based on some fairly indirect comments in the data sources.
The description of this factor by the UNESCO experts group indicates their full awareness of the difficulties associated with the assessment of the level of response to new domains and media. They provide some helpful but rather general guidelines. For each language situation, the evaluators will need to specify a clear set of criteria for making this assessment.
Factor 6 – Materials for Language Education and Literacy
Some of the data sources provide data on the use of the language as a medium of instruction, on the existence of elementary education programs (bilingual or otherwise) which use the language, secondary level programs, the existence of pedagogical and literacy skills materials, etc.
orthographies have strong supporters in various factions of the community? What if the schools are the only source of language transmission in a community, as in various language revitalization projects where there are no living native speakers of the language and children are being re-introduced to a reconstructed form of their ancestors’ language?
Factor 7 – Governmental and Institutional Language Attitudes and Policies
This factor was also discussed above. None of the explicitly language-related data sources that I consulted had specific categories of information regarding government language and education policies, though there were numbers of bibliographic sources where policy is dealt with at length from a variety of perspectives. As mentioned above, more of this kind of documentation is available for the larger, better-known cases than for the smaller, lesser-known languages.
The categories provided by the framework are useful and helpful but may not be easily identifiable without a fairly thorough investigation into not only the current situation but also the history of language and education policy in each case. In addition, it may well be the case that language policy as specifically applied to a particular language may differ from the generally reported official policy.
Factor 8 – Community Members’ Attitudes Toward their Own Language
Overall the data sources do not provide a lot of specific data on language attitudes. In part this may be because attitudes are difficult to assess without considerable effort and in-depth observation. In addition, attitudes may not be uniformly held across a total population. Some segments of the population may feel quite positive towards their language while other segments may be indifferent or worse. Data repositories which attempt to give summary information will almost always either be lacking data entirely or provide a generalization which will be wrong as regards some essential detail.
In the data I collected, only for Europe were there adequate indications of attitudes in a preponderance of the cases.
As with several of the other factors, the framework would be well served if the wording of the categorizations could be cleaned up and refined. In this case, the confusion is between the number of community members (no one, a few, some, many, most, all) who express an attitude supporting language maintenance, and the others in each case who express several other attitudes (indifference, support of language loss). It would make it easier to answer the question if the responses were represented solely on the basis of a single component (support of language maintenance).
Factor 9 – Amount and Quality of Documentation
I have discussed the issues related to this factor above. The answer to this question in large measure depends on the availability of sufficient time and resources to do the research required. In most cases, but not always, those closest to the situation will be in the best position to access the best sources of information. However, the assessment of this factor depends not only on a thorough bibliographic search but also an assessment of the kinds and quality of the documentation that is found.
Conclusions and Recommendations
The goal of this study was to evaluate the UNESCO proposal for a framework for the evaluation of the level of endangerment of the world’s languages by examining a broad sample of 100 of the languages of the world. The specific objectives of the study were:
1. To identify the ways in which the proposal is not well-founded theoretically or in which the levels proposed are not adequately formulated;
2. To identify the factors that have been proposed that are well-founded but for which there has been little data gathered by those studying the languages of the world;
3. To identify the factors for which data may have been gathered but has not been published or is not easily accessible or interpretable.
Summary Conclusions
The framework itself
As to the first objective, it seems clear that the UNESCO framework is an admirable effort to bring together the ‘state of the art’ in terms of language endangerment and represents a reasonable and feasible approach to the issues with suggestions regarding appropriate responses. It provides not only a clear framework for assessment but also delineates a very useful research agenda for investigators of the world’s languages that is based on a sound theoretical orientation to language maintenance and shift.
If there is any criticism of the framework, it would be that the categorization levels need more definitional refinement, need to be more clearly worded, and need expanded guidelines to aid the analyst.
Lack of Data
The preceding analysis of the data collected shows that the state of our knowledge is inadequate, particularly in terms of answering the questions posed by the UNESCO framework. Some parts of the world and some factors have been more thoroughly investigated than others but none of these are at a level that provides any sort of a comprehensive view of the level of endangerment of the world’s languages.
If the framework is to succeed in providing such a comprehensive view, it will be necessary for the major language information databases to adjust both their research agendas and their presentation of the data to fit the framework.
Lack of Reporting
Recommendations
1. The UNESCO experts group should actively seek further feedback on the framework they have proposed with a view to refining it, clarifying the wording of the categorization levels, and further defining the ways in which the factors can be assessed and evaluated. Such a review would fit well as part of the upcoming A WORLD OF MANY VOICES. Interfaces in Language Documentation: Linguistics, Anthropology, Speech Communities, and Technology conference to be held at the University of Frankfurt / Main, 4th - 5th of September, 2004.
2. The major language information data repositories (e.g., Ethnologue, UNESCO Redbook of Endangered Languages, ICHEL, etc.) should work with UNESCO to begin to conform their data categorizations and presentations to the parameters of the proposed framework.
3. Investigators of languages should make every effort to make the results of their research known and accessible to the rest of the world. They should participate in such initiatives as the Open Language Archive Community (OLAC) and similar cooperative efforts. The use of a standard set of language identification codes (such as RFC 3066 or the proposed ISO 639-2) in cataloguing and indexing language information would greatly enhance the ability of researchers to find data quickly, efficiently and unambiguously. Clearly there is much to be done, not only in assessing the state of the world’s languages, but beyond that, to addressing the real and urgent needs that such an assessment identifies.
References
Brenzinger, Matthias, Akira Yamamoto, Noriko Aikawa, Dmitri Koundiouba, Anahit Minasyan, Arienne Dwyer, Colette Grinevald, Michael Krauss, Osahito Miyaoka, Osamu Sakiyama, Rieks Smeets and Ofelia Zepeda. 2003. Language vitality and endangerment. Paris: UNESCO Expert Meeting on Safeguarding Endangered Languages
Campbell, Lyle and Martha C. Muntzel. 1989. The structural consequences of language death. In Nancy C. Dorian (ed.), Investigating Obsolescence. Studies in language contraction and death, 181–196. Studies in the Social and Cultural Foundations of Language 7. Cambridge: Cambridge University Press.
Clyne, Michael. 1981. Language maintenance and language shift: some data from Australia, AILA 81 Proceedings I Sections and Workshops, Bengt Sigurd, Jan Svartvik, eds., 488–489. Lund, Sweden: AILA.
Denison, Norman. 1977. Language Death or Language Suicide? International Journal of the Sociology of Language 12:13–22.
Dimmendal, Gerrit J. 1989. On language death in eastern Africa. In Nancy C. Dorian (ed.), Investigating Obsolescence: studies in language contraction and death 13–31. Cambridge: Cambridge University Press.
Dorian, Nancy C. 1973. Grammatical change in a dying dialect. Language 49:413– 438.
Dorian, Nancy C. 1977. The problem of the semi-speaker in language death. International Journal of the Sociology of Language 12:23–32.
Dorian, Nancy C. 1980. Language shift in community and individual: the phenomenon of the laggard semi-speaker. International Journal of the Sociology of Language 25:85–94.
Dorian, Nancy C. 1981. Language death: The life cycle of a Scottish Gaelic dialectedition. Philadelphia: University of Pennsylvania Press.
Dorian, Nancy C. 1986. Abrupt transmission failure in obsolescing languages: How sudden the “tip” to the dominant language in communities and families? Proceedings of the Annual Meeting of the Berkeley Linguistic Society. Dorian, Nancy C. (ed.) 1989. Investigating Obsolescence: Studies in language
contraction and death. Cambridge: Cambridge University Press.
Dow, James R. (ed.) 1987. Language maintenance and language shift revisited I. vol. 68. International Journal of the Sociology of Language.
Dow, James R. (ed.) 1988. Language maintenance and language shift revisited II. vol. 69. International Journal of the Sociology of Language.
Dressler, Wolfgang U. 1972. On the phonology of language death. Papers of the Chicago Linguistic Society 8:448–457.
Dressler, Wolfgang and Ruth Wodak-Leodolter. 1977. Language Preservation and Language Death in Brittany. International Journal of the Sociology of Language 12:33–44.
Dressler, Wolfgang and Ruth Wodak-Leodolter. (eds.) 1968. Language Death. vol. 12. International Journal of the Sociology of Language. Mouton: The Hague. Fishman, Joshua A. 1964. Language maintenance and language shift as a field of
inquiry. Linguistics 9:32–70.
Fishman, Joshua A. 1966/1972. Language maintenance in a supra-ethnic age, Fishman, 1972. Language in Sociocultural Change. Chp. 3.
Fishman, Joshua A. 1972. Language maintenance and language shift as a field of inquiry revisited. In Anwar S. Dil (ed.), Language in sociocultural change: essays by Joshua A. Fishman 76–134. Stanford, CA: Stanford University Press.
Fishman, Joshua A. 1991. Reversing language shift: Theoretical and empirical foundations of assistance to threatened languages. Clevedon/Philadelphia: Multilingual Matters.
Fishman, Joshua A. 2000. Reversing language shift: RLS theory and practice revisited. In Gloria E. Kindell and M. Paul Lewis (eds.), Assessing ethnolinguistic vitality: theory and practice 1–26. SIL Publications in Sociolinguistics. Dallas: SIL International.
Gal, Susan. 1978. Variation and change in patterns of speaking: Language shift in Austria. In Sankoff (ed.), Linguistic Variation Models and Methods 227–238. Grimes, Barbara F. (ed.) 1992. Ethnologue: Languages of the world, 12th edition.
Dallas, TX: Summer Institute of Linguistics.
Grimes, Barbara F. (ed.) 1996. Ethnologue Languages of the World, 13th edition.
Dallas, TX: Summer Institute of Linguistics.
Grimes, Barbara F. (ed.) 2000. Ethnologue: Languages of the World. vol. 1, 14th edition. Dallas: SIL International.
Grimes, Joseph E. 1986. Area norms of language size. In Benjamin F. Elson (ed.), Language in Global Perspective: Papers in Honor of the 50th Anniversary of the Summer Institute of Linguistics 1935–1985, 5 –20. Dallas: Summer Institute of Linguistics.
Hale, K., M. Krauss, L. Watahomigie, A. Yamamoto, C. Craig, L. Masayevsa Jeane and N. England. 1992. Endangered languages. Language 68(1):1–42. Mufwene, Salikoko S. 2000. Language contact, evolution and death: How ecology
rolls the dice. In Gloria E. Kindell and M. Paul Lewis (eds.), Assessing ethnolinguistic vitality: theory and practice, 39–64. SIL Publications in Sociolinguistics. 3. Dallas: SIL International.
Voegelin, Carl F. and Florence M. Voegelin. 1964–1966. Languages of the world. Anthropological Linguistics 6(3–8):7.