Robust Canonical Correlation Analysis on Leakage Current Behaviors of Geothermal Polluted Porcelain Insulators
(Analisis Korelasi Kanonik Robust dalam Kelakuan Arus Bocor Isolator Porselen Terpolusi Panas Bumi)
WA LUYO,NGAPULI I.SINISUKA,SUWARNO,MAMAN A.DJAUHARI
ABSTRACT
This study presents the leakage current measurements results of three natural geothermal polluted porcelain insulators. The insulators consisted of one new-clean insulator, as reference, and three polluted insulators. The carried out measurements were leakage current and applied high voltage waveforms, used a two-channel storage digital oscilloscope, in a hermetically sealed chamber, where temperature, humidity, pressure and applied voltage amplitude could be adjusted and measured simultaneously. The leakage current waveforms were analyzed using the FFT and the statistical concerns were analyzed by the Fast-Minimum Covariance Determinant (FMCD) of robust multivariate statistical tools, and canonical correlation analysis (CCA). The result indicated that after the fundament, the second highest of harmonics leakage current were fifth harmonics. The leakage current waveforms were significantly influenced by humidity, besides pollution. The dependent or output variables are linear functions of independent or input variables. Based on CCA, the dependent parameters depended on input parameters tightly, with the canonical correlations were more than 0.99. The leakage current amplitudes were still predominantly influenced by applied voltage amplitudes, where the phase angles and THD were slightly influenced by relative humidity. On these experimental measurements, the insulators were still in normal operation.
Keywords: CCA, FMCD, geothermal, leakage current, porcelain insulator
INTRODUCTION
Overhead transmission or distribution lines are widely used in present power system to transmit electric power from generation stations to customer points. Their proper function depends on a large extent of
insulation system with the supporting
structures (Fernando, 1999). One can
summarize the whole process as an interaction
between the insulator, pollutants, wet
conditions, and applied voltage. Thus, for a better understanding of insulator pollution, wetting and the flashover process, some terms should be studied. Some terms related to this case are the local climate and environmental
(pollution) conditions surrounding the
insulator with emphasis on wetting, pollution sources and type of pollution, and leakage currents (LCs) flowing over the surface of insulator (Vosloo, 2002).
One parameter of insulator performance is specified by leakage current. LCs were characterized by some parameters, such as amplitude, phase angle or power factor, each harmonics and THD, as outputs. These parameters were influenced by some inputs, such pollutant adhered on insulator surface, relative humidity, temperature, pressure and applied high voltage amplitude (Waluyo et al., 2008). Due to from naturally site, in this case the pollutant parameter is not included on the statistical computation. Nevertheless, it has been conducted some EDAX tests on naturally pollutant, from Kamojang area of geothermal power plant. As instead, it was discussed in narrative related to leakage current.
Transmission and/or distribution lines are also passed through geothermal areas. Geothermal power stations create emission as chemical
materials, such as CO2 and H2S. Generally,
CO2 is the major component (94–98%), H2S is
high as 1–10 mg/Nm3. Typical concentrations of mercury and hydrogen sulfide were of the
order of 10–20 ng/m3 and 20–40 µg/m3,
respectively (Bacci et al., 2000).
Geothermal fluids (steam or hot water) usually
contain some gasses, such as CO2, H2S, NH3,
CH4, and trace amounts of other gasses, as well
as dissolved chemicals whose concentrations usually increase with temperature. The dissolved chemical elements, such as sodium chloride (NaCl), boron (B), arsenic (As) and mercury (Hg) were source of pollution if discharged into the environment (Dickson et al., 2004).
The typical non-condensable gasses (NCG) content in the steam flashed off the geothermal fluid from Icelandic high-enthalpy reservoirs
were SiO2, Na, K, Mg, Ca, Cl, SO4 and Fe
(Eliasson et al., 2001). H2S can reach moderate
concentrations. The incineration process burns
the gas from steam to convert H2S to SO2, the
gases are absorbed in water to form SO3 and
SO4 in solution. H2S, HCl and CO2 were
undertaken (Hammons et al., 2004). This meant it was made consider due to the chemical element existence may be reaction to the surrounding environment.
As and Hg were existed in geothermal waters. Hg was occurred in geothermal systems due to the absorption of vapour and volcanic gasses into thermal waters. As and Hg dissolved in thermal fluids and concentrated in surface alterations. Chemical compositions of thermal
waters were Cl, SO4 and HCO3 (Herdianita et
al., 2008). A gas stream containing H2S could
be converted into commercially quality sulfuric acid (Matthiasdottir, 2006). The incineration process burns the gas, as part of
steam, to convert H2S to SO2, absorbed in
water to form SO32- and SO42- (Reed et al.,
1995). Major element compositions hot pools, geysers and cold meteoric waters at El Tatio
were Ca2+, Na+, Mg2+, K+, Cl-, SO42-, SiO2, and
tAlk. The tAlk, total alkalinity, is the excess of alkaline components. The minor and trace element composition ones were Al, As, B, Ba, Br, Co, Cr, Cs, Cu, Fe, I, Li, Mn, Mo, Ni, Rb, Sr, Tl and Zn (Corlecci et al., 2005).
Typical geothermal fluids with local shallow ground waters, are characterized by a relatively
high concentration of K, Ca, NO3, SO4, and Cl
(Marques et al., 2003). The waters were mostly acid with pH from 1.5 to 7.9 caused by exhausted from the O, taken geothermal power station was supplied to a specific hot solution in which a thermophilic sulfur oxidizing bacterium was cultured. In this solution, the
bacterium converts the H2S in the gases into
H2SO4 (Hirowatari et al., 1995).
As additional information, mercury levels in lichens were within the background range (0.1-0.2 microg/g dw). On the contrary, at Aiole, Hg concentrations (0.63-0.67 microg/g dw) were much higher than background. After the new geothermal power plant went into operation at Bagnore, lichen concentrations of Hg showed a 50% increase from 0.22 to 0.32 microg/g dw (Loppi, 2001). Boron removal after single stage regeneration with 10%
H2SO4 was found to be possible (Gokcen et al.,
2004). The typical of non-condensable gasses
(NCG) consist mainly of CO2 and NH3
(97-99%) (Demirbas, 2002). H2S content in NCG
was 100-200 ppm (Kaygusuz and Kaygusuz, 2002). Geothermal power plants (GTPP) could
release from the non-condensable fraction of
the steams: CO2 (98%), H2S (1.5%), methane
(0.4%), hydrogen (0.1%). The oxidation of
H2S to SO2 and its subsequent reaction to
sulphate ions within the atmospheric produces aerosols representing a major component of acid rain. GTPP could also release, from the non-condensable fraction of the steams, trace amounts (0.001%) of ammonia, radon, boron, arsenic, cadmium and antimony. Ammonia and mercury may also enter local waters from
geothermal steam condensate (EcoLogo,
2008).
Above cited references indicated that
Covariance Determinant (FMCD) and canonical correlation analysis (CCA). FMCD algorithm, based on the so-called C-step, is the
most efficient from the computational
viewpoint (Herwindiati et al., 2007). For experimental results statistically. The clean data were defined as data did have suspected outlier(s). It is difficult to detect outliers in p-variate data when p>2 because one can no longer rely on visual inspection. Although it is still quite easy to detect a single outlier by means of the Mahalanobis distances, this approach no longer suffices for multiple outliers because of the masking effect, by which multiple outliers do not necessarily have large Mahalanobis distances. It is better to use distances based on robust estimators of multivariate location and scatter. In regression analysis, robust distances computed from the explanatory variables allow us to detect leverage points. Moreover, robust estimation of multivariate location and scatter are key
tools to be robust, other multivariate
techniques such as principal component analysis and discriminant analysis (Rousseeuw & Driessen, 1999).
In some sets of multivariate data, naturally determining linear combination pairs that have
highest correlation. Furthermore, it is
necessary for determining linear combination pairs that have highest correlation, after previous first choice, and so on. The linear combination pairs are called Canonical Variables, and their correlations are called
Canonical Correlations. Canonical
Correlations measure strength of relation
between two variable sets. Technical
maximized aspect represents an effort to concentrate a high dimensional relation between two sets into some canonical variables pairs. CCA is also study of relation between a
predictor (independent variables) variable set and response size set (dependent, criterion variables). In multiple regression approach to obtain a linear combination of original predictor variable, it describes variations of criterion size. CCA is used to analyze some predictor variables and criterion variables simultaneously (Johnson & Wichern, 2002; Manly, 1989; Dillon & Goldstein, 1984; Seber, 1984; Harris, 2001).
The objectives of research are to obtain the tendency of leakage current properties on porcelain insulators from the new-clean to nearly two years polluted conditions those installed on a geothermal power plant area.
These properties are LC amplitudes,
waveforms and phase angles. The relations among properties to environmental parameters are analyzed using robust canonical correlation analysis (CCA). It is called ‘robust’ because it was given precedence a data cleaning with Fast Minimum Covariance Determinant (FMCD) of
robust multivariate statistical tools. As
comparison, it is given some graphics which indicated some parameters of leakage current
to some environmental parameters
individually, especially to relative humidity.
EXPERIMENTAL AND ANA LYSIS METHODS
These experiments were conducted on one new-clean and three polluted identical 20 kV outdoor porcelain insulators. The polluted insulators were some new-clean insulators which installed at PLN switchyard of Kamojang geothermal power plant, West Java, where is located around 1350 m above sea
level, on December 14th, 2006 together, and
then taken gradually, one by one, around 3 to 4 months later. The date of insulator withdrawal is mentioned on the chapter of experimental results, for each insulator.
The insulators were tested in a hermetically sealed chamber, where temperature, humidity, pressure and applied voltage could be adjusted and measured simultaneously. The size of the chamber was 120 cm x 150 cm x 120 cm (WxHxD). The measurements of leakage current and applied high voltage waveforms
used a two-channel storage digital
manuscript, it is revealed in Excel graphical form only. The schematic diagram of experimental set up is shown in Figure 1. Furthermore, the data of LC waveforms were analyzed with fast Fourier transform (FFT), to obtain harmonic frequency spectra. The total harmonic distortion (THD) was defined as the total ratio of harmonic component amplitudes and the amplitude of fundamental frequency (Suwarno, 2006), as
1 ~
2 2
I I
THD n
n
(1)
Thus, the frequency spectra were obtained on
some conditions of insulators. These
implementations used the Danielson-Lanczos method (Originlab Co., 2003). Furthermore, the data were analyzed by using FMCD to find the clean data and made correlations by using canonical correlation analysis (CCA). Figure 2 shows the flowchart of research and analysis methods. Firstly, the leakage current of new-clean and gradually polluted insulators were measured by using the oscilloscope.
FIGURE 1. Schematic diagram of experimental set up
FIGURE 2. Flow chart of research and analysis methods
Besides that, it was also read and noted the humidity, temperature and pressure. After the measurement steps, it was obtained leakage current amplitudes, phase angles and power factors or cosine of phase angle. Otherwise, the leakage current waveforms were analyzed by
using FFT, to obtain 1st to 13th odd harmonics
amplitudes. Finally, all above parameters were analyzed by using FMCD, and then CCA.
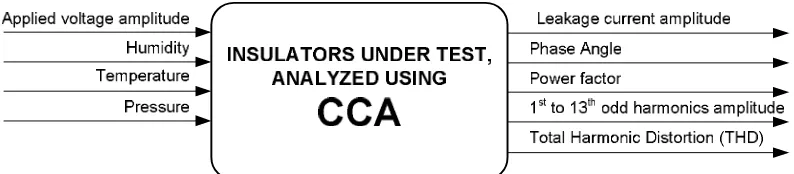
FMCD function is as filtering of clean data against to suspected outlier data. Whereas, CCA correlated between input (independent) data and output (dependent) data. In this case, the input parameters were applied voltage amplitude, humidity, temperature and pressure, and the output parameters were leakage current
amplitude, phase angle, power factor, 1st to 13th
odd harmonics amplitudes and THD. The block diagram between input and output parameters using CCA is shown in Figure 3.
Briefly, FMCD algorithm based on C-step is the most efficient from the computational
FIGURE 3. Input-output parameter black box diagram
p-variate observations. The FMCD algorithm is as follows (Herwindiati et al., 2007):
1. Let Hold be an arbitrary subset containing
h data points.
covariance matrix Hold of all observations
belonging to Hold. Then, compute
old
old
old
EXPERIMENTAL RESULTS,ANALYSIS AND DISCUSSION
The Results from New-Clean Porcelain Insulator
There were many data on these measurement results. Nevertheless, it is presented two significant conditions only, namely dry (low humidity) and wet (high humidity). Due to similar behaviour for the leakage current waveforms on dry or low humidity conditions, it is only shown one leakage current waveform on those conditions. However, it is shown the leakage current waveforms on high humidity for each withdrawal of polluted insulators.
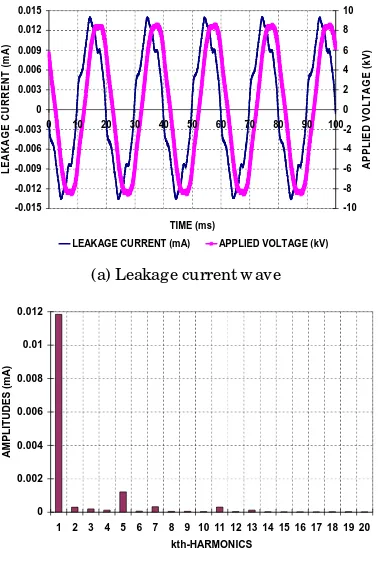
Figure 4(a) shows the leakage current and applied voltage waveforms of new-clean
insulator on the conditions of 67%, 26.7 centigrade, -0.8 kPa and 9.24 kV for relative humidity, temperature, pressure and maximum applied voltage respectively. The 67% of relative humidity was as dry typical condition.
From the leakage current and applied voltage waveforms, it was obtained a difference of
angle, usually called phase angle, was 81.3 degree. It meant that the insulator in new, clean and dry condition was very capacitive.
-0.008
LEAKAGE CURRENT (mA) APPLIED VOLTAGE (kV)
(a) Leakage current w ave
0
(b) Frequency spectrum of leakage current
Whereas, Figure 4(b) shows the corresponding leakage current frequency spectrum harmonics. In this condition, the first to thirteenth odd current and applied voltage waveforms of new clean insulator in 99% of relative humidity, 26.7 centigrade of temperature, no pressure and 8.6 kV maximum applied voltage
LEAKAGE CURRENT (mA) APPLIED VOLTAGE (kV)
(a) Leakage current w ave
0
(b) Frequency spectrum of leakage current
FIGURE 5. The leakage current w ave and its frequency spectrum of high humidity
new -clean insulator
From this figure, it is shown that the leakage current waveform was different from the previous low humidity typical condition. The peaks of wave became sharper, and the phase angle, i.e. the angle was between leakage current and applied voltage waves, became smaller. This indication tends to approach a pure sinusoidal waveform relatively rather than that low humidity one. From both leakage
current and applied voltage waves, it was obtained the phase angle of 46.7 degree. This number was obtained from the calculation of
leakage current and applied voltage
experimental measurement. The amplitude of leakage current wave became higher than the
previous low humidity condition. This
phenomenon was dominantly caused by high humidity conditions. Thus, the high relative humidity made the new-clean porcelain insulator became little more conductive, rather than that dry condition. Nevertheless, the leakage current wave was not until pure sinusoidal waveform, and the wave did not coincide to the applied voltage wave. It meant the insulator did not reach a pure resistive property. The capacitive property was still dominant.
Moreover, Figure 5(b) shows the frequency spectrum of leakage current on the high humidity new-clean porcelain insulator. The first to thirteenth odd harmonic amplitudes were 85.8%, 1.43%, 8.84%, 2.39%, 0.43%, 2.26% and 0.89% respectively compared to the amplitude leakage current wave. Especially the percentage of fifth harmonic amplitude had reduced, from 14.93% became 8.84%. THD became 11.2%, from previous 18.6%. This meant the leakage current wave tent to close a pure sinusoidal wave compared to the previous condition. Nevertheless, the insulator still worked normally, although the third harmonic had increased. Usually, a non normality of insulator performance is indicated by third harmonic amplitude which is very high, beside the leakage current amplitude which very high.
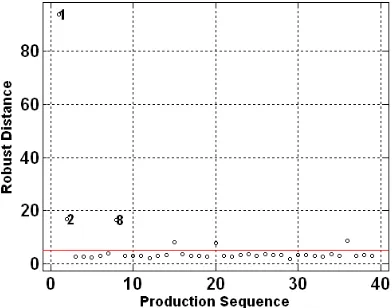
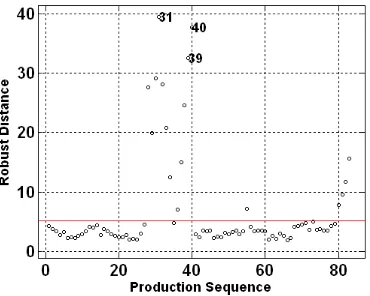
Figure 6 shows test result scatter plots of FMCD or robust distance. Based on the robust test, the suspected outlier data were sequential data of 1-8, 10, 13-16 and 7 last data. Generally, it is seen the result data of FMCD
robust distance were mostly grouping
distinctly under cut-off line. The under cut-off line data were not suspected as outlier data, which were taken account on CCA.
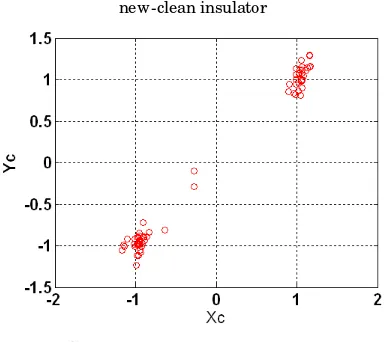
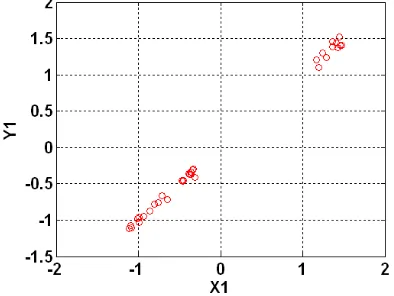
Figure 7 shows the canonical result scatter plot based on robust distance for new-clean porcelain insulator. In this case, the first canonical correlation was 0.99466. This value, closed to unity, indicated that the correlation
between independent and dependent variables
FIGURE 6. Robust distance results on LC data of new -clean insulator
FIGURE 7. Canonical result scatter plot based on FMCD of new-clean insulator
Based on canonical variates for corresponding canonical correlation, the horizontal axis Xc
was 0.008636*H + 0.0231467*T +
0.014693*P - 1.0038348*Vmax, where H, T, P
and Vmax are relative humidity, temperature,
pressure and applied voltage amplitude respectively. It is indicated that the influence of applied voltage was very significant to dependent parameters. Whereas, Yc was
848.7*Imax + 1.14*PHI + 70.7*PF - 759.2*H1 + harmonics and total harmonic distortion respectively. It is indicated that leakage current amplitude was influenced by input parameters, especially by applied voltage amplitude, very considerably.
It is indicated that the scatter plots tent to concentrate on a straight line and balance between positive and negative of axes. These
phenomena indicated that the output
parameters highly depended on the input
parameters. If it is made regressions with one and five powers, the regression equations were
c
Both equations are different explicitly.
However, if it was made curves, it would show linear lines. Based on data analysis, the high coefficients of output parameters were leakage
current amplitude and third harmonics
amplitude of leakage current. These two parameters were especially contributed by applied voltage amplitude and humidity.
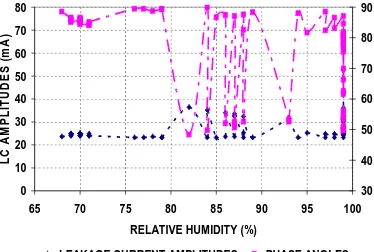
As a descriptive comparison, it is also presented the leakage current amplitude and phase angle, as shown on Figure 8, and total harmonic distortion (THD), as shown on Figure 9, as function of relative humidity on the experimental results of new-clean porcelain insulator. The leakage current amplitude would increase slightly as relative humidity rose. Otherwise, the phase angle would reduce if relative humidity increased. The latter of reducing phase angle was significantly enough. Whereas, the THD would decrease if relative humidity increased.
0
LEAKAGE CURRENT AMPLITUDES PHASE ANGLES
FIGURE 8. Leakage current amplitude and phase angle vs relative humidity of new -clean insulator
The results from first withdrawal polluted porcelain insulator
10% relative humidity of new -clean insulator
Nevertheless, on high relative humidity, they were significantly different. Thus, it is presented the waveforms on high humidity only.
On the first removal porcelain insulator, it was
carried out on 31th August 2007, the
waveforms are shown in Figure 10(a). This
condition was 90%, 34.5oC and 42 kVmax for
relative humidity, temperature and applied voltage amplitude respectively, and without pressure. The odd harmonics were 91.4%, 0.4%, 7.3%, 1.6%, 0.2%, 0.1% and 0.1% to
leakage current amplitude, 206 A.
-0.25
LEAKAGE CURRENT (mA) APPLIED VOLTAGE (kV)
(a) Leakage current and applied waves
0
(b) Leakage current frequency spectrum
FIGURE 10. The LC w ave and frequency spectrum of high humidity first w ithdraw al polluted insulator
Otherwise, the impedance, THD and phase
angle were 203,883,495 , 8.26% and 35.6
degree respectively. It is shown that the leakage current waveform was more pure sinusoidal than that on dry condition. The leakage current amplitude was higher than that on low humidity. It was the closest to pure sinusoidal waveform among other waveforms.
The approach to pure sinusoidal waveform property is also indicated by frequency spectrum in Figure 10(b). It is shown that after fundamental, the second highest is fifth harmonics, which is very small, indicated that the leakage current waveform tend to be pure sinusoidal relatively.
Figure 11 shows test result scatter plots of robust distances of first withdrawal polluted insulator leakage current data. Based on the robust test, the suspected outlier data were sequential data of 1,2,8,15,20 and 36 sequential data.
FIGURE 11. Robust distance results on leakage current data of first withdraw al polluted insulator
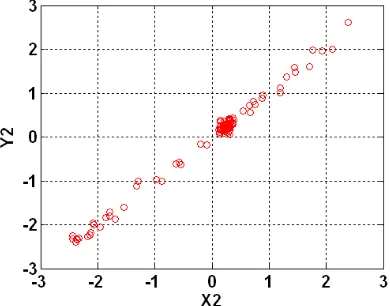
Figure 12 shows the canonical scatter plot based on robust distance of leakage current for first withdrawal geothermal polluted porcelain insulator. In this case, the canonical correlation is 0.9989. This value, closed to unity, indicated
that the correlation between independent and
dependent variables was very very high.
Statistically, this case revealed that the output variables almost depended on input variables, as 99.89%.
The horizontal axis X1 was -0.0001225*H -
0.0724227*T - 0.124997*P - 0.991497*Vmax.
It is also indicated that the influence of applied voltage was very significant to dependent parameters. Whereas, the vertical axis Y1 was
14.14*Imax + 1.272*PHI + 105.75*PF +
1068.3*H9 - 1645*H11 + 220*H13 +
0.66*THD, where Imax, PHI, PH, H1-H13 and
THD were leakage current amplitude, phase angle, power factor, first to thirteenth odd harmonics and total harmonic distortion respectively. It is indicated that leakage current amplitude was influenced by input parameters, especially by applied voltage amplitude, very considerably.
FIGURE 12. Canonical result scatter plot based on FMCD of first withdraw al polluted insulator
It is indicated that the scatter plots tent to concentrate on a straight line and balance between positive and negative of axes. These
phenomena indicated that the output
parameters highly depended on the input parameters. If it is made regressions with one and five powers, the regression equations were
1
Both equations are different explicitly.
However, if it was made curves, it would show linear lines. Based on data analysis, the high coefficients of output parameters were leakage current amplitude, power factor and third harmonics amplitude of leakage current. These three parameters were especially contributed by applied voltage amplitude and humidity. The effect of humidity and applied voltage reduced rather than that the new-clean insulator. This case was caused by influence of pollutant on insulator surface. The dry season was in progress, when withdrawal of insulator.
As a descriptive comparison, it is also presented the leakage current amplitude and phase angle, as shown on Figure 13, and total harmonic distortion (THD), as shown on
Figure 14, as function of relative humidity on the experimental results of first withdrawal porcelain insulator. The leakage current amplitude would increase very slightly as relative humidity rose. Otherwise, the phase angle would reduce significantly enough if relative humidity increased. Whereas, the THD would decrease slightly if relative humidity increased.
LEAKAGE CURRENT AMPLITUDES PHASE ANGLES
FIGURE 13. Leakage current amplitude and phase angle vs relative humidity of first w ithdraw al
insulator
FIGURE 14. Total harmonic distortion (THD) vs relative humidity of first w ithdraw al insulator
The Results from Second Withdrawal Polluted Porcelain Insulator
Whereas, Figure 15(a) shows the waveforms of second withdrawal porcelain insulator on high
humidity condition (on 4th December 2007).
These waveforms were measured on 99%,
28.9oC, 34.4 kVmax for relative humidity,
temperature and applied voltage amplitude, and without pressure.
Figure 15(b) shows the leakage current harmonic frequency spectrum. The harmonics
were 23.9 A, 0.2 A, 4.3 A, 1.47 A, 0.22
A, 0.65 A and 0.12 A, and the leakage
and phase angle were 19.3 % and 66.8 degree,
LEAKAGE CURRENT (mA) APPLIED VOLTAGE (kV)
(a) Leakage current and applied voltage w aves
0
(b) Leakage current frequency spectrum
FIGURE 15. The leakage current wave and frequency spectrum of high humidity second w ithdraw al
polluted insulator
It is shown that fifth and seventh harmonics were also dominant, after the fundamental. These occurrences were caused by the leakage current waveform on Figure 15(a) which was rather far from pure sinusoidal waveform. In this condition, the insulator was still in capacitive property, due to less of pollutant on the insulator surface. This was caused by the withdrawal of insulator was conducted in rainy season. Thus, the insulator was still relatively clean, so that effect of high humidity was relatively low.
Based on the robustness test result, it was revealed the script like as below. Thus, there was not detected a suspected outlier.
Figure 16 shows the canonical scatter plot based on robust distance of leakage current for
second withdrawal geothermal polluted
porcelain insulator. In this case, the canonical correlation was 0.9989.
The horizontal axis X2 is - 0.0033737*H - voltage amplitude was most dominant among other input parameters. Otherwise, the most dominant of output parameters was power factor or phase angle. The latter case meant the power factor or phase angle had most change due to various input parameters, among other output parameters. If it is made regressions with
Although, both mathematical equations are different, actually both graphical lines are similar as linear.
FIGURE 16. Canonical result scatter plot based on FMCD of second w ithdrawal polluted insulator
humidity on the experimental results of second withdrawal porcelain insulator. The leakage
current amplitude would increase very very
slightly, or be practically linear, as relative humidity rose. Otherwise, the phase angle would reduce slightly if relative humidity increased. Whereas, the THD would decrease very slightly if relative humidity increased.
0
LEAKAGE CURRENT AMPLITUDES PHASE ANGLES
FIGURE 17. Leakage current amplitude and phase angle vs relative humidity of second withdraw al
insulator
FIGURE 18. Total harmonic distortion (THD) vs relative humidity of second w ithdraw al insulator
The Results from Third Withdrawal Polluted Porcelain
Figure 19(a) presents the leakage current and applied voltage waveforms of porcelain
insulator for third withdrawal on 18th March
2008. The condition of measurement was 99%,
25.8oC, 15.6kPa, and 34.44 kVmax for relative
humidity, temperature, pressure and applied voltage respectively. On this condition, the leakage current amplitude and phase angle
were 67.2 A and 25.69o respectively. It is
seen that the phase angle was small, indicated by the leakage current wave is so close to applied voltage wave.
Figure 19(b) shows the leakage current frequency spectrum on that condition. The
harmonic amplitudes were 60.83 A, 0.405
A, 5.77 A, 1.60 A, 0.292 A, 0.609 A
and 0.028 A for first to thirteenth odd
harmonics respectively. In percentage, these were 90.52%, 0.60%, 8.59%, 2.38%, 0.43%, 0.91% and 0.04%, while THD was found to be 9.93%. This value was so small, due to the leakage current waveform closed to sinusoidal form.
LEAKAGE CURRENT (mA) APPLIED VOLTAGE (kV)
(a) LC and applied voltage waves
0
(b) LC frequency spectrum
FIGURE 19. The LC w ave and frequency spectrum of w et third w ithdraw al polluted insulator
It is shown that fifth and seventh harmonics were also dominant, after the fundamental. However, their percentages to fundamental were lower than the second withdrawal. This meant the LC waveform was more pure sinusoidal rather than the second withdrawal, both on high humidity.
FIGURE 20. Robust distance results on leakage current data of third w ithdrawal polluted insulator
Figure 21 shows the canonical scatter plot based on robust distance of leakage current for third withdrawal geothermal polluted porcelain insulator. In this case, the canonical correlation was 0.9917.
The horizontal axis X3 is 0.0026*H + 0.134*T
+ 0.033*P + 0.1623*Vmax. Whereas, the
vertical axis Y3 is 0.0091*Imax + 0.11996*PHI
+ 6.3*PF + 0.04*H1 - 1.65*H3 + 0.8045*H5 +
0.1663*H7 - 0.3514*H9 - 0.23*H11 + 0.44*H13
+ 9.65*THD.
FIGURE 21. Canonical result scatter plot based on FMCD of third w ithdrawal polluted insulator
Based on the horizontal axis, the most dominant influence of input parameters was also applied voltage amplitude. Otherwise, the significant influence of output parameters were total harmonic distortion (THD) and power factor. Both latter output parameters were most change due to various change of output parameters. If it is made regressions with one and five powers, the regression equations were
3
abscissa respectively.
Although, both mathematical equations are different, actually both graphical lines are fairly linear. Thus, the high power of polynomial equations did not influence significantly.
It is also presented the leakage current amplitude and phase angle, as shown on Figure 22, and total harmonic distortion (THD), as shown on Figure 23, as function of relative humidity on the experimental results of third
withdrawal porcelain insulator. The leakage
current amplitude would be practically linear, as relative humidity rose. Otherwise, the phase angle would reduce very slightly if relative
LEAKAGE CURRENT AMPLITUDES PHASE ANGLES
FIGURE 22. Leakage current amplitude and phase angle vs relative humidity of third withdraw al
insulator
FIGURE 23. Total harmonic distortion (THD) vs relative humidity of third w ithdraw al insulator
and phase angles would reduce as the humidity rise. These cases were explicitly indicated on high humidity, especially close to 99% of relative humidity. Nevertheless, the leakage current waves did not coincide to applied voltage wave. This was indicated that although the porcelain insulators were susceptible to humidity, and also to pollution, the geothermal switchyard area where taken as place of research, had medium pollution. Thus, the pollutant slightly influenced to leakage current of insulators.
Although, the porcelain insulators were influenced by humidity, in these cases, the
leakage current amplitudes were still
dominantly influenced by applied voltage amplitude. Nevertheless, the phase angles and total harmonic distortion (THD) of leakage current were significantly influenced by relative humidity. Generally, the phase angles and THD would reduce if the relative humidity increased. These cases meant that the insulators would be slightly more resistive rather than capacitive. However, on the high relative humidity, around 99%, the insulators were still dominated by capacitive property.
Refer to harmonics analysis, all second highest of harmonic amplitudes after fundamental frequency were fifth harmonics. Nevertheless, their percentages to fundamental frequency were different, depended on leakage current waveforms. Furthermore, the leakage current
waveforms depended on environmental
conditions, especially relative humidity. If the
relative humidity was increased, the
percentage of fifth harmonics to fundamental frequency of leakage current would reduce, due to the leakage current waveforms fairly tent to be close to pure sinusoidal.
Using fast minimum covariance determinant (FMCD), it is seen that some data were suspected as outliers. Usually, the suspected outliers were the different applied voltage considerably among other data, too high or too low. Thus, the suspected outlier data did not include to further analysis, namely canonical correlation analysis (CCA). On this using of CCA, the independent variables were applied
voltage amplitude, relative humidity,
temperature, and pressure. Otherwise, the
dependent variables were leakage current
amplitude, phase angle, power factor, 1st to 13th
odd harmonics amplitudes and THD. The dependent or output variables are linear
functions of independent or input variables. These meant the output parameters depended upon the input parameters considerably. Based on CCA, the dependent parameters depended upon input parameters tightly, indicated by the all canonical correlations were more than 0.99,
closed to unity. The leakage current
amplitudes were still dominantly influenced
by applied voltage amplitudes, where the phase angles and THD were slightly influenced by relative humidity. On these experimental measurements, the insulators were still in normal operation.
The independent variables, including their canonical variates, are placed on the abscissas and dependent variables are placed on the ordinates. All relations of dependent variables
to independent variables are linear. Therefore,
with certain canonical correlations and canonical variates, it can be said that independent variables influenced to change the
dependent variables almost linearly.
Physically, it was indicated that the changes of
applied voltage amplitude, humidity,
temperature and/or pressure would change the leakage current amplitude, phase angle, power
factor, 1st to 13th odd harmonics and/or THD
were fairly linearly too, and the output parameters were considerably depended on the independent parameters. Thus, the insulators, when the measurements were in progress, work in normal conditions.
CONCLUSIONS
Based on some experimental and analysis studies, it can be concluded some items;
- After the fundamental, the second highest of
harmonics of leakage current were fifth
harmonics. Their percentages were
determined by leakage current waveforms.
- The leakage current waveforms were
significantly influenced by humidity,
besides pollution.
- In these porcelain insulators, the leakage
current amplitudes were still dominantly influenced by applied voltage amplitudes.
- Based on FMCD, the suspected outlier data
were usually the data which the applied voltage amplitudes were very far among data, too high or too low.
- On the CCA results, the dependent
parameters were linear functions of
canonical variates. These meant the output parameters were very tightly influenced by input parameters, indicated also by the
Authors herewith respectfully offer thanks Competitive Grant (Hibah Bersaing), The Directorate General of Higher Education, The Republic of Indonesia research projects, for supporting this research.
REFERENCES
Bacci, E., Gaggi, C., Lanzillotti, E., Ferrozzi, S. & Valli, L. (2000). Geothermal power plants at Mt. Amiata (Tuscany–Italy): mercury and hydrogen sulphide deposition revealed by vegetation. Chemosphere, 40(8), 907-911.
Corlecci, G., Boschetti, T., Mussi, M., Lameli, C.H., Mucchino, C. & Barbieri, M., (2005). New Chemical and original isotop data on waters from El Tatio Geothermal
Field, Northern Chile, Geochemical
Journal, 39, 547-571.
Demirbas, A. (2002). Turkey’s Geothermal Energy Potential. Energy Sources, 24(12), 1107-1115.
Dickson, M.H. & Fanelli, M. (2004, Feb.), What is Geothermal Energy?, Retrieved
from http://www.geothermal-energy.org/
314,what_is_geothermal_energy.html Dillon, W.R. & Goldstein, M. (1984).
Multivariate analysis, methods and
applications. New York: John Wiley & Sons.
doi: 10.1080/15325000490224076
EcoLogoCm Program Management (2008) (D)
Geothermal-Powered Electricity; CCD-003: Electricity-Renewable Low-Impact, EcoLogoCM Program Criteria Review, Certification Discussion Document, p. 8-13.
Eliasson, E.T. (2001). Power Generation from
High-Enthalpy Geothermal Resources.
GHC Bulletin, 22(2), 26-34.
Fernando, M.M.A.R. (1999). Performance for
non-ceramic insulators in tropical
environments. PhD. Dissertation, Chalmers
University of Technology, Goteborg-Sweden.
Gokcen, G., Ozturk, H.K., & Hepbasli, A., (2004). Geothermal Fields Suitable for Power Generation, Energy Sources, 26(5), 441-451,
doi:10.1080/00908310490429722
Gunnarsson, I, Stefánsson, A., Óskarsson, N., Carrasco, A., Kleindienst, A.B., Neubauer, E., Von Aulock, F.W., Kúld, I.H., Ajayi. J.O, Opondo, K.M., Guðmundsson, K.L., Theissen, S., Níelsson, S., Hahnewald,
S.A. & Liebke, U. (2006). Acid
geothermal waters and elemental mobility at Krísuvík geothermal area. Retrieved on June 24, 2009, from http://www.theochem. org/Raunvisindathing06/abstracts/ig2-en.pdf
Hammons, T.J. (2004), Geothermal power generation worldwide; global perspective, technology, field experience, and research
and development, Electric Power
Components and Systems, 32(5), 529-553. Harris, R. J. (2001). A Primer of multivariate
statistics. New Jersey: Lawrence Erlbaum Associate, Inc..
Herdianita, N.R. & Priadi, B. (2008). Arsenic and mercury concentrations at several
geothermal system in West Java,
Indonesia. ITB Journal Science, 40A(1),1-14.
Herwindiati, D.E., Djauhari, M.A. & Mashuri, M. (2007) Robust Multivariate Outlier Labeling. Communications in Statistics - Simulation and Computation, 36(6), 1287 - 1294, doi: 10.1080/03610910701569044 Hirowatari, K., Kusaba, S. Izumi, J., Takeuchi,
K. (1995). Production of sulfuric acid from geothermal power station exhausted gas for use in scale prevention. Proceedings of the World Geothermal Congress, Italy, 2445-2450.
Johnson, R.A. & Wichern, D.W. (2002). Applied multivariate statistical analysis.
New Jersey: Pearson Education
International.
Kaygusuz, K. & Kaygusuz, A. (2002),
Geothermal energy: Power for a
sustainable future. Energy Sources, 24(10), 937-947.
Manly, B.F.J. (1989). Multivariate Statistical Methods: A primer. Chapman and Hall,
Reprinted, First Published Ed., 114-125.
Markusson, S.H., Stefansson, A. &
Fridriksson, T. (2009). Acid sulfate alteration of basalts in active geothermal
systems, Krísuvík, Iceland. 19th V.M.
Goldschmidt™ conference. Goldschmidt Conference Abstracts 2009. Retrieved
from http://www.goldschmidt2009.org/
abstracts /view.
Marques, J.M, Marques, J.E, Carreira, P.M., Graca, R.C., Barros, L.A., Carvalho, J.M., Chamine, H.I. & Borges, F.S. (2003). Geothermal fluids circulation at Caldas do
Moledo area, Northern Portugal;
geochemical and isotopic signatures. Geofluids, 3(3), 189-201.
Matthiasdottir, K.V. (2006). Removal of hydrogen sulfide from non-condensable geothermal gas at Nesjavellir power plant. Retrieved June 24, 2009 from http: //www.chemeng.lth.se/exjobb/E251.pdf. OriginLab Co. (2003). Origin V75 User's
Manual. Massachusetts: OriginLab
Corporation, 601-611.
Reed, M.J. & Renner, J.L.
(1995),.Environmental compatibility of geothermal energy. In F.S. Sterret (Ed.), Alternative fuels and the environment. Boca Raton: CRC Press.
Rousseeuw, P.J. & Driessen, K.V. (1999). A fast algorithm for the minimum covariance
determinant estimator. Technometrics,
41(3), 212-223.
Seber, G.A.F. (1984). Multivariate
Observations. New York : John Wiley & Sons.
Suwarno (2006). Leakage current waveforms of outdoor polymeric insulators and possibility of application for diagnostics of insulator conditions. Journal of Electrical Engineering & Technology, 1(1), 114-119. Verboven, S. & Hubert, M.. (2009). LIBRA: A
MATLAB Library for Robust Analysis. Retrieved from http://wis.kuleuven.be/ stat/robust/LIBRA.html.
Vosloo, W.L. (2002). A comparison of the performance of high-voltage insulator materials in a severely polluted coastal environment. PhD. Dissertation, University of Stellenbosch, South Africa.
Waluyo, Sinisuka, N.I., Pakpahan, P.M., Suwarno & Djauhari, M. A. (2008). Comparison of eight month coastal polluted porcelain and epoxy resin outdoor
insulators. ITB Journal Engineering
Science, 40(2), 122-144.
AUTHORS:
Waluyo
School of Electrical Engineering and
Informatics, Bandung Institute of Technology (ITB), Jl. Ganesha No. 10 Bandung 40132 Indonesia
Department of Electrical Engineering, National Institute of Technology (ITENAS) Bandung, Jl. PKH Hasan Mustafa No. 23 Bandung 40124 Indonesia.
Ngapuli Irmea Sinisuka, Suwarno
School of Electrical Engineering and
Informatics, Bandung Institute of Technology (ITB), Jl. Ganesha No. 10 Bandung 40132 Indonesia
Maman Abdurahman Djauhari
Department of Mathematics, Faculty of
Science, Universiti Teknologi Malaysia
(UTM), 81310 UTM Skudai Johor Bahru Johor, Malaysia.
Email: [email protected]