Citation: Kitila G, Kebede B, Guta D, Bekele F, Wagari M, Tilahun B, et al. Epidemiological Investigation of Austin J Vet Sci & Anim Husb - Volume 4 Issue 1 - 2017
Austin Journal of Veterinary Science &
Animal Husbandry
Abstract
The cross-sectional study was carried out from January to May, 2015 to assess prevalence of bovine trypanosomosis and apparent density of its vectors in Yayo district Iluababora zone of western Oromia. In current study 408 cattle were randomly selected for the study of bovine trypanosomosis prevalence in the district. Blood sample were collected from ear vein of cattle drawn into heparinized capillary tube then centrifuged and buffy coat techniques and thin blood smear were used to identify species of trypanosomes. This revealed that overall prevalence 7.4%, 95% CI: 5.1 - 10.0% with the highest rate of infection of T. congolonse (66.7%) than T. vivax 8(26.7%) and mixed infection 2(6.7%). Prevalence of trypanosomosis higher in female cattle 8%, 95% CI: 5.0 – 11.6%, old cattle 25%, 95% CI: 0.0 – 62.5% and poor body condition score cattle 9.3%, 95% CI: 3.7 – 14.8% and they were insigniicantly associated with the bovine trypanosomosis prevalence. Bovine trypanosomosis prevalence was higher in aneamic 26(7.54%), poor body condition score 10(9.26%), female 21(8.11%) and old cattle 28(7.49%) and all the risk factors are insigniicantly associated with trypanosomosis prevalence. The mean PCV of the infected cattle, male cattle and medium body condition score cattle were 17.767%, 95% CI: 15.96 – 19.58%, 20.274%, 95% CI: 19.78 – 20.77%, 20.09%, 95% CI: 19.53 – 20.65% lower than their perspective, respectively. In study 45 monopyramidal traps used to assess apparent density of tsetse lies and other biting lies in the district were G. pallidipes and G. f. fuscipes caught with overall apparent density of 142.41 FTD and other biting lies Tabanus, Stomoxys and Heamatopota. This indicates that how much tsetse lies and trypanosomosis challenge the livelihood of farmers. Therefore, chemoprophylaxis and prophylactics techniques and vector control techniques should be implemented.
Keywords: Prevalence; Risk factors; Bovine Trypanosomosis; Apparent densities; Yayo district
be transmitted by mechanical vectors of biting lies [5,6]. According to National Tsetse and Trypanosomosis Investigation and Control Center [1], tsetse transmitted animal trypanosomosis still remain as one of the largest cause of livestock production losses in Ethiopia. Trypanosomosis is characterisations are intermittent fever, anaemia, immunodepression, heart failure, oedemas and wasting. Methods used to reduce trypanosomiasis and its efects are use of drugs for curative and preventive and use of trypanotolerant cattle (Muturu and N’Dama). Economic impacts developed are direct losses (loss of production, mortality and abortion), cost of control (cost of drugs, transportation cost to ield and operators salaries) and indirect losses (loss of potential production) [4,7].
here are 22 diferent species of tsetse lies inhabit Africa. hese species are arranged into three groups based on their male genitalia construction. Groups are morsitans, palpalis and fusca. Studies interest for tsetse distribution are emanated from irstly tsetse belts continue from one country to the next, across the national boundary, secondly an expansion of a tsetse belt in one country may cause the belt to come up to and cross an international boundary and thirdly knowing the continental distribution of tsetse species gives a greater
In tro d u ctio n
Bovine trypanosomosis is disease that results in scarcity of animal production and productivity in sub-Saharan African countries which include western and southwestern parts of Ethiopia. It covers over 10 millions of square kilometers of potentially productive land [1,2]. Vector borne trypanosomosis is excluding some 180,000–200,000km2 of agriculturally suitable land in the west and southwestern parts of the country; leaving 14 million of cattle, equivalent number of goat’s and more than 7.5 million equines and 2.3 million of camels are at risk of contracting trypanosomosis [3].
Trypanosomosis is one of the diseases that are caused by lagellated protozoan parasites which belong to the genus Trypanosoma. Trypanosoma is a unicellular parasite found in the blood and other tissues of vertebrates including livestock, wild life and people [4]. he species of trypanosomes are known to exist in Ethiopia, which are pathogenic to cattle, are Trypanosoma congolense, Trypanosoma vivax and Trypanosoma brucei. hey are distributed mainly in tsetse belt region of the Ethiopia. However, T. vivax is also found in areas outside of the tsetse belt, where it can possibly
Research Article
Epidem iological In vestigation of Bovin e Trypan osom osis
an d Its Vector Apparen t Den sities in Yayo District
Illuababora Zon e, Western Orom ia, Ethiopia
Kitila G1, Ke b e d e B2*, Gu ta D3, Be ke le F3, W a ga ri M3, Tila h u n B3 a n d Ta d e s s e A3
1Ethiopian Public H ealth In stitute, Addis Ababa, Ethiopia 2Veterin ary Drug an d An im al Feed Adm in istration an d
Con trol Authority, Addis Ababa, Ethiopia
3Bedelle Region al Veterin ary Laboratory Cen ter, Bedelle,
Ethiopia
*Co rre s p o n d in g a u th o r: Bedaso Kebede, Veterin ary Drug an d An im al Feed Adm in istration an d Con trol Authority, Addis Ababa, Ethiopia
understanding of what stops the ly from spreading further, and whether a spread beyond the present limits in a particular country is likely. Distribution of morsitans group is limited by climatic (cold winter and hot dry) conditions and scarcity of game animals as well it is the most widespread group. However, palpalis group limited to very humid areas and fusca group limited to thickly forested areas. Tsetses are able to ind their hosts by their sense of smell and by sight. Tsetse ly importance is its ability of spreading trypanosomosis among domestic animals and man. For this reason, very large areas of Africa are without cattle which are prevented economic development these areas. Tsetse infested areas lie in the lowlands and also in the river valleys of Abay (Blue Nile), Baro, Akobo, Didessa, Ghibe, and Omo in Ethiopia. Five species of Glossina (G. morsitans submorsitans, G. pallidipes, G. tachinoides, G. fuscipes fuscipes and G. longipennis) have been recorded in Ethiopia [1,4,5].
In Yayo district there is a paucity of information on the trypanosomosis and tsetse lies. herefore, the aim of this study is to determine prevalence of bovine trypanosomosis and distribution of tsetse lies.
Me th o d s a n d Ma te ria ls
Study area, population and Sample size determination
he study was conducted from January to June, 2015 in Yayo district, Western Oromia, which is situated at 550km West of Addis Ababa in Ilu Aba Bora Zone. he mean annual rainfall in Yayo district ranges from 1000 to 1500 mm. he annual temperature ranges from 15 to 31°C. he altitude of the area ranges from 1,000 to 2060 meter above sea level (m.a.s.l). he Geba forest which is registered on the United Nations Educational, Scientiic, and Cultural Organization (UNESCO) for its natural habitats is located in the study area. he area has a number of wild animals, such as African bufaloes, Bush pigs, warthog, bush buck, kudu, hippopotamus, crocodiles, hyena, antelopes and snakes which are claimed to serve as sources of food for the vector of trypanosomes. he cattle in the district are local breeds that are kept under traditional extensive husbandry systems with communal herding. Agriculture is the main livelihood of the society with mixed farming system and livestock play an integral role for agriculture. Currently, at the time of study the livestock populations of district were 60,000 cattle, 30,120 Sheep, 35,120 Goat, 5,232 Donkey, 4,693 Horse, 2,722 Mule and 80,000 Poultry. Sample size was determined using 95% conidence level, 50% expected prevalence and 0.05 desired absolute precision using the formula described by hrusield [8]. herefore, a total of 408 cattle were randomly examined for bovine trypanosomosis to increase precision.
Study design and protocol
Yayo district was selected purposely based on the extent of the existing problems, the complaints of farmers and the level of medium to high tsetse challenge in the area from the report of the ield veterinarian in the district. A cross-sectional study design was engaged and three peasant associations were selected based on the veterinary reports of the trypanosomosis and tsetse infestation in the district. Cattle body condition score was categorized as good, medium and poor and their age was categorized as young (< 3 years old), adult (3 to 9 years old) and old (> 9 years old) according to Nicholson and Butterworth [9].
Sample collection
Bufy coat technique was used immediately as samples collected for the determination of bovine trypanosomosis prevalence. Blood sample collection was performed by piercing the marginal ear vein with a sterile lancet and blood was drawn by a heparinized capillary tube. hen one end (the heparinized end) of capillary tubes were sealed with crystal sealant and centrifuged at 12,000rpm for ive minutes to separate the blood cells and to concentrate trypanosomes using centrifugal forces. hen the packed cell volume (PCV) was determined by packed cell volume reader and recorded. he PCV value ≥ 25 and < 25 were considered as non-aneamic and aneamic, respectively. he capillary tubes were then broken just below bufy coat using diamond pencil and expressed on microscopic slide and covered with a cover slip. It was examined under 40× objective of microscope to identify and detect the presence of the parasites [10]. hose positive were thin smeared to be stain by geimsa staining for further identiication into species using their morphological characteristics under oil immersion microscope in laboratory.
Entomological survey
For the entomological survey a total of 45 monopyramidal baited traps were deployed in three PA’s of altitude ranges from 1237m - 1500m a.s.l. to assess the apparent density, distributions and species of tsetse lies and other biting lies involved in transmission of trypanosomosis. All traps were baited with acetone, Octenol (1-3-Octane) and cow urine illed in separated bottles and labeled and deployed at an interval of 200 to 250 m. Ater 72h of trap deployment, the cages were collected and captured lies were identiied and sexed according to morphological characteristics, and counted. he tsetse lies were identiied as species level and the other biting lies as the genus level. he apparent density was determined based on the mean catches of lies in traps deployed and expressed as the number of ly catch/trap/day [11].
Data management and analysis
Raw data were entered into a Microsot Excel spreadsheet and descriptive statistics were used to summarize the data. he prevalence was calculated for all data as the number of infected individuals divided by the number of individuals examined and multiplied by 100. he association between the prevalence of trypanosome infection and risk factors were assessed by chi-square, whereas the student’s t-test was used to assess the diference in mean PCV between trypanosome positive, negative and overall examined animals. All statistical analyses were conducted using SPSS version 20.0 sotware. he test result was considered signiicant when the calculated p-value was less than 0.05. he apparent density of ly population was calculated by dividing the number of lies caught by the number of traps deployed and the number of days of deployment and expressed as ly/trap/day (FTD).
Re s u lt
Trypanosomosis survey
morphologically species of trypanosomes. his study revealed that overall prevalence 7.4%, 95% CI: 5.1 - 10.0% with the highest rate of infection of T. congolonse (66.7%) than T.vivax 8(26.7%) and mixed infection 2(6.7%) and none of T. brucei were recorded and trypanosomosis highly infested Witete peasant association (9.7%) than the rest (Table 1, Table 2). Prevalence of trypanosomosis higher in female cattle 8%, 95% CI: 5.0 – 11.6% than male cattle 6%, 95% CI: 2.0 – 10.1%; old cattle 25%, 95% CI: 0.0 – 62.5% than adult cattle 7.5%, 95% CI: 5.1 – 10.2%; poor body condition score cattle 9.3%, 95% CI: 3.7 – 14.8% than good body condition score cattle 8%, 95% CI: 3.4 – 14.5% and medium body condition score 6.1%, 95% CI: 2.8 – 9.9%; Witete peasant association 9.7%, 95% CI: 4.9 – 15.1% than Gere peasant association 6.7%, 95% CI: 2.5 – 12.5% and Webo peasant association 5.6%, 95% CI: 2.1 – 9.2% and all of them were insigniicantly associated with the bovine trypanosomosis prevalence (Table 3).
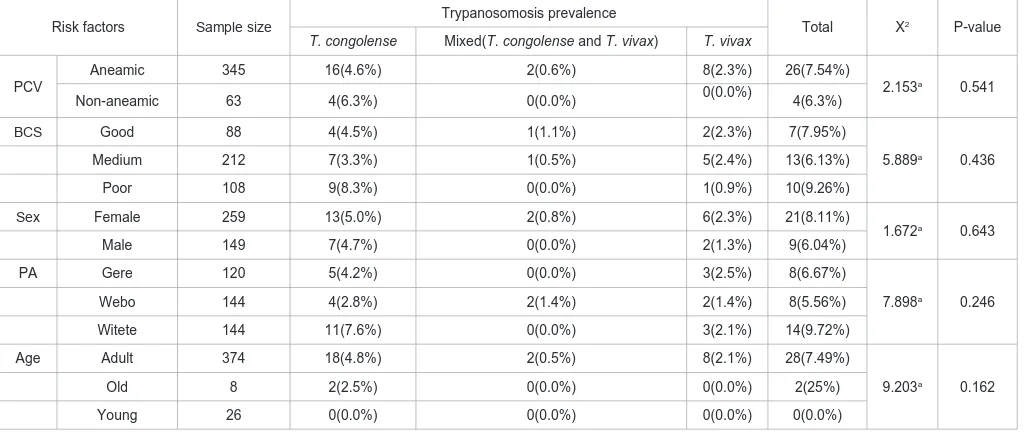
Bovine trypanosomosis prevalence was higher in aneamic 26(7.54%) than non-aneamic 4(6.3%) cattle; cattle of poor body condition score 10(9.26%) was harbored more infection of trypanosomosis than good 7(7.95%) and medium 13(6.13%) body condition scores cattle; female cattle 21(8.11%) was more exposed to trypanosomosis than male cattle 9(6.04%), Witete peasant association
14(9.72%) was with highest infection of trypanosomosis than Webo 8(5.56%) and Gere 8(6.67%) peasant association; old cattle 28(7.49%) ported more infection than adult 28(7.49%) and all the risk factors are insigniicantly associated with trypanosomosis prevalence (Table 5).
Heamatological survey good and poor body condition score cattle 20.51%, 95% CI: 19.59 – 21.43% and 20.68%, 95% CI: 19.96 – 21.41%, respectively (Table 4).
Entomological survey
his study incorporated 45 monopyramidal traps to assess apparent density of tsetse lies and other biting lies in the district. Species of Tsetse lies caught in the study areas were G. pallidipes and G. f. fuscipes with overall apparent density of 142.41 FTD. Other biting lies Tabanus, Stomoxys and Heamatopota were trapped during the study period. All monopyramidal traps were trapped within the range of 1237m 1500m altitude above sea level. Webo peasant association with the range of altitude 1237m 1257m were mostly infested with tsetse lies than other two peasant associations (Table 6).
D is cu s s io n
he current study reveals that overall prevalence 7.4% in the study area. Similar indings ranges from 6.7% to 8.7% were reported in Dale Wabera and Dale sedi districts of Kellem Wollega zone, in southwestern Ethiopia and Guto Gida district of East Wollega zone [12-14]. However, prevalence ranges from 13.6% to 16.9% higher than the present inding were reported in Humbo district of southern Ethiopia, Chora district of Ilu Aba Bora zone and Sayonole district of western Oromia [15-17]. Even though, from Dale Wabera district of Kellem Wollega zone reported lower prevalence (2.86%) of trypanosomosis [18]. hese diferences were due to ecological diferences and seasonal variations of study areas [19,20].
Species of trypanosomes predominant in the study area was T. congolonse (66.7%) followed by T. vivax 8(26.7%). his study agrees to previous report of Takile et al [14], Begna et al [15], Tola et al [16], Biyazen [18], Kassaye [17] and Kassaye and Tsegaye [12] that their prevalence ranges from 53.3% to 88.40%. Unlike to this inding T. vivax predominant in Cameroon and Nigeria [21,22]. his diference occurred because of geographical factors and G. pallidipes and G. m. sub-morsitans are eiciently transmits T. congolense than T. vivax in Eastern Africa. In addition, the predominance of T. congolense infection in cattle may be due to the high number of serodams of
PA’s Sample size Positive Prevalence[95%CI] Trypanosoma Species
Mixed T. congolence T. vivax T. brucei
Webo 144 8 5.6[2.1, 9.2] 2(1.4%) 4(2.8%) 2(1.4%) 0
Gere 120 8 6.7[2.5,12.5] 0 5(4.2%) 3(2.5%) 0
Witete 144 14 9.7[4.9,15.1] 0 11(7.6%) 3(2.1%) 0
Over all 408 30 7.4[5.1,10.0] 2(0.5%) 20(4.9%) 8(2%) 0
Table 1: Prevalence of Trypanosoma species with regard to PA’s.
PA= Peasant Association, CI= Conidence Interval, Mixed= T. congolence and T. vivax.
Trypanosomes species Prevalence
Risk factor Sample size Positive Prevalence[95%CI] P-value
Sex Male 149 9 6[2.0,10.1] 0.643
Table 3: Prevalence of trypanosomosis based on risk factor.
cattle as compared to T. vivax and development of better immune response to T. vivax by the infected animal [11].
he prevalence of trypanosomosis was higher in the female cattle 8%, 95% CI: 5.0 – 11.6%, old 25%, 95% CI: 0.0 – 62.5%, cattle of poor body condition score 9.3%, 95% CI: 3.70 – 14.8% and Witete peasant association 9.7%, 95% CI: 4.9 – 15.1% than rest of factors and insigniicantly associated (P > 0.05) to the prevalence of trypanosomosis. Similar with earlier report of Takile et al [14] in Guto Gida district female (8.37%), Poor (19.67%) and old (9.21%), Tola et al [16] in Chora district female (9.2%) and poor (5.2%), Kassaye [17] in Sayonole district poor (19.7%) and Kassaye and
Tsegaye [12] in Dale sedi and Wabera Poor (15%). In contrary to this, Biyazen [18] and Kassaye and Tsegaye [12] determined male cattle harbor more infection than female cattle in Dale Wabera district male cattle (3.64%) and Dale sedi and Wabera district male cattle (10.7%), respectively. his could be due to female cattle were kept for purpose of rearing or giving ofspring and milking for a long period of time and in numbers than male cattle used for ploughing purpose that lead in the continuous exposure of tsetse lies infestation. Old cattle stayed in the areas for long time that increases their exposure to the tsetse lies, but poor body condition score cattle deprived immunity to ight against infection of trypanosomosis.
Risk factors Sample size Mean PCV 95%CI Std.dev. df P-value t-value
Trypanosomes infection
Infected 30 17.767 [15.96,19.58] 4.847 29
0.00
20.076
Non-infected 378 20.542 [20.14,20.95] 3.982 377 100.299
Sex
Male 259 20.274 [19.78,20.77] 4.012 258
0.00
81.319
Female 149 20.450 [19.76,21.14] 4.285 148 58.261
Body Condition scores
Poor 108 20.685 [19.96,21.41] 3.825 107
0.00
56.204
Medium 212 20.090 [19.53,20.65] 4.156 211 70.374
Good 88 20.511 [19.59,21.43] 4.334 87 44.399
Table 4: Association of PCV with the factors.
PCV = Packed Cell Volume; CI = Conidence Interval; Std.dev. = Standard deviation; df = Degree of freedom.
Risk factors Sample size Trypanosomosis prevalence Total X2 P-value
T. congolense Mixed(T. congolense and T. vivax) T. vivax
PCV
Aneamic 345 16(4.6%) 2(0.6%) 8(2.3%) 26(7.54%)
2.153a 0.541
Non-aneamic 63 4(6.3%) 0(0.0%) 0(0.0%) 4(6.3%)
BCS Good 88 4(4.5%) 1(1.1%) 2(2.3%) 7(7.95%)
5.889a 0.436
Medium 212 7(3.3%) 1(0.5%) 5(2.4%) 13(6.13%)
Poor 108 9(8.3%) 0(0.0%) 1(0.9%) 10(9.26%)
Sex Female 259 13(5.0%) 2(0.8%) 6(2.3%) 21(8.11%)
1.672a 0.643
Male 149 7(4.7%) 0(0.0%) 2(1.3%) 9(6.04%)
PA Gere 120 5(4.2%) 0(0.0%) 3(2.5%) 8(6.67%)
7.898a 0.246
Webo 144 4(2.8%) 2(1.4%) 2(1.4%) 8(5.56%)
Witete 144 11(7.6%) 0(0.0%) 3(2.1%) 14(9.72%)
Age Adult 374 18(4.8%) 2(0.5%) 8(2.1%) 28(7.49%)
9.203a 0.162
Old 8 2(2.5%) 0(0.0%) 0(0.0%) 2(25%)
Young 26 0(0.0%) 0(0.0%) 0(0.0%) 0(0.0%)
Table 5: Association of trypanosomosis prevalence with risk factors.
PCV = Packed Cell Volume; X2= Chi-square; BCS= Body Condition Score; PA= Peasant Association; Aneamic = PCV < 25; Non-aneamic= PCV ≥ 25.
PA’s Altitude No. of trap No. of days G. pallidipes G. f. fuscipes Total FTD Tabanus Stomoxys Heamatopota
Webo 1237-1257m 15 3 56,533 96 56,629 1258.42 3 216 95
Gere 1372-1500m 15 3 100 92 192 4.26667 1 114 20
Witete 1300-1498m 15 3 566 289 855 19 2 204 119
District 45 9 57,199 477 57,676 142.41 6 534 234
Table 6: Apparent densities of tsetse lies and other biting lies caught in three peasant associations.
Mean of packed cell volume (PCV) varies among risk factors. Trypanosomes infected cattle mean PCV 17.767%, 95% CI: 15.96 – 19.58% lower than non-infected cattle mean PCV 20.542%, 95% CI: 20.14 – 20. 95%. his could be due to aneamic nature of trypanosomosis and malnutrition. Mean PCV of male 20.274%, 95% CI: 19.78 – 20.77% lower than female cattle mean PCV 20.450%, 95% CI: 19.76 – 21.14%; medium body condition score PCV 20.090%, 95% CI: 19.53 – 20.65% lower than poor and good body condition score cattle 20.685%, 95% CI; 19.96 – 21.41% and 20.511%, 95% CI: 19.59 – 21.43%, respectively and all risk factors statistically associated (P < 0.05) with PCV. Analogous to the previous report of Takile et al [14] in Guto Gida (20.23%) district, Begna et al [15] in Humbo (20.2%) district, Tola et al [16] in Chora (19.02%) district, Kassaye [17] in Sayonole (20.86%) district, Kassaye and Tsegaye [12] in Dale Wabera (20.9%) and Dale sedi (20.3%) districts and [23] in western Oromia (22.88%). Diference in aneamia status in trypanosome infected cattle was probably due to discrepancy in ecology [20], nutritional status [24], animal breed [25], season of the study [19], tsetse control and trypanocidal drug utilization level [26] and/or diagnostic method employed [27,28].
Monopyramidal type of traps 45 in number was deployed in three peasant associations of Yayo district. hese traps were trapped G. pallidipes and G. f. fuscipes with their overall apparent density of 142.41 lies/ traps/ days and other biting lies Tabanus, Stomoxys and Heamatopota within the range of 1237m - 1500m altitude above sea levels [29]. Hence, G. pallidipes was predominantly with the apparent density 141.23 lies/ traps/ days in the district. Other study reported apparent density in Dale Wabera and Dale sedi (4.8 lies/traps/days) districts [12], Sayonole (13.01 lies/trap/days) district [17] and Chora (2.63 lies/ traps/days) district [16] which is lower than the current study. Hence, in Abaya district apparent density of G. pallidipes 0.5 lies/traps/days was the predominant in the district, but this apparent density is lower than the current study G. pallidipes apparent density. Generally, this indicates that higher rate of tsetse lies infestation in the district which is more responsible for the trypanosomosis transmission.
Co n clu s io n a n d Re co m m e n d a tio n
Current study revealed that highest apparent density of tsetse lies that transmit trypanosomosis infection to cattle which severely harm production and productivity of livestock in the district. In the study area T. congolense and G. pallidipes were predominantly occurred in the study area. Hence, the apparent density of tsetse lies in the district was abundant than other areas with similar geography. Female, old and poor cattle were incredible infected by trypanosomes species and those infected, medium body condition score and male cattle possessed a lower mean packed cell volume. Based on this the following recommendations are forwarded:
•
Tsetse lies control techniques should be implemented.•
Chemotherapeutics and prophylactics techniques should be undertaken.References
1. NTTICC. National Tsetse and Trypanosomosis Investigation and Control Center: (NTTICC), Annual Report, Bedelle, Ethiopia. 2004.
2. Enwezor FNC, Umoh JV, Esievo KAN, Anere JJ. Prevalence of trypanosomes
in sheep and goats in the kachia grazing Reserve of Kaduna state, North
West Nigeria. Bull. Anim. Health Prod. Afr. 2006; 54: 306–308.
3. CSA (Central Statistical Authority). Livestock Population of Ethiopia Central
Statistical Authority (CSA), Addis Ababa, Ethiopia. 2005.
4. Uilenberg G. A ield guide for the diagnosis, treatment and prevention of African animal trypanosomosis. Food and Agriculture Organization of the United Nations, Rome. 1998; 5.
5. Langridge WP. Tsetse and Trypanosomosis survey of Ethiopia. Ministry of
overseas Department, UK. 1976.
6. Abebe G, Jobre Y. Trypanosomosis: A threat to cattle production in Ethiopia. Rev Med Vet. 1996; 147: 897- 902.
7. Pollock JN. Tsetse Biology, Systematic and Distribution; Techniques. Training Manual for Tsetse Control Personnel. Volume 1. Food and Agriculture Organization of the United Nations, Rome. 1982.
8. Thrusield M. Veterinary Epidemiology, (2nd Edn) Blackwell Science Ltd, UK.
1995: 182-198.
9. Nicholson MJ, Butterworth MH. A Guide to condition scoring of Zebu cattle.
International Livestock centre for Africa, Addis Ababa, Ethiopia. 1986. 28pp.
10. Murray M, Trial TCM, Stephen LE. Livestock productivity and trypanosomosis,
ILCA, Addis Ababa, Ethiopia. 1977.
11. Leak SGA. Tsetse Biology and Ecology: Their role in the Epidemiology of Trypanosomosis. CAB International, Nairobi, Kenya. 1999: 568.
12. Kassaye BK, Tsegaye D. Prevalence of Bovine Trypanosomosis, Tsetse Density and Farmers Perceptions on the Impact of Control Program in Kellem
Wollega Zone, Western Oromia, Ethiopia. J Veterinar Sci Technol. 2016; 7:
295.
13. Duguma R, Tasew S, Olani A, et al. Spatial distribution of Glossina species and Trypanosoma species in south-western Ethiopia. Parasites & Vectors. 2015; 8: 430.
14. Takile D, Deresa B and Abdurahaman M. Prevalence of Bovine Trypanasomosis in Guto Gida District of East Wollega Zone, Oromia Regional
State, Ethiopia. Global Journal of Medical Research: GVeterinary Science and Veterinary Medicine. Publisher: Global Journals Inc (USA). 2014; 14.
15. Begna F, Abebe S and Bekele M. Bovine Trypanosomosis in Selected
Villages of Humbo District, Southern Ethiopia. Global Veterinaria. 2011; 7:
192-198.
16. Tola M, Kebede B, Kitila G and Gezehegn E. Prevalence of bovine trypanosomosis and its vector apparent density in Chora District of Illuababora
Western Oromia, Ethiopia. Journal of Veterinary Medicine and Animal Health.
2016; 8: 64-71.
17. Kassaye BK. Prevalence of Bovine Trypanosomosis and Apparent Density of
Tsetse Flies in Sayonole District Western Oromia, Ethiopia. J Veterinar Sci
Technol. 2015; 6: 254.
18. Biyazen H, Duguma R and Asaye M. Trypanosomosis, Its Risk Factors, and
Anaemia in Cattle Population of Dale Wabera District of Kellem Wollega
Zone, Western Ethiopia. Journal of Veterinary Medicine. Hindawi Publishing
Corporation. 2014.
19. Cherinet T, Sani R A, Speybroeck N, et al. A comparative longitudinal study of bovine trypanosomiasis in tsetse-free and tsetse-infested zones of the Amhara Region, northwest Ethiopia. Vet Parasitol. 2006; 140: 251-258.
20. Mamoudou A, Zoli A, Mbahin, et al. Prevalence and incidence of bovine trypanosomosis on the Adamaoua plateau in Cameroon 10 years after the tsetse eradication campaign. Vet Parasitol. 2006; 142: 16-22.
21. Nimpaye H, Njiokou F, Njine T, et al. Trypanosoma Vivax, T. Congolense
“Forest Type” And T. Simiae: Prevalence in Domestic Animals of Sleeping Sickness Foci of Cameroon. Parasite. 2011; 18: 171-179.
22. Fajinmi AO, Faaleke OO, Magaji AA, et al. Presence of trypanosomes
species and Determination of Aneamia in trade Cattle at Sokoto Abattoir,
23. Tasew S and Duguma R. Cattle anaemia and trypanosomiasis in western
Oromia State, Ethiopia. Revue Méd Vét. 2012; 163: 581-588.
24. Katunguka-Rwakishaya E, Murray M, Holme PH. The inluence of energy
intake on some blood biochemical parameters in Scottish Blackface sheep
infected with Trypanosoma congolense. Vet Parasitol. 1999; 84: 1-11.
25. Akinbamijo OO, Bennison JJ, Jaitner J, Demple L. Haematological changes
in N’Dama and Gobra Zebu bulls during Trypanosoma congolense infection maintained under a controlled feeding regimen. Acta Trop. 1998; 69: 181-192.
26. Miruk A, Hagos A, Yacob HT, Asnake F, Basu AK. Prevalence of bovine trypanosomosis and trypanocidal drug sensitivity studies on Trypanosoma
congolense in Wolyta and Dawero zones of southern Ethiopia. Vet Parasitol.
2008; 152: 141-147.
27. Bossard G, Boulange A, Holzmuller P, et al. Serodiagnosis of bovine
trypanosomosis based on HSP70/BiP inhibition ELISA. Vet Parasitol. 2010;
173: 39- 47.
28. Ijaz MK, Nur-E-Kamal MSA, Mohamed AIA, Darf K. Comparative studies on
the sensitivity of polymerase chain reaction and microscopic examination for the detection of Trypanosoma evansi in experimentally infected mice. Comp
Immunol Microbiol Infect Dis. 1998; 21: 215-223.
29. Dawit A, Alemayew T, Bekele K, et al. Prevalence of Bovine Trypanosomosis, and its Associated Risk Factors in Abaya District, Borena Zone, Ethiopia.
Nature and Science. 2015; 13.
Citation: Kitila G, Kebede B, Guta D, Bekele F, Wagari M, Tilahun B, et al. Epidemiological Investigation of Bovine Trypanosomosis and Its Vector Apparent Densities in Yayo District Illuababora Zone, Western Oromia, Ethiopia. Austin J Vet Sci & Anim Husb. 2017; 4(1): 1031.