Summary Effects of needle water potential (Ψl) on gas
ex-change of Scots pine (Pinus sylvestris L.) grown for 4 years in open-top chambers with elevated temperature (ET), elevated CO2 (EC) or a combination of elevated temperature and CO2
(EC + ET) were examined at a high photon flux density (PPFD), saturated leaf to air water vapor pressure deficit (VPD) and optimal temperature (T). We used the Farquhar model of photosynthesis to estimate the separate effects of Ψl and the
treatments on maximum carboxylation efficiency (Vc,max),
ribu-lose-1,5-bisphosphate regeneration capacity (J), rate of respi-ration in the light (Rd), intercellular partial pressure of CO2 (Ci)
and stomatal conductance (Gs).
Depression of CO2 assimilation rate at low Ψl was the result
of both stomatal and non-stomatal limitations on photosyn-thetic processes; however, stomatal limitations dominated during short-term water stress (Ψl < −1.2 MPa), whereas
non-stomatal limitations dominated during severe water stress. Among the nonstomatal components, the decrease in J contrib-uted more to the decline in photosynthesis than the decrease in
Vc,max.
Long-term elevation of CO2 and temperature led to
differ-ences in the maximum values of the parameters, the threshold values of Ψl and the sensitivity of the parameters to decreasing
Ψl. The CO2 treatment decreased the maximum values of Vc,max, J and Rd but significantly increased the sensitivity of Vc,max, J and Rd to decreasing Ψl (P < 0.05). The effects of the
ET and EC + ET treatments on Vc,max, J and Rd were opposite
to the effects of the EC treatment on these parameters. The values of Gs, which were measured simultaneously with
maxi-mum net rate of assimilation (Amax), declined in a curvilinear
fashion as Ψl decreased. Both the EC + ET and ET treatments
significantly decreased the sensitivity of Gs to decreasing Ψl.
We conclude that, in the future, acclimation to increased at-mospheric CO2 and temperature could increase the tolerance
of Scots pine to water stress.
Keywords: carboxylation efficiency, intercellular CO2 concen-tration, open-top chamber, respiration, ribulose-1,5-bisphos-phate, stomatal conductance.
Introduction
A reduction in the net rate of CO2 assimilation with decreasing
leaf water potential has been observed in many plants (Hsiao and Acevedo 1974, Tolley and Strain 1985, Eastman and Camm 1995). As water stress develops, plants normally exhibit parallel decreases in CO2 fixation and stomatal conductance.
This pattern of response has led to the suggestion that most of the reduction in CO2 assimilation rate in response to water
stress is attributable to stomatal closure (Troughton and Slatyer 1969, Moldau 1973, Beadle et al. 1981), which results in decreased CO2 diffusion into the leaf.
However, several studies have shown that the intrinsic photo-synthetic capacity of the leaf is also affected by decreasing leaf water potential (Boyer 1971, Farquhar and Sharkey 1982, Sharkey and Badger 1982, Hutmacher and Krieg 1983, Mat-thews and Boyer 1984, Teskey et al. 1986). Furthermore, in water-stressed Phaseolus vulgaris L., changes in the initial slope of the response of CO2 assimilation rate to intercellular
CO2 partial pressure paralleled those of in vitro Rubisco
activ-ity (von Caemmerer and Farquhar 1984). There is also evi-dence that the relative decreases in stomatal conductance and intrinsic photosynthetic capacities vary depending on species and pretreatment (Hsiao and Acevedo 1974, Ludlow 1980).
Based on these observations, we postulated that the decrease in photosynthesis resulting from stomatal closure can be over-come by increasing the ambient partial pressure of CO2,
whereas the decrease in intrinsic photosynthetic capacity can-not be offset by elevated CO2 (Matthews and Boyer 1984).
Because long-term CO2 and temperature elevations lead to
changes in photosynthetic performance of Scots pine (Wang et al. 1995, 1996), we also postulated that these changes will be reflected in the responses of photosynthesis to water stress. For example, water-stressed loblolly pine (Pinus taeda L.) seed-lings grown in elevated CO2 can maintain higher
photosyn-thetic capacity as a result of higher plant water potentials over most of the drought period than seedlings grown at ambient atmospheric CO2 (Tolley and Strain 1985).
To test the two hypotheses, we investigated the response of photosynthetic performance of Scots pine (Pinus sylvestris L.)
Photosynthetic responses to needle water potentials in Scots pine after
a four-year exposure to elevated CO
2
and temperature
SEPPO KELLOMÄKI and KAI-YUN WANG
University of Joensuu, Faculty of Forestry, P.O.Box 111, FIN-80101 Joensuu, Finland
Received July 10, 1995
to changes in needle water potential after a 4-year exposure to elevated CO2 and temperature. Simultaneous measurements of
photosynthesis, stomatal conductance and needle water poten-tial were conducted on current-year shoots during the summer of 1994.
Materials and methods
Plant material and growth conditions
Details of the study site and experimental design have been described by Wang et al. (1995, 1996). Briefly, the experiment was established in a naturally regenerated stand of Scots pine close to the Mekrijärvi Research Station (62°47′ N, 30°58′ E, 145 m a.s.l.), University of Joensuu, Finland. The mean density of the pure Scots pine stand was about 2500 stems per hectare. The trees were 20--25 years old and had a mean height of 2--3 m. Mean annual temperature and rainfall at the site are 2.0 °C and 600 mm, respectively.
The experiment consisted of 16 chambers, each 2.5 × 2.5 × 3.5 m in size. The south and west walls of the chambers were constructed of heating glass (1120 W), and the north and east walls were made of greenhouse plastic. Five parallel shutters were constructed on top of each chamber. During sunny weather in spring and summer, the shutters were opened to avoid excess heating of the trees. During winter, snow was shovelled into the chambers with closed shutters to keep pre-cipitation similar to that in chambers with open shutters.
Four chambers were assigned to each of the four treatments: (i) ambient temperature and CO2 concentration (Control), (ii)
elevated temperature (ET), (iii) elevated concentration of CO2
(EC), and (iv) elevated CO2 concentration and temperature
(EC + ET).
The CO2 concentration inside the EC chambers was
in-creased to 55--60 Pa for the entire growing season (April 15 to September 15) in the previous four years by injecting pure CO2
into the chambers where it was mixed by a fan. The chamber CO2 concentration was monitored and controlled by means of
a CO2 controller (Model M52080-A74-A, Siemens,
Ger-many).
The temperature in the ET chambers was elevated through-out the year. The temperature in the chambers was controlled and monitored by a computerized temperature controller (Me-Platin-Elektroniikka, Helsinki, Finland). During winter (Sep-tember 15 to April 15) and summer (April 15 to Sep(Sep-tember 15), the mean temperature was 5--20 and 2 °C above the outside ambient temperature, respectively.
Measurements of gas exchange and needle water potential
Measurements of CO2 exchange in a diffuse radiation field
were conducted with an automatic open gas exchange system as described by Wang (1996). The core of the system consisted of six components. (1) An integrating sphere of radius 0.5 m, with the inner surface painted with BaSO4 (Nonaka 1974), and
a sectoral disc of 26 cm in diameter placed below the path of the light to improve scattering of radiation on entry into the sphere. (2) A water-cooled, ventilated Plexiglas assimilation cuvette in which a photosynthetically active radiation sensor
(LI-190SR, Li-Cor Inc., Lincoln, NE), an air temperature sen-sor (0.2 mm copper-constantan thermocouples) and two pad-dle fans were mounted. (3) Two open-path IRGAs (URAS 3G, Hartman and Braunn A6, Germany) for measuring CO2 and
H2O concentrations of the air entering and leaving the cuvette.
The IRGA for measuring CO2 was fitted with water-vapor
interference filters. In addition, the air was passed through an ice-trap and dried by passage through a column filled with anhydrous Mg(ClO4)2 before entering the analyzer. (4) Four
mass flow meters (Brooks Model 5850TR, Emerson Electric Co., USA) were used to control humidity and CO2
concentra-tion. Humidity was controlled by balancing the total supply of dehumidified dry air against the production of water vapor by a water-vapor generator. Alteration of the relative flow rates of CO2-free air and pure CO2 gas from a CO2 cylinder was used
to control the partial pressure of CO2 in the air entering the
cuvette. (5) Light was provided by a profile spot projector (Model HMV 1200 s, Ludwig Pani Ltd, Austria) equipped with a 1200 W metallogen lamp and neutral filters. (6) The system was connected to a computer that was programed to provide automatic adjustment of the measurement parameters, calcula-tions of the gas-exchange parameters, graphic display of the results, and data logging.
Current-year shoots with fully developed needles at the second whorl from the stem apex were excised under water and transported to the laboratory. After the shoot was recut under water, a 10-cm length with only 30 needle fascicles (surplus needles having been removed over the length of the shoot a week before to minimize differences in shoot structure) was sealed in an assimilation cuvette. Measurements were con-ducted at midday, when leaf water potentials were most nega-tive, at partial pressures of CO2 from 2 to 140 Pa.
The measurements were begun at a low CO2 partial pressure,
which was then increased in steps, allowing sufficient time (40 to 50 min) for steady-state rates of gas exchange to be attained after each change in CO2 partial pressure. During
measure-ments, the air temperature in the assimilation cuvette was kept at 18 ± 0.4 °C (optimal temperature for photosynthesis in Scots pine), the partial pressure of CO2 entering the cuvette was
maintained within ± 0.4 Pa for all of the measurement CO2
concentrations, and the water vapor pressure deficit was main-tained below 0.5 kPa.
Before each measurement of photosynthesis, needle water potentials (Ψl) were measured with a pressure chamber (Pohja,
Juupajoki, Finland). Five fascicles were sampled from each tree and stored in test tubes in an ice-box until measured within 2 h of harvesting (Myers and Craig 1988).
The model of Farquhar and von Caemmerer (1982) was used to determine maximum carboxylation rate (Vc,max),
ribu-lose-1,5-bisphosphate-(RuP2) regeneration capacity (J),
respi-ration rate in the light (Rd), stomatal conductance to CO2 (Gs)
and intercellular partial pressure of CO2 (Ci) at specific water
potentials. An exponential function was used to fit the relation-ship between each physiological parameter and needle water potential. Finally, a path-dependent method presented by Jones (1973, 1985) was applied to estimate the stomatal (Ls) and
Gas exchange parameters were calculated according to the method of von Caemmerer and Farquhar (1981). The rate of net photosynthesis was based on the projected area of needles, which was measured with an LI-3100 leaf-area meter (Li-Cor Inc., Lincoln, NE).
Results
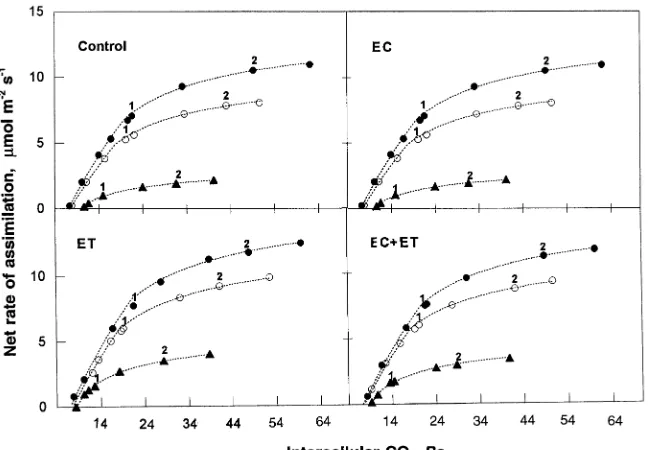
Effect of Ψl on the relationship between net rate of assimilation (An) and Ci
The effect of Ψl on the relationship between net rate of
assimi-lation (An ) and Ci was measured under conditions of high
PPFD (1500 µmol m−2 s−1), low leaf to air water vapor
pres-sure deficit (< 0.4 kPa), and optimal leaf temperature (18 °C). Regardless of treatment, when Ψl declined from −0.4 to −1.0
MPa, An declined significantly at high values of Ci (P < 0.05)
but declined only marginally at low values of Ci (Figure 1).
However, when Ψl was −1.8 MPa, An at both high and low Ci
decreased significantly (P < 0.01). The values of Ci obtained at
an external CO2 partial pressure of 35 Pa decreased as water
stress intensified, but always remained higher than the values at the transition point (TP) between ‘‘RuP2-carboxylase
limita-tion’’ and ‘‘RuP2-regeneration limitation.’’ As water stress
pro-gressesed, both Ci and TP decreased simultaneously.
There were clear differences in An between treatments at the
same intensity of water stress (Table 1). When measurements were made at an external CO2 partial pressure of 35 Pa and
values of Ψl between −1.6 and −1.8 MPa, the EC treatment
significantly decreased An, whereas the ET and EC + ET
treatments significantly increased An. However, when
meas-ured at an external CO2 partial pressure of 70 Pa, the ET and
EC + ET treatment significantly increased An at all values of
Ψl, whereas the EC treatment decreased An only at Ψl values
between −1.6 and −1.8 MPa.
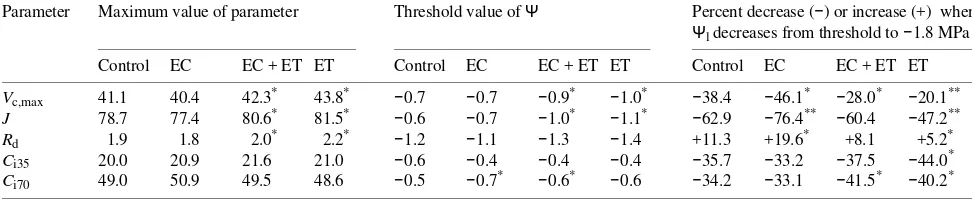
Dependence of Vc,max, J and Rd on Ψl
To explore the effect of water stress on the intrinsic photosyn-thetic components, the main physiological parameters in-volved in photosynthesis were estimated at different values of Ψl by the set of simplified equations (Equations 1--3) presented
by Farquhar and von Caemmerer (1982); i.e., under a given set of environmental conditions, the net assimilation rate (An) was
assumed to be either the predicted carboxylation velocity-lim-ited rate (A1), or the predicted RuP2-regeneration-limited rate
of photosynthesis (A2), whichever was lower at a particular Ci,
An= min A1, A2
, (1)
A1=Vc,max
CiKo−0.105OiKc
KcOi+KcKo+KoCi
−Rd, (2)
A2=J
KoCi−0.105KcOi
4.5KoCi+ 1.1025KcOi
−Rd, (3)
where Oi is intercellular concentration of O2 (21 kPa), and Kc
and Ko are Michaelis constants for CO2 and O2, respectively.
Thus, an effect of water stress on An was assumed as water
stress induced changes in Gs, Vc,max, J, Ci or Rd (Beadle and
Jarvis 1977, Sharkey and Badger 1982, Farquhar and Sharkey 1982, von Caemmerer and Farquhar 1984, Comstock and Ehleringer, 1984, Briggs et al. 1986). An exponential function fitted the dependence of the parameters on Ψl; i.e.,
Parameters (Vc,max, J, Ci,Gs)=Kmax/1 +(Ψl/Kt)−Ks (4)
Rd=Kmax1 +(Ψl/Kt)−Ks, (5)
Figure 1. Dependence of net assimilation (An, µmol m−2 s−1) on intercellular par-tial pressure of CO2 (Ci, Pa) at three dif-ferent values of needle water potential (−0.4 MPa (d), −1.0 MPa (s) and −1.8
MPa (m)) for four treatments (Control,
where Kmax is the value of the parameter under well-watered
conditions, Kt is a coefficient related to the threshold value of
Ψl and Ks is a coefficient related to the sensitivity of the
parameter to decreasing Ψl.
To determine Vc,max and Rd (initial linear portions in
Fig-ure 1), we used the values determined by Badger and Collatz (1977) for Kc (25.49 Pa) and Ko (23.12 kPa) at 18 °C, to fit
Equation 2 to the data collected over the range of 10 to 20 Pa Ci. Equation 3 was fitted to the data collected at Ci values
greater than 20 Pa to obtain estimates of J (plane portions in Figure 1). Plots of Vc,max, J, Rd and Ci versus Ψl revealed three
main findings (Figures 2--5).
First, the three parameters, Vc,max, J and Rd, responded
dif-ferently to a particular intensity of water stress. For a given treatment, Rd was more or less constant at Ψl values less than
−1.2 MPa, and J was more sensitive to decreasing Ψl than Vc,max and Rd. Consequently, among the three parametes, J
exhibited the greatest rate of decline with decreasing Ψl.
Sec-ond, different treatments led to differences in maximum values of parameters, in threshold values of Ψl and in the sensitivity
Table 1 Net assimilation rate (An) and intercellular partial pressure of CO2 (Ci) as functions of needle water potential (Ψl) and external partial pressure of CO2. Measurements were made at a leaf temperature of 18 ± 0.5 °C, PPFD of 1500 µmol m−2 s−1 and VPD of < 0.4 kPa. Each value is the mean of four replicates. An asterisk indicates a significant difference at P < 0.05 (3-way ANOVA applied to An and Ci, in which EC, EC + ET and ET were the independent variables).
Ψl (MPa) 35 Pa CO2 70 Pa CO2
Control EC EC + ET ET Control EC EC + ET ET
An(µmol m−2 s−1) --0.3 to 0.5 7.3 7.2 7.9 8.2 10.8 10.5 11.2* 11.8*
--0.9 to 1.1 5.5 5.0 5.9 5.7 8.4 7.8 9.1* 9.2*
--1.6 to 1.8 1.3 1.1* 1.7* 1.6* 2.7 1.9* 3.0* 3.2*
Ci(Pa) --0.3 to 0.5 19.9 20.9 21.3 20.8 49.1 50.8 49.2 48.3
--0.9 to 1.1 17.6 17.5 18.0 17.1 42.9 43.5 42.4 41.5
--1.6 to 1.8 12.7 13.5* 13.1 11.4* 30.4 31.3 28.6* 27.8*
Figure 2. The RuP2-saturated rate of carboxylation (Vc,max, µmol m−2
s−1) as a function of needle water potential (Ψl) and treatments. Values of Vc,max were estimated from plots of Ci versus assimilation rate (cf. Figure 1). Equations of the regression lines for the treatments are: Control: Vc,max = 41.10/[1 + (Ψl/2.78)−2.04] (R2 = 0.745, P < 0.005)
EC: Vc,max = 40.39/[1 + (Ψl /2.89)−1.82] (R2 = 0.824, P < 0.005) EC + ET: Vc,max = 42.20/[1 + (Ψl/3.04)−2.31] (R2 = 0.769, P < 0.005) ET: Vc,max = 43.70/[1 + (Ψl/2.67)−2.79] (R2 = 0.861, P < 0.001).
Figure 4. Rate of day respiration (Rd, µmol m−2 s−1) as a function of needle water potential (Ψl) and treatments. Values of Rd were esti-mated from plots of Ci versus assimilation rate (cf. Figure 1). Equa-tions of the regression lines for the treatments are:
Control: Rd = 1.93 [1 + (Ψl/6.07)−2.53] (R2 = 0.902, P < 0.001) EC: Rd = 1.82 [1 + (Ψl/5.17)−2.44] (R2 = 0.864, P < 0.005) EC+T: Rd = 2.04 [1 + (Ψl/6.28)−2.63] (R2 = 0.788, P < 0.005) ET: Rd = 2.15 [1 + (Ψl/6.65)−2.72] (R2 = 0.921, P < 0.001).
Figure 3. Potential electron transport (J, µmol m−2 s−1) at an incident photon flux density of 1500 µmol m−2 s−1 as a function of needle water potential (Ψl) and treatments. Values of J were estimated from plots of Ci versus assimilation rate (cf. Figure 1). Equations of the regression lines for the treatments are:
of parameters to decreasing Ψl (Table 2). Elevated CO2
de-creased the maximum values of Vc,max, J and Rd but
signifi-cantly increased the sensitivity of Vc,max, J and Rd to decreasing
Ψl (P < 0.05). The effects of treatments ET and EC + ET on Vc,max, J and Rd were the opposite of those of treatment EC.
Third, there were no significant differences in maximum val-ues of Ci between treatments at Ψl values above −1.0 MPa, but
at Ψl = −1.8 MPa, the EC and ET treatments had a significant
effect on the maximum values of Ci (Figure 5 and Table 1).
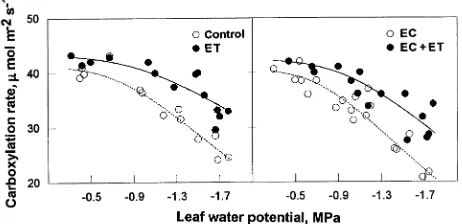
Stomatal conductance (Gs) and its limitations (Ls)
Independently of the treatments, values of Gs measured
simul-taneously with An declined in a curvilinear fashion with
de-creasing Ψl (Figure 6); however, the ET and EC + ET
treatments significantly decreased the sensitivity of Gs to
de-creasing Ψl. A comparison of shoots grown and measured at a
CO2 partial pressure of 35 Pa with shoots grown and measured
at a CO2 partial pressure of 70 Pa revealed that the EC and EC
+ ET treatments significantly decreased maximum Gs by 21.6
and 19.4%, respectively at Ψl < −0.6 MPa; however, the
de-crease was less at higher values of Ψl. The ET treatment had
no significant effect on maximum Gs.
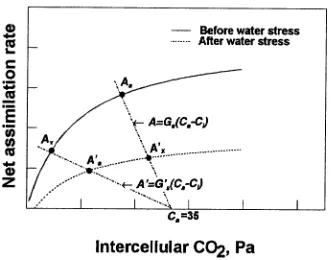
The stomatal (Ls) and non-stomatal (Ln) limitations on
carb-on assimilaticarb-on were estimated by a simplified path-dependent method (Jones 1973, 1985), as illustrated in Figure 7. Based on response curves of An versus Ci, measured at Ψl values of −0.4,
−1.0 and −1.8 MPa (e.g., Figure 1), Ls and Ln were calculated
for each treatment at an ambient partial pressure of 35 Pa (Ca)
(Table 3).
The values of Ls and Ln differed depending on whether the
stomatal path or the mesophyll path was assumed to limit assimilation first. When stomatal limitation was assumed to limit photosynthesis first, Ls was always higher than Ln, and the
EC and ET treatments had a significant effect on Ln (P < 0.05)
as Ψl decreased from −0.4 to −1.8 MPa. When mesophyll
limitation was assumed to limit photosynthesis first, Ls was
only higher than Ln when Ψl declined from −0.4 to −1.0 MPa,
whereas Ls was less than Ln when Ψl declined from −0.4 to
−1.8 MPa, and the EC and ET treatments had a significant effect on both Ls and Ln (Table 3).
Figure 5. Intercellular partial pressure of CO2 (Ci, Pa) at ambient partial pressure of CO2 (Ca) as a function of needle water potential (Ψl) and treatments. Values of Ci were estimated from plots of Ci versus assimilation rate (cf. Figure 1). Measurements were made at
Ca = 35 Pa for the control and ET treatment and at Ca = 70 Pa for the EC and EC + ET treatments. Equations of the regression lines for the treatments are:
Control: Ci = 215/[1 + (Ψl/2.06)−2.23] (R2 = 0.746, P < 0.005) EC: Ci = 495/[1 + (Ψl/2.45)−2.25] (R2 = 0.814, P < 0.004) EC+T: Ci = 510/[1 + (Ψl/2.19)−1.95] (R2 = 0.739, P < 0.003) ET: Ci = 210/[1 + (Ψl/1.76)−2.51] (R2 = 0.747, P < 0.005).
Table 2 Effects of needle water potential on photosynthetic parameters, Vc,max (µmol m−2 s−1), J (µmol m−2 s−1), Rd (µmol m−2 s−1) and Ci (Pa).
Each value is the mean of four replicates. Symbols Ci35 and Ci70 denote the Ci values obtained at external CO2 partial pressures of 35 and 70 Pa, respectively. The single and double asterisks indicate significant differences at P < 0.05 and P < 0.01, respectively (3-way ANOVA applied to
Vc,max, J, Rd and Ci, in which EC, EC + ET and ET were the independent variables).
Parameter Maximum value of parameter Threshold value of Ψ Percent decrease (−) or increase (+) when
Ψl decreases from threshold to −1.8 MPa
Control EC EC + ET ET Control EC EC + ET ET Control EC EC + ET ET
Vc,max 41.1 40.4 42.3* 43.8* −0.7 −0.7 −0.9* −1.0* −38.4 −46.1* −28.0* −20.1**
J 78.7 77.4 80.6* 81.5* −0.6 −0.7 −1.0* −1.1* −62.9 −76.4** −60.4 −47.2**
Rd 1.9 1.8 2.0* 2.2* −1.2 −1.1 −1.3 −1.4 +11.3 +19.6* +8.1 +5.2*
Ci35 20.0 20.9 21.6 21.0 −0.6 −0.4 −0.4 −0.4 −35.7 −33.2 −37.5 −44.0*
Ci70 49.0 50.9 49.5 48.6 −0.5 −0.7* −0.6* −0.6 −34.2 −33.1 −41.5* −40.2* Figure 6. Effect of needle water potential (Ψl) on stomatal conduc-tance (Gs, µmol m−2 s−1). Measurements were made at Ca = 35 Pa for the control and ET treatment and at Ca = 70 Pa for the EC and EC + ET treatments. Other conditions were the same as for Figure 1. Equations of the regression lines for the treatments are:
Discussion
In agreement with results reported for other conifers (Beadle and Jarvis 1977, Tolley and Strain 1985, Eastman and Camm 1995), maximum assimilation rates of Scots pine shoots were responsive to decreasing Ψl irrespective of the elevated
tem-perature and CO2 treatments. Long-term elevation of CO2 and
temperature led to significant differences in threshold values of Ψl for Amax (light-saturated rate of assimilation) and
sensi-tivity of Amax to decreasing Ψl. Trees grown in the EC, ET or
EC + ET treatment had a lower threshold value (about −1.0 MPa) of Ψl than control trees (about −0.7 MPa). When Ψl
decreased from −0.7 to −1.6 MPa, Amax of control trees and
trees in the EC, EC + ET, and ET treatments decreased by 77.4, 61.5, 62.9 and 46.7%, respectively. This implies that (i) the sensitivity of photosynthesis in Scots pine to low values of Ψl
is not a fixed property but can shift with previous growth conditions; and (ii) with acclimation to the predicted increase in atmospheric CO2 concentration and temperature, the
toler-ance of Scots pine to drought conditions will increase. To estimate the extent of nonstomatal limitation on carbon assimilation during water stress, we measured changes in the dependence of net assimilation on intercellular CO2 (Ci)
(Col-latz et al. 1976, Farquhar and Sharkey 1982, Comstock and Ehleringer, 1984). Von Caemmerer and Farquhar (1984), working with Phaseolus vulgaris L., and Sharkey and Badger (1982), working with Xanthium strumarium L., found that short-term water stress caused a decline in the CO2
assimila-tion rate at high Ci, but not at low Ci. Furthermore, the decline
paralleled the decline in the RuP2-regeneration capacity. As
water stress intensified, net assimilation rates at both high Ci
and low Ci were affected. On the other hand, Collatz (1977),
Jones (1973) and Radin and Ackerson (1981) observed a marked decrease in CO2 assimilation rate at all Ci values
following water stress. Our results (Figure 1) correspond with those of von Caemmerer and Farquhar (1984) and Sharkey and Badger (1982). The dependencies of Vc,max (Figure 2) and J
(Figure 3) on Ψl indicated that when Ψl was below the
thresh-old value, J was more responsive to decreasing Ψl than Vc,max
(Table 2) regardless of treatments. The EC + ET and ET treatments increased the threshold values of Ψl of Vc,max and J
significantly, and reduced the rate of decrease in Vc,max and J
with decreasing Ψl. The EC treatment enhanced the decline in Vc,max and J with decreasing Ψl.
In all treatments, the transition from ‘‘RuP2-carboxylase
limitation’’ to ‘‘RuP2-regeneration limitation’’ declined with
decreasing Ψl (Figure 1), indicating that regeneration of RuP2
was affected more by water stress than RuP2-carboxylase
ac-tivity. At light saturation and near the temperature optimum, the values of Ci calculated for an ambient CO2 partial pressure
of 35 Pa were just above the linear region, i.e., slightly above the transition point (Figure 1). This implies that the most important factors responsible for determining Ci were stomatal
conductance and the activity of RuP2-carboxylase, because if Figure 7. Calculation of the stomatal and non-stomatal contributions
to the decline in net assimilation (An). The dotted lines represent different supply functions (Raschke 1979). The point Aa (or A′a) represents the assimilation rate at a given ambient partial pressure of CO2 (35 Pa) and needle water potential (Ψl). The symbol Ax (A′x) is the assimilation rate (An) at the intersection of the supply function and the An versus Ci response curve. Assuming a stomatal first path (Jones 1985), the percentage of stomatal limitation, Ls, was defined as 100 × (Aa−Ax)/(Aa−A′a); assuming a mesophyll first path, the percentage limitation, Ls, was defined as 100 × (Aa−A′x)/(Aa−A′a).
Table 3. Partitioning (%) between stomatal (Ls) and non-stomatal (Ln) components of the difference in assimilation for a change in Ψl from −0.4 to −1.0 MPa, or from −0.4 to −1.8 MPa at an ambient partial pressure of CO2 of 35 Pa. Calculations were made according to the path-dependent method (Jones 1985), assuming either a stomatal first or a mesophyll first path (see Figure 7). Each value is the mean of four replicates. Single and double asterisks indicate significant differences at P < 0.05 and P < 0.01, respectively (3-way ANOVA applied to Ls and Ln, in which EC, EC + ET and ET were the independent variables).
Path Parameters Control EC EC + ET ET
Change in Ψ from −0.4 to −1.0 MPa
Stomatal first Ls 80.1 82.4 81.2 78.3
Ln 19.9 17.6 18.9 21.7
Mesophyll first Ls 63.8 51.7* 65.6 70.8*
Ln 36.2 48.3** 34.4 29.3*
Change in Ψ from −0.4 to −1.8 MPa
Stomatal first Ls 92.8 97.1 90.6 89.4
Ln 7.2 2.9* 9.4 10.7*
Mesophyll first Ls 21.8 13.6** 24.2 28.5*
the inherent capacity of the leaf for CO2 assimilation and the
conductance to CO2 diffusion decreased in exact proportion
with decreasing Ψl, Ci should have remained constant
(Far-quhar and Sharkey 1982). Similar results have been observed by Comstock and Ehleringer (1984) in stressed Encelia frutes-cens (A. Gray) A. Gray.
Changes in respiration rate (Rd) with decreasing Ψl also had
a large effect on the initial slope of the An--Ci curve, i.e., on
carboxylation efficiency. Respiration rate was more or less independent of changes in Ψl above −1.3 MPa (Figure 4);
however, values of Rd appeared to differ greatly between
treat-ments at Ψl values below −1.3 MPa. Thus, the decline in Vc,max in response to severe water stress should be interpreted
cautiously.
Stomatal conductance was closely coupled with photosyn-thesis (cf. Matthews and Boyer 1984, Briggs et al. 1986, Teskey et al. 1986, Cheeseman 1991). Furthermore, Ci
de-creased with decreasing Ψl (Figure 5), suggesting that stomata
imposed a large limitation on photosynthesis under water stress conditions. We determined the extent to which stomatal closure limited the rate of photosynthesis at low Ψl by means
of a simplified path-dependent method (Jones, 1983, 1985). Calculations made according to the different paths differed markedly (Table 3); however, when the data were combined with the dependence of Vc,max (Figure 2), J (Figure 3) and Gs
(Figure 6) on Ψl, we obtained indirect evidence that the
‘‘sto-matal limitation first’’ pathway predominated when Ψl was
> −1.0 MPa, whereas the ‘‘mesophyll limitation first’’ pathway predominated under conditions of severe water stress. We emphasize that this calculation can only be considered an approximation (Assmann 1988) and we cannot preclude the possibility that the decline in assimilation rate was the result of the co-limitation of both stomatal and non-stomatal compo-nents However, if ‘‘mesophyll limitation first’’ is assumed at Ψl
values from −0.4 to −1.0 MPa, it follows that both stomatal and non-stomatal limitations must have contributed equally to the decline in assimilation; on the other hand, if ‘‘stomatal limita-tion first’’ is assumed at Ψl values from −1.0 to −1.8 MPa, it
follows that non-stomatal limitation was negligible (2.9--10.6%).
In conclusion, changes in the response of photosynthesis to low Ψl involve a complex, regulated response of leaf
metabo-lism and also depend partly on morphological differences that affect water delivery and use. We present evidence that, in Scots pine, the decline in photosynthesis with decreasing Ψl is
the result of stomatal limitation during the early stages of drought and non-stomatal limitation during severe water stress; i.e., leaf conductance adjusts quickly to decreasing Ψl,
whereas non-stomatal components respond more slowly. Among the non-stomatal components, RuP2-regeneration
limitation contributed more to the decrease in CO2 assimilation
rate than RuP2-carboxylase limitation during short-term water
stress.
Acknowledgments
This study, which is a part of the project ‘‘Response of the Boreal Forest Ecosystem to Changing Climate and its Silvicultural Implica-tions,’’ was funded by the Finnish Climate Change Study Programme
(SILMU) and the University of Joensuu. The authors thank Dr. Jorma Aho for providing the facilities at the Mekrijärvi Research Station, Mr. Matti Lemettinen and Mr. Alpo Hassinen for developing and maintain-ing the experimental chambers, Dr. Heikki Smolander and Mr. Pekka Voipio for their help in establishing and running the laboratory meas-uring system, and Dr. Heikki Hänninen for constructive criticism of the manuscript.
References
Assmann, S.M. 1988. Stomatal and non-stomatal limitations to carbon assimilation: an evaluation of the path-dependent method. Plant Cell Environ. 11:577--582.
Badger, M.R. and G.J. Collatz. 1977. Studies on the kinetic mecha-nism of ribulose-1,5-bisphosphate carboxylase and oxygenase reac-tions, with particular reference to the effect of temperature on kinetic parameters. Carnegie Inst., Washington, DC, Yearbook 76:355--361.
Beadle, C.L. and P.G. Jarvis. 1977. The effects of shoot water status on some photosynthetic partial processes in Sitka spruce. Physiol. Plant. 41:7--13.
Beadle, C.I., R.E. Nielson, P.G. Jarvis and H. Talbot. 1981. Photosyn-thesis as related to xylem water potential and carbon dioxide con-centration in Sitka spruce. Physiol. Plant. 52:391--400.
Boyer, J.S. 1971. Nonstomatal inhibition of photosynthesis in sun-flower at low leaf water potential and high light intensities. Plant Physiol. 48:532--536.
Briggs, G.M., T.W. Jurik and D.M. Gates. 1986. Non-stomatal limita-tion of CO2 assimilation in three tree species during natural drought conditions. Physiol. Plant. 66:521--526.
Cheeseman, J.M. 1991. PATCHY: simulating and visualizing the ef-fects of stomatal patchiness on photosynthetic CO2 exchange stud-ies. Plant Cell Environ. 14:593--599.
Collatz, G.J. 1977. Influence of certain environmental factors on photosynthesis and photorespiration in Simmondsia chinensis. Planta 134:127--132.
Collatz, J.M., P.J. Ferrar and R.O. Slatyer. 1976. Effects of water stress and differential hardening treatments on photosynthetic charac-teristic of a xeromorphic shrub, Eucalyptus socialis F Muell. Oe-cologia 23:95--105.
Comstock, J. and J. Ehleringer. 1984. Photosynthetic responses to slowly decreasing leaf water potentials in Encelia frutescens. Oe-cologia 61:241--248.
Eastman, P.A.K. and E.L. Camm. 1995. Regulation of photosynthesis in interior spruce during water stress: changes in gas exchange and chlorophyll fluorescence. Tree Physiol. 15:229--235.
Farquhar, G.D. and T.D. Sharkey. 1982. Stomatal conductance and photosynthesis. Annu. Rev. Plant Physiol. 33:317--345.
Farquhar, G.D. and S. von Caemmerer. 1982. Modelling of photosyn-thetic response to environmental conditions. In Encyclopedia of Plant Physiology, N. S., Vol. 12B: Physiological Plant Ecology II. Eds. O.L. Lange, P.S. Nobel, C.B. Osmond and H. Ziegler. Sprin-ger, Berlin, Heidelberg, New York, pp 549--587.
Hsiao, T.C. and E. Acevedo. 1974. Plant responses to water deficits, water use efficiency, and drought resistance. Agric. Meteorol. 14:59--84.
Hutmacher, R.B. and D.R. Krieg. 1983. Photosynthetic rate control in cotton. Stomatal and nonstomatal factors. Plant Physiol. 73:658--661.
Joens, H.G. 1973. Limiting factors in photosynthesis. New Phytol. 72:1089--1094.
Ludlow, M.M. 1980. Adaptive significance of stomatal response to water stress, In Adaptations of Plants to Water and High Tempera-ture Stress. Eds. N.C. Turner and P.J. Kramer. John Wiley and Sons, NY, pp 123--138.
Matthews, M.A. and J.S., Boyer. 1984. Acclimation of photosynthesis to low leaf water potentials. Plant Physiol. 74:161--166.
Moldau, H. 1973. Effects of various water regimes on stomatal and mesophyll conductances of bean leaves. Photosynthetica 7:1--7. Myers, B.J. and I.E. Craig. 1988. Changes in water potential of Pinus
radiata fascicles during temporary storage. J. For. Sci. 18:3--8. Radin, J.W. and R.C. Ackerson. 1981. Water relations of cotton plants
under nitrogen deficiency. III. Stomatal conductance, photosynthe-sis, and abscisic acid accumulation during drought. Plant Physiol. 67:115--119.
Raschke, K. 1979. Movements of stomata. In Physiology of move-ments. Encycl. Plant Physiol. (NS). Eds. W. Harpt and M.E. Fein-leib. Springer, Berlin, pp 383--441.
Sharkey, T.D. and M.R. Badger. 1982. Effects of water stress on photosynthetic electron transport, photophosphorylation, and meta-bolite levels of Xanthium strumarium mesophyll cells. Planta 156:199--206.
Teskey, R.O., J.A. Fites, L.J. Samuelson and B.C. Bongarten. 1986. Stomatal and nonstomatal limitation to net photosynthesis in Pinus taeda L. under different environmental conditions. Tree Physiol. 2:131--142.
Tolley, L.C. and B.R. Strain. 1985. Effects of CO2 enrichment and water stress on gas exchange of Liquidambar styraciflua and Pinus taeda seedlings grown under different irradiance levels. Oecologia 65:166--172.
Troughton, J.H. and R.O. Slatyer. 1969. Plant water status, leaf tem-perature, and the calculated mesophyll resistance to carbon dioxide of cotton leaves. Austr. J. Biol. Sci. 22:815--827.
von Caemmerer, S. and G.D. Farquhar. 1981. Some relationships between the biochemistry of photosynthesis and the gas exchange of leaves. Planta 153:376--387.
von Caemmerer, S. and G.D. Farquhar. 1984. Effects of partial defo-liation, changes of irradiance during growth, short-term water stress and growth at enhanced p(CO2) on the photosynthetic capacity of leaves of Phaseolus vulgaris L. Planta 160:320--329.
Wang, K.Y., S. Kellomäki and K. Laitinen. 1995. Effects of needle age, long-term temperature and CO2 treatments on the photosynthesis of Scots pine. Tree Physiol. 15:211--218.
Wang, K.Y. 1996. Apparent quantum yield in Scots pine after four years of exposure to elevated temperature and CO2. Photosyn-thetica. In press.