www.elsevier.nlrlocatergeoderma
Lateral flow in loamy to sandy Kandiudults of the
ž
/
Upper Coastal Plain of Georgia USA
J.N. Shaw
a,), D.D. Bosch
b, L.T. West
c, C.C. Truman
b,
D.E. Radcliffe
ca
Auburn UniÕersity, Department of Agronomy and Soils, 202 Funchess Hall, Auburn,
AL 36849-5412, USA
b
USDA-SE Research Watershed Laboratory, P.O. Box 946, Tifton, GA, 31794, USA
c
UniÕersity of Georgia, Department of Crop and Soils, 3111 Miller Plant Sci. Bldg., Athens,
GA 30602, USA
Received 12 May 1999; received in revised form 27 April 2000; accepted 1 May 2000
Abstract
Interest in site-specific agronomic management in intensively cropped regions necessitates
Ž .
characterization of subsurface water movement for efficient water management irrigation timing and control of off-site agrichemical movement. Soils formed in fluvial sediments in portions of the
Ž .
Upper Coastal Plain of Georgia USA are extensively used for peanut, cotton, and corn production. Certain proximate soils in this region possess contrasting subsoil properties, and it was hypothesized that these differences would have major effects on water redistribution across the landscape. This could be important in irrigation management, where soils possessing increased impedance to vertical flow could require decreased irrigation as opposed to soils without vertical
Ž .
flow restrictions. At a site near Plains, GA. USA , hydraulic properties of soils with differences
Ž .
in overlying sand thickness and contrasting argillic horizon textures sandy vs. loamy were evaluated. The soils were predominantly in loamy and sandy families of Typic, Arenic, and Grossarenic Kandiudults. Laboratory measurements, field monitoring of matric potentials under
Ž .
simulated and natural rainfall, and modeling VS2DT were utilized to evaluate soil hydraulic
Ž .
properties. Reduction in vertical K occurred in horizons containing higher clay argillic horizon .s
Changes in tension and build ups in hydraulic gradients associated with infiltration and redistribu-tion events existed above and within horizons with low K . Evidence suggested there was lesss
groundwater recharge occurring in the loamy than in the sandy pedons, suggesting more
)Corresponding author. Tel.:q1-334-844-3957; fax:q1-334-844-3945.
Ž .
E-mail address: [email protected] J.N. Shaw .
0016-7061r01r$ - see front matterq2001 Elsevier Science B.V. All rights reserved. Ž .
pronounced lateral flow occurred in the loamier soils. Model simulations of water movement
Ž .
across a slightly sloping 1% simulated landscape indicated lateral gradients of flow existed
Ž .
within the solum of these soils. Analyses of tracer Br movement suggested a very slight lateral redistribution occurred within a relatively short monitoring period within the sandy pedon’s Bt1 horizon, and the Bt2 and Bt3 horizons of the loamy pedon. Evidence suggested both loamy and sandy argillic horizons slightly, but not overwhelmingly, induced lateral flow on these landscapes.
q2001 Elsevier Science B.V. All rights reserved.
Keywords: vadose zone; coastal plains; hydraulic conductivity; lateral flow
1. Introduction
Ž .
Pedogenic clay translocation and depositional processes create soil horizons
Ž
that can affect transient water movement in the vadose zone Bruce and Whisler,
.
1973; Wilson et al., 1990; Shaw et al., 1997 . Particle-size differences create soil interfaces that can act as impermeable lenses, e.g., soil horizons containing abundant clay inhibit vertical movement of water as infiltration is typically
Ž
faster than percolation through the argillic horizon Kung, 1990a; Jury et al.,
.
1991 . If sufficient restriction occurs, lateral flow can be induced above and within these less permeable zones. Lateral flow can result in elevated pollution of surface and groundwater where decreased transport times do not allow for the
Ž .
renovation effects of soils Chappall et al., 1990 . In addition, differences in subsoil permeability can affect irrigation timing.
Hydrologists have investigated the effects of shallow subsurface features on lateral water movement in the vadose zone, with emphasis on streamflow
Ž
evolution and water quality Anderson and Burt, 1990; McDonnell, 1990;
.
Wilson et al., 1991, 1993; Ross et al., 1994; Nyberg, 1995 . A significant lateral flow component on a hillslope is often associated with layers with reduced
Ž
permeability relative to the overlying horizons Gaskin et al., 1989; Wilson et
.
al., 1990; Bosch et al., 1994 . Shallow subsurface water-restrictive features are often pedogenic in origin; e.g., argillic horizons, and positive pressure potentials have been shown to occur above argillic horizons during infiltration events
ŽBruce and Whisler, 1973 . Wilson et al. 1990 found perched water tables. Ž . Ž .
above argillic horizons in Ultisols in Tennessee USA . They concluded that during storm events, macropore flow through overlying eluvial horizons resulted in near saturated conditions above the argillic horizon leading to downslope water movement along it’s upper portion. In landscapes containing variation in argillic horizon expression, the occurrence and degree of water perching can be quite different. Coarse sands can also induce hydraulic barriers and lateral flow under unsaturated conditions. Even when steep pressure head gradients exist across a fine and coarse textured interface, air-filled pores and the small
Ž .
effective cross-section prevent flow into coarse material Jury et al., 1991 .
Ž .
Ž . Ž .
Plainfield loamy sand USA sandy, mixed, mesic Typic Udipsamment where coarse sand lenses were interbedded with fine sands. Dye patterns indicated that water moved laterally over coarse sand wedges after vertically infiltrating into finer sand lenses. Coarse sand lenses, if sloped, can act to funnel the water flow and create irregularly spaced columns of water movement.
Ž .
In our region southwest Georgia, USA , many upland soils possess coarse-textured epipedons with high infiltration rates, and subsurface horizons of reduced K . The presence and permeability of these underlying horizons greatlys
Ž .
influences soil hydraulic properties Blume et al., 1987 . Most soils of the region have an appreciable clay increase in the solum, but soils with loamy sand and
Ž . Ž
sandy loam 5 to 20% clay textured argillic horizons are common sandy and
. Ž
coarser textured loamy families of Grossarenic Kandiudults Pilkinton, 1974;
.
Shaw et al., 2000 . These soils with sandy argillic horizons are geomorphically
Ž
associated with soils that possess better developed argillic horizons 20% to 40%
.
clay and are correspondingly classified in loamy and fine-loamy families of
Ž
Typic, Arenic, and Grossarenic Kandiudults Hicks et al., 1991a; Bosch and
.
West, 1998 .
Because of the intensive row-crop agriculture, studies on agrichemical move-ment into groundwater have been conducted in this region. Ground waterragrichemical fate investigations in this region at a site near Plains, GA.,
Ž .
have shown atrazine and it’s metabolite, desethylatrazine DEA , were at maximum concentrations in groundwater 60 m down gradient from the
applica-Ž
tion point, with smaller amounts being detected 280 m down gradient Leonard
. Ž .
et al., 1993 . At the same site but shallower in the profile, Hicks et al. 1991b investigated movement of a Br tracer and hypothesized an appreciable amount of lateral transport in the vadose zone occurred that was possibly due to local
Ž .
regions of decreased K . In similar soils, Bosch and West 1998 have showns
that subsoil Ks decreased with increasing clay content as soils graded from
Ž . Ž .
sandy 5% to 15% clay to loamy 30% to 35% clay argillic horizons.
It is hypothesized on these landscapes that water distribution in the vadose zone is controlled largely by argillic horizons of variable conductivity. In other
Ž .
landscapes of the region, Bosch et al. 1994 have shown that significant vertical flow impedance and lateral flow is induced by well defined argillic horizons containing plinthite. However, due to the range in argillic horizon characteristics of the studied associated soils, the degree of vertical flow inhibition and possible lateral flow is hypothesized to vary. Besides ramifications for groundwater contamination potential, soils with contrasting hydraulic properties in the solum affect irrigation timing, i.e., soils that inhibit vertical water movement may requires less frequent irrigations than highly permeable soils that require more
Ž .
frequent, less intense irrigation. Thus, our objectives were to: 1 evaluate hydraulic properties of these predominantly sandy soils with contrasting subsoil
Ž .
2. Materials and methods
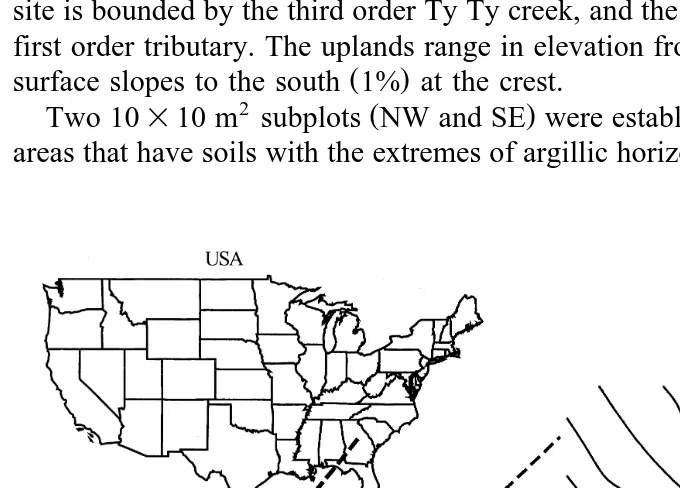
Sumter county, located in southwestern Georgia, lies within the Coastal Plain physiographic province. Deep geologic materials in this area were derived from fluvio-marine deposited gravel, sand, silt and clay. The research site, near Plains
Ž . Ž . Ž X Y Y X Y Y
.
Sumter , GA Fig. 1 31859 0 to 45 N; 84824 0 to 30 W , is located in the
Ž . Ž
southern portion of the Fall Line Hills region, and is underlain by: 1 the )12
. Ž . Ž .
m below the surface Tuscahoma formation Paleocene age ; and 2 the
Ž . Ž . Ž
shallower Tallahatta formation f3 to 12 m Eocene age Hicks et al., 1991b;
.
Stewart and Hicks, 1996 . The Claiborne aquifer is contained dominantly in the lower Tallahatta formation and is relatively unconfined and generally reflective
Ž .
of surface topography Hicks et al., 1991b . Since sediment deposition, fluvial events and dissection of terraces have altered the landscapes. The research site is situated on an interfluverfluvial terrace landscape position, and soils have
Ž .
mostly developed in fluvial parent materials Fig. 1 . The west portion of the site is bounded by the third order Ty Ty creek, and the east side is bordered by a first order tributary. The uplands range in elevation from 125 to 145 m, and the
Ž .
surface slopes to the south 1% at the crest.
2 Ž .
Two 10=10 m subplots NW and SE were established on this interfluve in areas that have soils with the extremes of argillic horizon clay content and sandy
Ž .
epipedon thickness found in upland positions of this region. Adjacent to each subplot, pits were excavated, and pedons were described, sampled, and
classi-Ž .
fied according to standard Soil Survey Staff 1996 techniques. An additional pedon was sampled in the NE corner, but no subplot was established as this soil possessed properties intermediate of the NW and SE pedons. Soils examined classified into coarse–loamy, kaolinitic, thermic Typic Kandiudults in the SE; loamy, kaolinitic, thermic Grossarenic Kandiudults in the NW; and loamy, kaolinitic, thermic Grossarenic Kandiudults in the NE. The SE soil possessed the most clayey argillic horizon, the NW soil had the sandiest, and the NE was
Ž . Ž .
intermediate Table 1 . Saturated hydraulic conductivity Ks measurements
Table 1
K data and selected physical properties for pedonss Ž .
Hor Depth cm Ks
Field mean Lab Clay % Bulk
y1 )
Žcm h . horizontal density
y1 y3
Žcm h . Žg cm .
SE: coarse – loamy, kaolinitic, thermic Typic Kandiudult
d
NW: loamy, kaolinitic, thermic Grossarenic Kandiudult
c,d
NE: loamy, kaolinitic, thermic Grossarenic Kandiudult
d
)Numbers in parentheses are standard deviations. Means with superscripts of the same letter
were conducted within each horizon in the field using the Compact Constant
Ž . Ž .
Head Permeameter CCHP borehole technique Amoozegar, 1989 .
2.1. Laboratory
Bulk samples collected as above were air-dried and weighed, and coarse fragments were removed by crushing samples and dry sieving through a 2-mm
Ž .
sieve. Particle size analyses PSA was conducted with the pipette method
ŽKilmer and Alexander, 1949 . Bulk density was measured by the clod method. ŽBlake and Hartge, 1986 . Horizontal and vertically oriented small cores 8.5. Ž =6
2.
cm were collected from each horizon for measurement of hydraulic properties.
Ž .
Saturated hydraulic conductivities Ks on small horizontal cores were measured
Ž .
with the constant head method Klute and Dirksen, 1986 . Water release curve
Ž .
measurements were conducted on vertical cores over pressures h from 10 to 15 000 cm H O. Water release data were fit to a modified van Genuchten2
Ž .
expression van Genuchten, 1980; Lappala et al., 1993 for comparison and for
Ž
simulation model input using the Variably Saturated Two-Dimensional Solute
.
Transport, VS2DT; Lappala et al., 1993 :
1 y1 N N
us 1q y
Ž
aŽ .
h.
Ž
usyur.
qurŽ .
1where: asscaling length parameter related to the air entry potential; reciprocal
Ž y1.
of a is an estimate of the suction where the first pores empty cm . Nspore
Ž 3 y3.
size distribution parameter. ursresidual volumetric water content cm cm .
Ž 3 y3. Ž
usssaturated volumetric water content cm cm . hsmatric potential cm
.
H O .2
Ž
Curve fitting was conducted using a least squares algorithm Marquardt–
.
Levenburg which minimized sums of squares. Although us is sometimes fixed
Ž .
in this equation as equal to porosity w , w was utilized only as an upper constraint since entrapped air often causesus to be slightly lower than w. Using
w Ž .x
these parameters, unsaturated hydraulic conductivity K h curves were
devel-Ž .
oped van Genuchten, 1980 :
yM 2
During a 2-year period, tensiometers installed at 60, 90, 120, 160, 200 and
Ž .
subplots. Measurements were collected utilizing calibrated pressure transducers attached to tensiometers and connected to a Campbellw1 CR 10 data logger with a multiplexer. Triplicate tensiometers were installed in each subplot at each
Ž .
depth 2 m apart . Some of these data exhibited a diurnal fluctuation as displayed by rapidly ascending and descending data, most likely associated with the heating and cooling of the column above the water in the tensiometers
ŽCassel and Klute, 1986; Butters and Cardon, 1998 . This was differentiated.
from changes in moisture status.
2.3. Rainfall simulations
Ž 2.
Two simulated rainfall events were applied to portions 10=5 m of each of the subplots. Subplot surfaces were roto-tilled prior to applying rainfall, and strips of furnace filter were placed on the surface to minimize surface crusting and maintain infiltration. The first simulation was conducted in January, 1995.
Ž .
Experiments were conducted by raining water obtained from adjacent well for 1 h, taking measurements, then raining for an additional hour. Rainfall
intensi-Ž . Ž . y1
ties were 4.74 1st hour and 4.46 2nd hour cm h for the NW subplot, and
Ž . Ž . y1
4.25 1st hour and 3.86 2nd hour cm h for the SE subplot. During rainfall events, h was monitored in both plots with tensiometers nests as described above
Žlogged at 5-min intervals . Soil moisture was monitored 15 cm depth incre-. Ž
. w
ments at select times with a Troxler Capacitance Probe.
Ž .
During the second simulation August, 1995 , rainfall intensities were 4.64
Ž1st hour , and 4.82 2nd hour cm h. Ž . y1 for the NW site, and 3.08 1st hour , andŽ .
Ž . y1
4.03 2nd hour cm h for the SE site. At each site, the simulation was conducted for 1 h, halted for 0.5 h during sample collection, then resumed for 1 h. Soil matric potential heads were monitored as above.
During the August simulation, 5 kg of KBr were placed at a 5 cm depth
Žapproximately 30 cm in diameter at one end of each plot under the simulators..
Ž y1.
KBr was chosen due to it is high water solubility 53.5 g 100 ml and relatively conservative behavior. At 1, 3, 6, 11, 17 and 45 h, soil samples were collected. Samples were taken from the center, and at 40, 65 and 90 cm from the
Ž .
center in four directions N, S, E, W , at depths of 15, 30, 60, 90, and 120 cm for early sample times, with additional depths of 160 and 200 cm for later sample times. Soils were air dried, crushed, and 10 g of soil were added to 30 ml of water, and shaken for 0.5 h. Suspensions were analyzed for Br with an ion
Ž . Ž .
specific electrode ISE using a 5 M NaNO3 1% vrv ionic strength adjustor with a double junction reference electrode. Due to ISE detection limits and
1
y1 Ž y5
background levels, only concentrations above 0.2 mg kg 1=10 M for
.
10.0 g in 30 ml were considered. Bromide data was compiled as a function of
x, y, and z coordinates.
2.4. Modeling procedure
In order to assess the probability of lateral flow and to permit a more holistic
Ž .
view, we used VS2DT to simulate landscape water flow Lappala et al., 1993 . VS2DT is a finite-difference model that uses numerical techniques with a fully implicit scheme to simulate two-dimensional water flow at subsequent time
Ž . Ž .
steps. Measured anisotropy, K ,s a, N, ur, us and estimated specific storage hydraulic parameters for E1 and E2 horizons and Bt1 and Bt2 horizons were combined for the NW soils. Parameters for Bt2 and Bt3 horizons and Bt4 and Bt5 horizons were combined for the SE soils.
Ž .
VS2DT was utilized to simulate total head H in a landscape cross-section
Ž50 m length set at 1% slope to mimic the actual landscape of the site.
consisting of equal proportions of the NW, NE, and the SE soil, similar to soil distribution relationships at our site. NE pedon properties were placed between
Ž
the other two soil types for it possessed properties morphological and
hy-.
draulic intermediate of the NW and SE soils, which is typical on these
Ž .
landscapes Bosch and West, 1998 . The upper boundary conditions were set at
Ž y1. Ž .
a constant infiltration rate 40 mm h for the first recharge period 2 h , then
Ž .
changed to a no flow boundary remaining 70 h . Left, right, and bottom boundaries were set to hs y100 cm H 0 during the first recharge period, then2
changed toy50 cm H 0 during the rest of the simulation. The distance between2
10 and 40 m was evaluated on the transect to minimize any edge affects caused by the boundary conditions. Initial condition was set to a constant matric
Ž .
potential head hs y75 cm H 0 . The simulation was conducted for 72 h.2
3. Results and discussion
3.1. Saturated hydraulic conductiÕity
Pedons were classified as Typic, Grossarenic, and Grossarenic Kandiudults
Ž .
for SE, NE, and NW subplots, respectively Shaw et al., 2000 . In the SE pedon, clay increased immediately below the surface horizon from 2.7% in the Ap to 11.6% in the Bt1, with another increase in clay from 16.3% in the Bt3 to 28.1%
Ž .
in the Bt4 occurring at 1.26 m Table 1 . Field Ks increased below the SE
Ž . y1
pedon, where clay increased from 3.7 to 9.0% from the Ap to the E horizon, and
Ž . Ž . y1
the K increased from 16.4s "1.3 Ap to 45.3"48.7 E cm h . Although not described, the occurrence of a traffic or plow pan at the base of the Ap horizon in these two pedons may account for the lower K observed in these surfaces
horizons. A decrease in K from 11.2"9.5 cm hy1 in the Bt3 to 3.3"3.3 cm s
hy1 in the Bt4 occurred concurrent to the second increase in clay in the SE Ž
pedon. However, these differences in the SE pedon were not significant ps
.
0.05 . A decrease in Ks was also observed where clay increased in the NE pedon; from 45.3"48.7 cm hy1 to 12.7"1.6 cm hy1 in the E and Bt1 horizons, respectively. For the NW pedon, the argillic horizon began at 1.38 m
Žclay increased from 5.8% in the E3 to 15.2% in the Bt1 , and similar to the. Ž
other pedons, there was a decrease in Ks 108.4"85.4 in E3 to 14.4"6.9 cm
y1 .
h in Bt1 associated with the increase in clay. There were significant
Ž . Ž
differences ps0.05 between eluvial and illuvial horizons in this pedon Table
. y1
1 . The lowest field Ks in the SE pedon was 3.3"3.3 cm h in the Bt4 horizon, and 3.0"2.3 cm hy1 in the BC1 horizon. These were an order of
Ž y1 .
magnitude less than the lowest K in the NW pedon 14.4s "6.9 cm h in Bt1
Ž y1 .
or the NE pedon 12.7"1.6 cm h in Bt2 .
Because of the lower Ks of the argillic horizon of the SE soil, it was hypothesized the SE pedon would possibly show a higher degree of lateral flow associated with the argillic horizon than the NW pedon. Effective saturated
Ž .
conductivity Keff , or the depth weighted mean of the conductivity for the
Ž .
entire solum through the CB horizon of SE and NW pedons indicated the NW pedon was almost five times as conductive as the SE pedon; 35.2 cm hy1 for the
NW pedon, to 7.5 cm hy1 for the SE pedon.
3.2. Water release curÕes
Ž .
The van Genuchten 1980 expression was fit to the water release curves and
Ž .
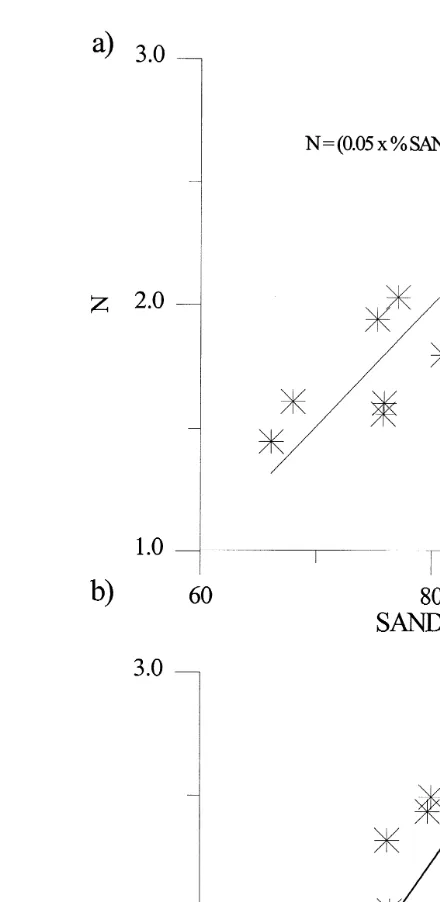
parameters were averaged for each horizon Table 2 . Relatively sandier
hori-Ž .
zons E’s, Ap from NW; Bt1 from SE; Ap and E from NE had higher N values than horizons with more clay, indicative of steeper retention curves associated with a quicker water release, and suggesting a relatively homogeneous pore
Ž .
system. The SE Ap horizon, although sandy, had a lower N value 1.745 . Reasons for this horizon displaying water release curve characteristics of a loamier horizon were unclear, although it is probable these horizons had greater organic matter content and were slightly more compacted. Sand content was
Ž . Ž .
positively correlated rs0.82 with N for all horizons Fig. 2a . Similarly, N
Ž . Ž .
was correlated rs0.80 with Ks Fig. 2b . Soil descriptions indicated that
Ž .
sandier horizons E’s and upper Bt’s were structureless or had weak grades of
Ž .
structure Shaw et al., 2000 . Thus, it appeared that particle size as opposed to soil structure was having a predominant effect on moisture retention and K ofs
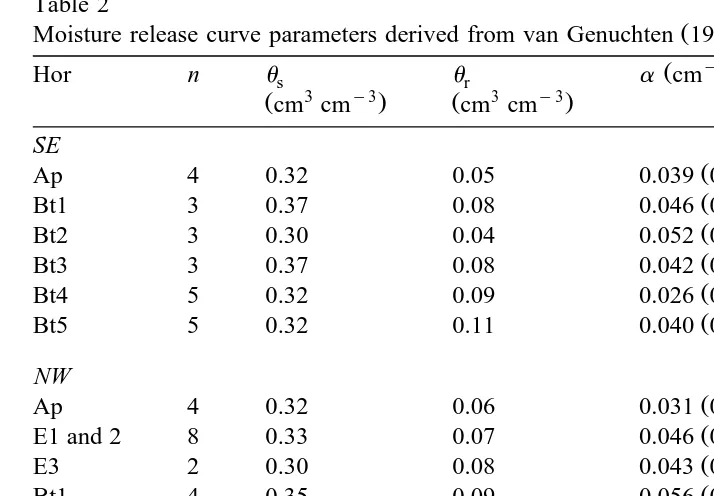
Table 2
Ž .
Moisture release curve parameters derived from van Genuchten 1980 expression
y1 a
Bt1 3 0.37 0.08 0.046 0.01 2.032 0.10
Ž . Ž .
Bt2 3 0.30 0.04 0.052 0.02 1.603 0.36
Ž . Ž .
Bt3 3 0.37 0.08 0.042 0.01 1.942 0.04
Ž . Ž .
Bt4 5 0.32 0.09 0.026 0.01 1.447 0.22
Ž . Ž .
Bt5 5 0.32 0.11 0.040 0.02 1.609 0.18
NW
Bt1 4 0.35 0.09 0.056 0.02 1.819 0.12
Ž . Ž .
Bt2 2 0.35 0.08 0.058 0.02 1.719 0.01
Ž . Ž .
Bt1 3 0.33 0.10 0.039 0.01 1.560 0.07
a
Numbers in parentheses are standard deviations.
3.3. Matric potentials
Ž .
Monitoring of matric potentials h during natural and rainfall simulation
events in the NW and SE pedons was utilized to evaluate if pedogenic horizons acted as impeding layers. There was not sufficient flow restriction to cause
Ž .
saturation as determined from hs0 above any horizon, or aAperchedB water table in the profile under normal events. This was not surprising considering the relatively high permeability of the soils.
Ž
To evaluate differences in h with depth, 11 rainfall events nine natural and
.
two during rainfall simulation events in the NW subplot and 10 events in the
Ž .
SE subplot eight natural and two during rainfall simulation events were
Ž .
analyzed Tables 3 and 4 . In general, during infiltration events retardation and redistribution of wetting fronts occurs due to differences in hydraulic
conductiv-Ž
ity, water retention, and evapotranspiration occurring with depth Katul et al.,
.
1997 . Because of this, increases in water content became proportionally lower with depth. During the rainfall simulation events and under most of the natural
Ž .
Ž . Ž . Ž .
Fig. 2. a N vs. % sand 0.05 to 2 mm . b N vs. K .s
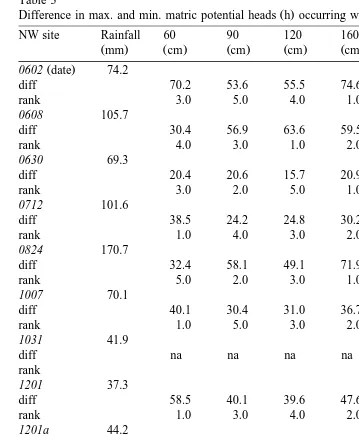
Table 3
Ž . Ž .
Difference in max. and min. matric potential heads h occurring within each event NW
NW site Rainfall 60 90 120 160 200 350
Žmm. Žcm. Žcm. Žcm. Žcm. Žcm. Žcm. Ž .
0602 date 74.2
diff 70.2 53.6 55.5 74.6 73.9 40.6
rank 3.0 5.0 4.0 1.0 2.0 6.0
0608 105.7
diff 30.4 56.9 63.6 59.5 15.2 21.7
rank 4.0 3.0 1.0 2.0 6.0 5.0
0630 69.3
diff 20.4 20.6 15.7 20.9 12.6 16.9
rank 3.0 2.0 5.0 1.0 6.0 4.0
0712 101.6
diff 38.5 24.2 24.8 30.2 23.1 12.8
rank 1.0 4.0 3.0 2.0 5.0 6.0
0824 170.7
diff 32.4 58.1 49.1 71.9 39.7 15.0
rank 5.0 2.0 3.0 1.0 4.0 6.0
1007 70.1
diff 40.1 30.4 31.0 36.7 30.8 16.5
rank 1.0 5.0 3.0 2.0 4.0 6.0
1031 41.9
diff na na na na na na
rank
1201 37.3
diff 58.5 40.1 39.6 47.6 32.3 25.6
rank 1.0 3.0 4.0 2.0 5.0 6.0
1201a 44.2
diff 31.9 24.1 21.6 22.2 24.8 4.7
rank 1.0 3.0 5.0 4.0 2.0 6.0
jansim 92.0
diff 36.0 26.8 22.7 25.3 15.6 18.8
rank 1.0 2.0 4.0 3.0 6.0 5.0
augsim 94.6
diff 120.1 47.5 42.3 51.6 30.4 37.5
rank 1.0 3.0 4.0 2.0 6.0 5.0
Avg change 43.49 34.75 33.25 40.02 27.10 19.09
Avg rank 1.91 2.91 3.27 1.82 4.18 5.00
a b
uvchange 0.091 0.054 0.056 0.033 0.031 na
a
uv change estimated from moisture release curve data for corresponding avg. h change.
b
No moisture release curve data was measured at this depth to convert h touv.
pronounced as in a loamier soil. However, due to the low tensions exhibited, the full ranges in differences in water holding capacities were probably not evident. Generally, wetting fronts advanced at similar rates down to 120 cm in both
Ž .
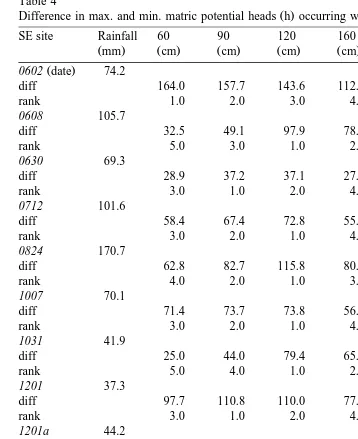
Table 4
Ž . Ž .
Difference in max. and min. matric potential heads h occurring within each event SE
SE site Rainfall 60 90 120 160 200 350
Žmm. Žcm. Žcm. Žcm. Žcm. Žcm. Žcm. Ž .
0602 date 74.2
diff 164.0 157.7 143.6 112.5 108.1 22.2
rank 1.0 2.0 3.0 4.0 5.0 6.0
0608 105.7
diff 32.5 49.1 97.9 78.5 46.2 9.0
rank 5.0 3.0 1.0 2.0 4.0 6.0
0630 69.3
diff 28.9 37.2 37.1 27.0 18.9 5.5
rank 3.0 1.0 2.0 4.0 5.0 6.0
0712 101.6
diff 58.4 67.4 72.8 55.7 38.5 5.7
rank 3.0 2.0 1.0 4.0 5.0 6.0
0824 170.7
diff 62.8 82.7 115.8 80.0 58.9 15.0
rank 4.0 2.0 1.0 3.0 5.0 6.0
1007 70.1
diff 71.4 73.7 73.8 56.0 39.5 13.0
rank 3.0 2.0 1.0 4.0 5.0 6.0
1031 41.9
diff 25.0 44.0 79.4 65.5 49.9 3.5
rank 5.0 4.0 1.0 2.0 3.0 6.0
1201 37.3
diff 97.7 110.8 110.0 77.3 58.5 9.8
rank 3.0 1.0 2.0 4.0 5.0 6.0
1201a 44.2
diff 45.8 49.3 49.0 30.2 20.3 8.0
rank 3.0 1.0 2.0 4.0 5.0 6.0
jansim 81.0
diff 43.7 42.5 58.5 41.8 32.4 20.4
rank 2.0 3.0 1.0 4.0 5.0 6.0
augsim 71.1
diff 69.8 87.3 88.3 66.2 44.4 15.6
rank 3.0 2.0 1.0 4.0 5.0 6.0
Avg change 63.64 72.88 84.17 62.79 46.88 11.62
Avg rank 3.18 2.09 1.45 3.55 4.73 6.00
a b
uvchange 0.059 0.070 0.041 0.034 0.029 na
a
uv change estimated from moisture release curve data for corresponding avg. h change.
b
No moisture release curve data was measured at this depth to convert h touv.
Ž .
()
J.N.
Shaw
et
al.
r
Geoderma
99
2001
1
–
25
Ž .
()
Shaw
et
al.
r
Geoderma
99
2001
1
–
25
15
Ž .
60 cm in 2.9 h, 90 cm in 3.3 h, 120 cm in 4.6 h, 160 cm in 6.5 h, and 200 cm in 9.8 h.
Depths with large differences between maximum and minimum potentials during rainfall events were hypothesized to be zones where vertical water
Ž
movement slowed and subsequent lateral movement of water may occur Tables
. Ž .
3 and 4 . The greatest changes in potential as per average rank over all rainfall
Ž .
events were at 160 cm in the NW pedon Table 3 . This depth was within the Bt1 horizon, which had more clay, and a lower K than the rest of the profile.s Although changes in potential were the largest in this Bt1 horizon, that does not indicate the highest changes in uv due to differences in water retention
proper-Ž .
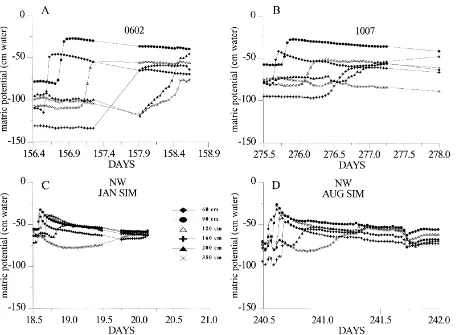
ties Table 3 . However, these data suggested there was some degree of decreased tensions associated with the upper part of this horizon. Potentials also
Ž
changed appreciably in the NW pedon at 90 cm during the rainfall events 0602,
.
1007, Jan and Aug simulation; Fig. 3 . Thus, there was an impedance to vertical movement that caused water to accumulate and the matric potential to increase at 90 cm in the NW pedon. These data suggested two zones of water
accumula-Ž .
tion during water percolation at the NW site, one in the E2 horizon 90 cm , and
Ž .
one in the Bt1 horizon 160 cm .
For the SE pedon, the 120 cm depth exhibited the greatest average change in matric potential. This was immediately above the horizon with the lowest Ks ŽBt4 starts at 126 cm. ŽTable 4 . These data suggested the Bt4 was impeding.
vertical flow and causing decreases in tension above this feature. This is similar
Ž .
to findings by Seyfried 1991 who found increases in moisture content above argillic horizons during infiltration events. However, significant differences in
Ž .
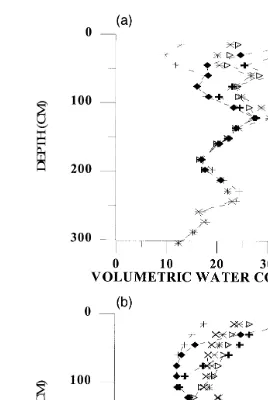
Ks between the SE Bt horizons were not evident Table 1 . Volumetric water content from January simulations indicated a zone of elevateduv at 60 cm in the SE pedon, and at 152 cm in the NW pedon during infiltration and redistribution
ŽFig. 5a and b . Elevated. uv at 152 cm in the NW pedon was consistent with matric potential data, i.e., higher uv occurred at a depth where the largest changes in potential were noted.
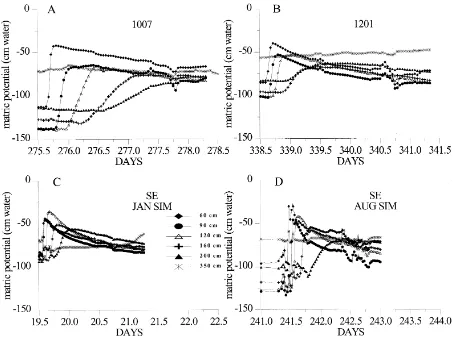
Larger changes in matric potentials at the 350 cm depth occurred in the NW
Ž
than in the SE subplot avg. of 19 cm H O for NW, 11 cm H O for SE; Tables2 2 .
3 and 4, and Figs. 3 and 4 . Noticeable response of the 350 cm tensiometer
Ž
occurred with most events in the NW pedon 0602, and Jan. and Aug.
. Ž . Ž
simulations Fig. 3 , but was not as obvious in the SE pedon 1007, 1201a, Aug
. Ž .
simulation Fig. 4 . The SE pedon has a lower hydraulic conductivity overall, and higher water holding capacity, thus it is hypothesized it would take longer for wetting fronts to reach the 350 cm depth. Even over longer periods, there was typically very little change in matric potential at the 350 cm depth in the SE
Ž .
pedon Fig. 4 . Although water release curve data were not collected, the NW pedon at 350 cm was sandier than the SE pedon at 350 cm, thus a change in potential of 19 cm H O in the NW pedon represented a proportionally larger2
Fig. 5. Volumetric water content with depth for both subplots during the January simulation.
Ž .a SE pedon; b NW pedon.Ž .
suggest larger quantities of water reached deeper portions of the profile in the NW pedon than in the SE pedon. This was interpreted to mean either more vertical water movement associated with the sandier pedon, more water reten-tion in the subsoils of the loamier SE pedon, or differences in evapotranspirareten-tion
ŽET between the pedons. Since ET in these subplots would be similar, data.
Ž .
()
J.N.
Shaw
et
al.
r
Geoderma
99
2001
1
–
25
Ž . Ž .
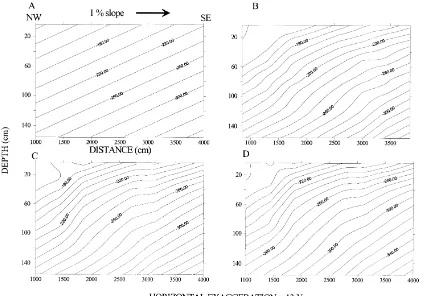
Fig. 6. VS2DT simulation model output plots of total head — H for a transect across a simulated landscape 1% slope proceeding from NW to SE.
3.4. Modeling
The rationale for conducting simulation modeling for these data was to infer possible landscape dynamics of water movement. As discussed in the methods,
Ž .
VS2DT was used to simulate water flow on a slightly sloped 1% landscape
ŽFig. 6 . In conducting these simulations, it was fully evident that slope dictates.
Ž .
a major portion of the initial time 0 lateral gradients. We used a 1% slope
Ž .
because it typified our site. Initial conditions time 0 are shown in Fig. 6A.
Ž .
At the 20 h time step Fig. 6B , an enhanced gradient was predicted to occur
Ž .
leading into the Bt horizon of the middle NE-type soil. This gradient became
Ž . Ž .
better expressed at the 40 h Fig. 6C and 70 h Fig. 6D time step. This is hypothesized to be due to a retarded wetting front resulting in deeper horizons
Žwithin and below the argillic horizon remaining dry why the encroaching.
lateral front wets to deeper depths in adjacent soils. Concurrently, because the wetting front moves slightly quicker in the sandy NW soil, the gradients into the subjacent drier subsoil develops. Thus, enhanced gradients developed leading into these relatively drier zones on the landscape, and local effects of soil types are evident.
Across the landscape through all time periods, fairly steep lateral flow gradients were predicted above 2 m, although correlating this to any particular
Ž .
soil feature such as the top of the argillic horizon was difficult. However, these simulations did indicate that the solum is predicted to have large effects on landscape water movement, even though the separate effects of contrasting horizons were not readily observable.
3.5. Tracer studies
Analysis of tracer movement during the August rainfall simulation events was evaluated by examining sampling depths and locations where Br was detected. Our soil sampling measured the resident concentration of Br that existed at the specified time and depth. Although we measured resident concentrations and we were particularly interested in Br fluxes, as a relative assessment higher resident concentrations indicated areas where Br had migrated.
A few unsystematic, elevated tracer concentrations were detected in both the SE and NW pedons. This was attributed to either macropore presence, or possible contaminationrerror during sampling and analyses. Although macrop-ore transport is an important aspect of solute movement, it was not the focus of
Ž .
this study. In addition, Ghodrati and Jury 1990 displayed some of the potential problems associated with core sampling during tracer or dye studies. Basically, local vertical and horizontal variability can be extreme. For this reason, only
Ž
elevated Br concentrations that had adjacent either in spatial — x, y, z or
.
directional tracer movement. These results could still be impacted by preferen-tial flowpaths, but we felt with our approach, this would be limited.
Bromide movement in the NW pedon showed that at 45 h, the Br had reached
Ž y1. Ž .
the 200 cm depth in the plot center 60 mg kg Fig. 7 . In this profile, there was little lateral tracer movement. However, at 65 cm east from the center at the 11-h sampling time at the 160 and 200 cm depths, very small amounts of Br
Ž
were detected. These depths were within the argillic horizon Bt1 and Bt2,
.
respectively of this NW pedon. Minor Br presence laterally from the center indicated a slight eastward lateral movement associated with the NW argillic horizon. This zone had large differences in matric potentials during rainfall events, and possessed marginally lower K . These tracer analyses support minors
lateral movement within the argillic horizon of this pedon. However, because observations of elevated Br concentrations laterally from the center were only detected at one sampling period, these data suggested limited movement.
Ž
In the SE plot, Br migrated to the 160-cm depth in the center after 45 h Fig.
. Ž y1.
8 , but concentrations were lower 6 mg kg than in the NW pedon,
Ž .
suggesting tracer was being retarded physically andror chemically in this pedon. There was a slight lateral solute migration in the 1-h sampling period in
Ž .
the north detected at 65 and 90 cm from the center and south directions
Ždetected at40 cm from center , at depths of 15 and 30 cm. Lateral Br movement.
in two directions in the 1st hour of sampling may indicate pulse spreading, and not unidirectional movement. This could be associated with vertical flow
Fig. 8. Bry concentrations in the soils at the center of the application plot during the August
simulation for the SE pedon.
Ž .
impedance caused by a traffic or plow pan. Similarly, Reuter et al. 1998 found lateral flow on a loess-derived hillslope was associated with Ap and Bw horizons, which was shallower in the profile than originally hypothesized. After the pulse had passed in the center during later times, no Br was detected laterally in these upper portions. In later time steps, Br was also detected
Ž . Ž . Ž
laterally to the south at the 60 Bt2 and 90 Bt3 cm depths after 17 60 and 90
. Ž .
cm and 45 h 90 cm . Amounts detected were small compared to the center pulse; -1.0% of the pulse was detected laterally. Thus, it is evident that only slight evidence of lateral migration of tracer was observed with these tracer analyses.
It was unclear why some of the slight lateral migration observed occurred in upper portions of the argillic horizon in the SE pedon. Certainly, preferential flowpaths could result in these observations. Another hypothesis might be that under unsaturated conditions, horizons that had higher K with respect to others
Ž .
horizons dominantly had lower calculated K h with respect to the rest of the
Ž .
profile. In this instance, the calculated K h for the Bt3 horizon was low as
Ž .
compared to the above and below horizons Fig. 9 . For example, at 17 h after
Ž .
rainfall application, the Bt2 matric potential 60 cm was y60.5 cm H 0, and2
Ž . Ž .
was y79.6 cm H 0 for the Bt22 rBt3 interface 90 cm . The K h at these matric potentials would be 3.6=10y4 cm hy1 for the Bt2, and 9.9=10y6 cm
y1 Ž .
h for the Bt2rBt3 interface using Bt3 data . Similarly, matric potentials at
Ž . Ž .
Ž . Ž .
Fig. 9. K h log scale curves for the Bt2, Bt3, and Bt4 horizons from the SE pedon.
Ž .
differences in K h . It is hypothesized that under unsaturated conditions, the Bt3 horizon was acting as a hydraulic impedance. It is possible that analyses at longer sampling times might have displayed lateral tracer movement at greater
Ž
depths in the SE pedon. Bromide concentrations in the center 120 and 160 cm
. Ž . Ž y1.
depth at these times 17 and 45 h were low 0.6 to 317.0 mg kg , thus any lateral movement of Br may have been below detection limits.
4. Conclusions
It is hypothesized that the reason for the relatively large effect of particle size on hydraulic properties was due to the lack of well-developed soil structure,
Ž
especially in upper horizons. Soil descriptions and breakthrough curves Shaw et
.
al., 2000 indicated a lack of well-developed structure in the upper portions of both profiles, with increasing structure development with depth.
Maximum changes in matric potentials associated with wetting fronts, inter-preted to indicate possible locations of perched water in these profiles, were
Ž
mainly associated with horizons of lower Ks 120 cm depth in the SE pedon,
.
160-cm depth in the NW pedon , even when K differences were not signifi-s
Ž .
160-cm depth Bt1 horizon , and coincided with depths where changes in matric potentials were maximal and Ks were lower. Minor amounts of lateral move-ment of tracer were detected at 60 and 90 cm in the SE pedon. Unlike the NW pedon, these depths do not correspond to maximal matric potential changes nor minimal K . It was not completely clear why lateral migration of tracer wass
observed at these depths. As mentioned above, because of the minor amounts
Ž .
observed preferential flow could impact observations. Alternatively, K h at tensions typical during redistribution events were lower in the Bt3 than the Bt2,
Ž .
so differences in K h might induce slight lateral flow. Data suggested the degree of flow impedance and lateral movement was slightly different between NW and SE soils. Monitoring of matric potentials suggested less deep
percola-Ž .
tion )3.5 m occurred in the loamier SE soils than the sandier NW soils. In this study, lateral movement of Br was small. We did observe evidence from changes in matric potentials that horizons of low Ks were acting as impeding layers, and it was apparent that lateral flow would ensue if gradients existed. Hydrologic modeling indicated lateral gradients of flow associated with the solum could occur on these landscapes. These and similar data could be used to develop more efficient irrigation strategies as well as predict areas more susceptible to accelerated groundwater contamination due to enhanced leaching.
References
Amoozegar, A., 1989. A compact constant-head permeameter for measuring saturated hydraulic conductivity of the vadose zone. Soil Sci. Soc. Am. J. 53, 1356–1361.
Anderson, M.G., Burt, T.P., 1990. Subsurface runoff. Process Studies of Hillslope Hydrology. Wiley, New York, pp. 365–400.
Ž .
Blake, R., Hartge, K.H., 1986. Bulk density. In: Klute, A. Ed. , Methods of Soil Analysis, Part 1: Physical and Mineralogical Methods, 2nd edn. Agron. Monogr. 9. ASA and SSSA, Madison, WI.
Blume, L.J., Perkins, H.F., Hubbard, R.K., 1987. Subsurface water movement in an upland Coastal Plain soil as influenced by plinthite. Soil Sci. Soc. Am. J. 51, 774–779.
Bosch, D.D., West, L.T., 1998. Hydraulic conductivity variability for two sandy soils. Soil Sci. Soc. Am. J. 62, 90–98.
Bosch, D.D., Hubbard, R.K., West, L.T., Lowrance, R.R., 1994. Subsurface flow patterns in a riparian buffer system. Trans. ASAE 37, 1783–1790.
Bruce, R.R., Whisler, F.D., 1973. Infiltration of water into layered field soils. Ecological Studies for Physics of Soil Water and Salts. pp. 78–89.
Butters, G.L., Cardon, G.E., 1998. Temperature effects on air-pocket tensiometers. Soil Sci. 163, 677–685.
Ž .
Cassel, D.K., Klute, A., 1986. Water potential: tensiometry. In: Klute, A. Ed. , Methods of Soil Analysis, Part 1: Physical and Mineralogical Methods, 2nd edn. Agron. Monogr. 9. ASA and SSSA, Madison, WI.
Gaskin, J.W., Dowd, J.F., Nutter, W.L., Swank, W.T., 1989. Vertical and lateral components of soil nutrient flux in a hillslope. J. Environ. Qual. 18, 403–410.
Ghodrati, M., Jury, W.A., 1990. A field study using dyes to characterize preferential flow of water. Soil Sci. Soc. Am. J. 54, 1558–1563.
Hicks, D.W., McConnell, J.B., Hubbard, R.K., 1991a. Effect of the unsaturated zone on the migration and retardation of a conservative tracer at the Plains, Georgia Research site. In: US Geological Survey, Water-Resources Investigations Report 91-88.
Hicks, D.W., McConnell, J.B., Asmussen, L.E., Leonard, R.A., Smith, C.N., 1991b. Movement and fate of agricultural chemicals in the surface and subsurface environments near Plains, Southwestern Georgia-Integrated Work Plan. US Geological Survey, Open-File Report 91-73. Jury, W.A., Gardner, W.R., Gardner, W.H., 1991. Soil Physics. Wiley, 328 pp.
Katul, R., Todd, G.P., Pataki, D., 1997. Soil water depletion by oak trees and the influence of root water uptake on the moisture content spatial statistics. Water Resour. Res. 33, 611–623. Kilmer, V.J., Alexander, L.T., 1949. Methods of making mechanical analysis of soils. Soil Sci.
68, 15–24.
Klute, A., Dirksen, C., 1986. Hydraulic conductivity and diffusivity: laboratory methods. In:
Ž .
Klute, A. Ed. , Methods of Soil Analysis, Part 1: Physical and Mineralogical Methods, 2nd edn. Agron. Monogr. 9. ASA and SSSA, Madison, WI.
Kung, K.J., 1990a. Preferential flow in a sandy vadose zone: 1. Field observation. Geoderma 46, 51–58.
Kung, K.J., 1990b. Preferential flow in a sandy vadose zone: 2. Mechanism and implications. Geoderma 46, 59–71.
Lappala, E.G., Healy, R.W., Weeks, E.P., 1993. Documentation of computer program VS2DT to solve the equations of fluid flow in variably saturated porous media. USGS Report 83-4099, Denver, CO.
Leonard, R.A., Marti, L.R., Hicks, D.W., McConnell, J.B., 1993. Fate and transport of Atrazine at the Plains, Georgia, Ground Water Study Site, unpublished.
McDonnell, J.J., 1990. A rationale for old water discharge through macropores in a steep, humid catchment. Water Resour. Res. 26, 2821–2832.
Nyberg, L., 1995. Water flow path interactions with soil hydraulic properties in till soil at Gardsjon, Sweden. J. Hydrol. 170, 255–275.
Pilkinton, J.A., 1974. Soil Survey of Schley and Sumter Counties, Georgia. United States Department of Agriculture in cooperation with the University of Georgia, Agricultural Experi-ment Station.
Reuter, R.J., McDaniel, P.A., Hammel, J.E., Falen, A.L., 1998. Solute transport in seasonal perched water tables in loess-derived soilscapes. Soil Sci. Soc. Am. J. 62, 977–983.
Ross, D.S., Bartlett, R.J., Magdoff, F.R., Walsh, G.J., 1994. Flow path studies in forested watersheds of headwater tributaries of Brush Brook, Vermont. Water Resour. Res. 30, 2611–2618.
Seyfried, M.S., 1991. Infiltration patterns from simulated rainfall on a semiarid rangeland soil. Soil Sci. Soc. Am. J. 55, 1726–1734.
Shaw, J.N., West, L.T., Radcliffe, D.E., Bosch, D.D., 2000. Preferential flow and pedotransfer functions for transport properties in sandy Kandiudults. Soil Sci. Soc. Am. J., in press. Shaw, J.N., West, L.T., Truman, C.C., Radcliffe, D.R., 1997. Morphologic and hydraulic
properties of soils with water restrictive horizons in the Georgia Coastal Plain. Soil Sci. 162, 875–885.
Soil Survey Staff, 1996. National Soil Survey Handbook. USDA-Natural Resources Conservation Service, National Soil Survey Center, Lincoln, NE.
van Genuchten, M.T., 1980. A closed form equation for predicting the hydraulic conductivity of unsaturated soil. Soil Sci. Soc. Am. J. 44, 89–898.
Wilson, G.V., Jardine, P.M., O’Dell, J.D., Collineau, M., 1993. Field-scale transport from a buried line source in variably saturated soil. J. Hydrol. 145, 83–109.
Wilson, G.V., Jardine, P.M., Luxmoore, R.J., Zelazny, L.W., Lietzke, D.A., Todd, D.E., 1991. Hydrogeochemical processes controlling subsurface transport from an upper subcatchment of Walker Branch watershed during storm events: 1. Hydrologic transport processes. J. Hydrol. 123, 297–316.