Summary Ten-year-old ‘Tai So’ lychee (Litchi chinensis Sonn.) trees growing on a sandy loam soil in subtropical South Africa (latitude 25° S) were watered weekly (well-watered treatment) or drought-treated from late July until January (drought treatment). After 16 weeks, at which time the trees obtained most of their water from below 150 cm, average soil water content at 0 to 150 cm depth was 14.5 ± 0.1% in the well-watered treatment and reached a minimum of 7.6% in the drought treatment. At Week 7, minimum leaf water potential (ΨL) in the morning and early afternoon declined to −2.6 and −2.8 MPa, respectively, in drought-treated trees compared with −1.5 and −2.2 MPa, respectively, in well-watered trees. From Week 9, stomatal conductance and net CO2 assimilation rate
ranged from 70 to 300 mmol m−2 s−1 and 3 to 13 µmol CO2
m−2 s−1, respectively, in well-watered trees. The corresponding
values for drought-treated trees were 50 to 180 mmol m−2 s−1 and 2 to 6 µmol CO2 m−2 s−1. Five weeks after rewatering the
drought-treated trees, gas exchange had not recovered to the rate in well-watered trees, although tree water status recovered within a week of rewatering. In the well-watered trees, water use (Et) was 26 ± 1 mm week−1 with evaporation (Ep) of 20 to
70 mm week−1 indicating a crop factor (k
c= Et/Ep) of 0.4 to 1.2.
Before anthesis, tree water status did not affect extension growth of floral panicles or leafy shoots. In contrast, no vege-tative shoots were initiated after fruit set in the drought-treated trees when ΨL in the morning declined to −2.5 MPa. Water
deficits reduced initial fruit set by 30% and final fruit set by 70% as a result of fruit splitting (41.2 ± 4.0% versus 10.0 ± 1.3%). Water deficits did not alter the sigmoidal pattern of fruit growth, but reduced yield from 51.4 ± 5.5 kg tree−1 in well-wa-tered trees to 7.4 ± 3.3 kg tree−1 in drought-treated trees.
Keywords: fruit growth, fruit retention, irrigation, leaf water potential, photosynthesis, soil water content, stomatal conduc-tance, water use.
Introduction
The lychee (Litchi chinensis Sonn.) is a rain forest species native to southern China and northern Vietnam (Menzel and Simpson 1990). In a greenhouse experiment with potted plants of cv. ‘Wai Chee,’ net CO2 assimilation (A) declined as midday
leaf water potential (ΨL) fell below −1.0 MPa and approached
zero at a ΨL of about −4.0 MPa when plants wilted
(Chaikiat-tiyos et al. 1994). In contrast, Roe et al. (1995) showed that, in container-grown plants of cv. ‘Tai So,’ A was unaffected until ΨL declined below a threshold of about −1.0 to −2.0 MPa and
was negligible when ΨL fell below −3.0 MPa.
The difference in response of A to drought between the plants cited above may be related to differences in available soil water. Lychee roots can be found to a depth of 100 cm or more in some soils (Batten et al. 1994), although most roots are found in the 0 to 60 cm horizon (Menzeletal.1990). However, the depth where most of the roots are located may not neces-sarily be a good indication of the potential for water extraction (e.g., Batten et al. 1994). For irrigation purposes, Bredell (1971) suggested a crop factor (kc =
evapotranspiration/evapo-ration from a pan, or Et/Ep) of 0.85 for lychee plants with a
calculated water use ranging from 18 mm week−1 in June to 45 mm week−1 in January.
To obtain a better understanding of the effects of soil water deficits on the growth and fruit yield of lychee, we studied the effects of water deficits on water relations, CO2 assimilation,
growth and yield of field-grown trees. Soil water extraction from different horizons and the relationship between tree water use and potential water loss as indicated by evaporation from a Class Apan were also examined. Our first hypothesis was that the trees would dry out slowly in the field and that fruit yield would only be reduced if the trees experienced a severe water deficit well before harvest. We also investigated the relationship between CO2 assimilation and leaf water potential
in response to gradual drought stress. Finally, we tested the hypotheses that water uptake would be mainly from the upper soil zones with high root densities and that water use would follow potential water loss as indicated by the Class Apan.
Water deficits at anthesis reduce CO
2
assimilation and yield of lychee
(
Litchi chinensis
Sonn.) trees
C. M. MENZEL,
1J. H. OOSTHUIZEN,
2D. J. ROE
2,3and V. J. DOOGAN
41 Maroochy Horticultural Research Station, Queensland Department of Primary Industries, P.O. Box 5083, SCMC, Nambour,
Queensland 4560, Australia
2 Institute for Tropical and Subtropical Crops, Private Bag X11208, Nelspruit 1200, South Africa
3 Current address: Merensky Technological Services, P.O. Box 14, Duiwelskloof 0835, South Africa
4 Biometry, Queensland Department of Primary Industries, P.O. Box 46, Brisbane, Queensland 4001, Australia
Received August 9, 1994
Materials and methods
Site description and treatments
The study was initiated in July 1992 on 10-year-old ‘Tai So’ (‘Mauritius’) lychee trees growing at a spacing of 10 × 10 m at Nelspruit in subtropical South Africa (latitude 25° S). The soil was a sandy loam overlying a sandy clay loam with weathered rock at 120 to 150 cm. Bulk density was 1.5 to 1.6 g cm−3 except at 150 cm where it was 2.0 g cm−3 due to rocks in the lower horizon. Average soil water content (θ) from 0 to 150 cm was 17.6% at field capacity (soil water potential = ΨS = −0.01
MPa). Available water in the 0 to 150 cm profile from field capacity to a ΨS of −0.03 MPa was 71 mm and rose to 113 mm
at a ΨS of −0.10 MPa.
There were two treatments with eight trees per treatment: well-watered plots were irrigated weekly to replace Et and
bring the profile close to field capacity (16.0%), and drought-treated plots were allowed to dry out slowly from just after panicle emergence on July 28 (Week 1) until 4 weeks after fruit harvest on Week 26 when they were rewatered. Because the well-watered plots were not irrigated beyond field capacity (θ = 17.6%), there was essentially no free drainage below 150 cm. Trees were irrigated with two microsprinklers per tree deliver-ing 6 mm h−1. To exclude rainfall from both plots, plastic sheets were placed over the soil to a distance of about 1 m from the outside edge of the canopy and 30 cm deep ditches were constructed to drain excess water away from the trees. The plastic sheets also prevented evaporation from the soil surface. The trees were fertilized and subjected to the same pest control treatments as commercial crops (Anonymous 1992). From June to mid-July, irrigation was withdrawn from both groups of trees until average θ fell to about 8% to induce flowering. The trees were then rewatered until the profile returned to close to field capacity.
Soil water content
Soil water content was measured weekly with a Campbell Pacific neutron probe (CPN 503, CP, Pacheco, CA) from 15 to 135 cm at 15-cm intervals, with one access tube halfway between the trunk and drip line of each tree. Soil cores were extracted to a depth of 120 cm from a well-watered and a drought-treated site to give a range of θ values (v/v) between 2 and 23% for calibration of the count ratios (n) obtained from the neutron probe. The soil samples were oven dried at 105 °C to determine gravimetric water content, drought bulk density and volumetric water content. The relationship between count ratio and soil water content for the profile was:
θ=20.732n− 3.406 (r2= 91%, P< 0.001).
Water use (Et) in the well-watered plots was calculated from
the change in average θ from 0 to 150 cm each week, assuming no free drainage below 150 cm. Periods when there was some wetting of the profile after heavy rainfall were excluded from the analysis.
Tree water status, stomatal conductance and net CO2
assimilation rate
Leaf water potential (ΨL) of a single leaf per tree was measured
on the shaded side of each tree at 0900 h and on the sunlit side of each tree at 1400h with a pressure chamber (Ritchie and Hinckley 1975). Samples were taken weekly (only from Week 5 for the afternoon sampling) until rewatering (Week 26), when they were taken twice each week. Stomatal conduc-tance (gs) and net CO2 assimilation rate (A) were measured
with an LI-6200 photosynthesis meter (Li-Cor Inc., Lincoln, NE) connected to a 1-liter cuvette. Measurements were made weekly (twice each week after Week 26) at 0900 h on a single mature sunlit leaf behind the flower panicle or new growth from each tree. Photosynthetic photon flux density (PPFD) during the measurements of ΨL, gs and A fluctuated widely
depending on cloud cover, but on clear days increased from about 1000 to 1500 µmol m−2 s−1. Similarly, temperatures at 0900 and 1400 h on clear days ranged from about 10 to 25 and 20 to 35 °C, respectively. These differences were matched by fluctuations in vapor pressure deficit (VPD) (0.1 to 3.0 kPa at 0900 h and 0.7 to 4.8 kPa at 1400 h) and Ep (2 to 12 mm day−1).
On four occasions during the drought cycle in September, October, December and January (Weeks 9, 12, 19 and 25), diurnal measurements were made of ΨL, gs and A on two sunlit
leaves behind the flower panicle on each of three well-watered and three drought-treated trees.
Growth measurements and leaf nutrient concentrations
Weekly measurements were made of the increase in length of floral panicles and new leafy shoots on 10 shoots per tree. Every 1 to 2 weeks, from about 1 week after last male flower opening and 3 weeks after female flowering, we recorded the number of intact and split fruit on 15 panicles per tree. Ten fruits were also harvested weekly from each tree for skin, seed, aril and total fruit fresh weights. At harvest, a record was kept of the yield of each tree, and sugar and acid contents in the aril from a 1 kg sample per tree. Relative growth rate (RGR) of total fruit and its components was calculated as follows:
RGR =(lnW2− lnW1)/(t2−t1),
where W2 is fruit weight for Week 2 (t2), and W1 is fruit weight
for Week 1 (t1).
Leaves were collected after fruit set from behind the fruiting cluster and used to determine nutrient concentrations as de-scribed by Koen et al. (1981).
Experimental design and data analyses
Treatments were arranged in eight randomized blocks with single tree plots. Volumetric soil water content was analyzed by split-plot analysis of variance (main plot irrigation treat-ment, split for weeks then split for depths). Mean θ and ΨL in
the morning and in the afternoon, gs and A were analyzed by
total fruit weights, RGR of seed, skin, aril and total fruit, and proportion of fruit split were analyzed by split-plot analysis of variance (main plot irrigation treatment, split for weeks). Yield and sugar/acid were analyzed by one-way analysis of variance.
Results Weather
Mean monthly weather conditions from July 1992 to February 1993 approximated the long-term averages for Nelspruit. The exceptions were in November (76 versus 114 mm) and January (62 versus 129 mm) when rainfall was lower than average. Mean daily maximum and minimum temperatures ranged from 24 to 31 °C and from 6 to 19 °C, respectively, and irradiance ranged between 13.8 and 22.6 MJ m−2 day−1. Total rainfall was 446 mm and total Class A pan evaporation was 1272 mm.
Soil water content
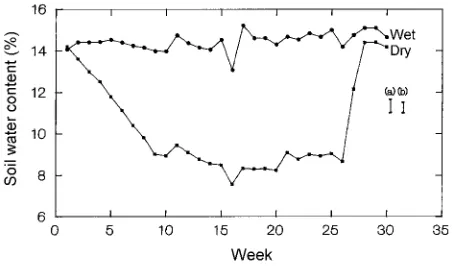
The average soil water content (θ) from 0 to 150 cm depth in the well-watered plots was 14.5 ± 0.1% (Figure 1). In the drought-treated plots, θ declined from 14.2% at Week 1 to 8.9% at Week10, and it was 7.6 to 9.5% from Weeks 11 to 26. Drought-treated plots were rewatered at Week 26, but θ took 2 weeks to recover because it was not possible to apply suffi-cient water in a single application to bring the profile close to that of the well-watered plots. Average θ generally decreased with soil depth, with the difference between the treatments greatest at soil depths of 15, 30 and 135 cm and least at soil depths of 75 and 90 cm (Figure 2a). Although there was no significant (P > 0.05) difference in soil water extraction in the drought-treated plots by depth over time, there was a trend of greater water extraction at shallow depths early in the season (Figure 2b). Soil water contents at soil depths of 15, 45, 75, 105 and 135 cm were used to calculate maximum soil water extraction in the drought-treated plots at 30-cm intervals from Weeks 1 to 16 when net depletion was 126 mm. Soil water was
extracted from all depths, with 28% extracted from 0to30 cm, 23% from 30 to 60 cm, 17% from 60 to 90 cm, 19% from 90 to 120 cm, and 13% from 120 to 150 cm.
Tree water status
In the well-watered trees, leaf water potential (ΨL) at 0900 h
ranged between −0.6 and −1.5 MPa (Figure 3). There was more variation in the early afternoon than at 0900 h, with ΨL
ranging from −0.6 to −2.2 MPa. At 1400 h, there was a strong relationship between ΨL and VPD for sunlit leaves (ΨL = −2.0192 − 0.0065 VPD + 2.9316 exp(−VPD), r2 = 71%, P <
0.001), whereas the relationship was weak for shaded leaves (r2 = 32%, P < 0.01). Leaf water potential in the drought-treated trees ranged from −0.8 to −2.6 MPa at 0900 h and from −0.9 to −2.8 MPa at 1400 h (Figure 3). The difference in tree water status between the well-watered and drought treatments increased from Week 7 to Week 20 when ΨL was about 1.0
MPa lower in the drought-treated trees than in the well-wa-tered trees. There was a slow decline in ΨL as average θ fell
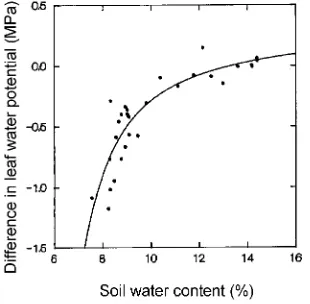
from 14.5 to 9.8%, and then a more rapid decline below 9.8% (Figure 4). The rapid decline in ΨL occurred when the trees had
used about two-thirds of the available water. Leaf water poten-tial of drought-treated trees recovered within a week of rewa-tering to the values observed in well-watered trees (Figure 3). Figure 1. Change in average soil water content in well-watered and
drought-treated plots over 30 weeks. Drought-treated trees were rewa-tered at Week 26. Data are the means of eight trees per treatment from 0 to 150 cm depth. Vertical bars indicate LSD (P = 0.05) comparing well-watered and drought means (a) and comparing means within well-watered and drought treatments (b).
Stomatal conductance and net CO2 assimilation rate
At Week 10, net CO2 assimilation rate (A) in the well-watered
and drought-treated trees ranged from 3 to 13 µmol CO2 m−2
s−1 and 2 to 6 µmol CO2 m−2 s−1, respectively (Figure 5).
Stomatal conductance (gs) followed the pattern of A (data not
shown) and ranged from 70 to 250 mmol m−2 s−1 and 50 to 180
mmol m−2 s−1 in the well-watered and drought-treated trees, respectively. At ΨL values below −2.0 MPa, gs of
drought-treated trees was about half of maximum gs, whereas A
de-clined to a quarter of its maximum value as ΨL fell to −2.5 MPa
(Figure 6). In the drought-treated trees, leaf gas exchange had not recovered fully 5 weeks after rewatering at Week 26 (Fig-ure 5), although tree water status recovered within a week (Figure 3).
Diurnal measurements
Maximum PPFD was about 1800 µmol m−2 s−1, maximum temperatures ranged from 29 to 36 °C, and maximum VPD ranged between 3.2 and 5.4 kPa. Average θ in the drought treatment was 8.3 to 9.1%.
Leaf water potential of trees in the well-watered plots was about −0.2 MPa at predawn, declined to −1.7 to −2.1 MPa in the early afternoon, and recovered to about −0.6 MPa in the late afternoon. In drought-treated trees, ΨL at dawn ranged
from −0.4 to −0.8 MPa, whereas minimum ΨL in the afternoon
ranged between −2.2 and −2.8 MPa. In September and Octo-ber, ΨL in drought-treated trees was about 0.5 MPa lower than
in well-watered trees for most of the day, and 1.2 MPa lower in the late afternoon. A similar pattern occurred in December, although there was a greater difference between the well-wa-tered and drought-treated trees after 1500 h when the weather was overcast. In January, ΨL of drought-treated trees was a
maximum of 0.3 MPa lower than in well-watered trees from 0500 to 1700 h, and 0.6 MPa lower at 1830 h.
Stomatal conductance in well-watered trees was maximal at 0800 h in September and October, maximal at 0700 h in December and January, and ranged between 150 and 250 mmol m−2 s−1. Stomatal conductance declined by about 50% during the middle part of the day, and there was sometimes a Figure 3. Change in leaf water potential (ΨL) at 0900 and 1400 h in
well-watered and drought-treated trees over 31 weeks. Difference in
ΨL between well-watered and drought-treated trees (ΨL well-watered
−ΨL drought) at 0900 h is also shown. Drought-treated trees were
rewatered at Week 26. Data are the means of eight trees per treatment; FS = fruit set, H = harvest. Vertical bars indicate LSD (P = 0.05).
Figure 4. Relationship between difference in leaf water potential between well-watered and drought treatments (ΨL well-watered −ΨL
drought) at 0900 h and average soil water content (θ) from 0 to 150 cm. Data are the means of eight trees. Regression is: ΨL well-watered
−ΨL drought = 0.3131 − 55.1599/θ2− 1067.0400 exp(−θ) (r2 = 77%,
P < 0.001).
Figure 5. Change in net CO2 assimilation rate (A) in well-watered and
slight recovery in the late afternoon. Stomatal conductance values in drought-treated trees were on average about half of those in well-watered trees during the sunlit hours. Net CO2
assimilation generally followed the pattern of gs, with
maxi-mum values in well-watered trees at 0700 or 0800 h of 8 to 12 µmol CO2 m−2 s−1. Average values in the drought-treated trees
were about half of those in the well-watered trees.
Tree water use
Tree water use in the well-watered plots was 26 ± 1 mm week−1 over a range in Ep of 20 to 70 mm week−1 (data not presented).
The crop factor (kc = Et/Ep) varied from 0.4 to 1.2 with no
seasonal trend, but decreased with increasing Ep (Figure 7).
Growth and yield
Increases in the lengths of leafy and floral shoots over time were sigmoidal (r2 = 99%, P < 0.001), but were not signifi-cantly (P > 0.05) affected by the drought treatment. In contrast, in early November about 4 weeks after fruit set, 15.6 ± 2.7% of terminal branches initiated vegetative shoots in the well-wa-tered treatment, whereas no vegetative shoots were initiated in the drought treatment. The drought-treated trees had fewer fruit than the well-watered trees at all sampling periods (data not presented). Water deficits reduced initial fruit set (14.1 ± 1.8 versus 21.0 ± 1.1 fruit per panicle) and final set at harvest (2.0 ± 0.5 versus 7.0 ± 0.3 fruit per panicle). Water deficits also increased the rate of fruit splitting at Weeks 21 (55.3 ± 9.4% versus 13.0 ± 1.4%) and 22 (41.2 ± 4.0% versus 10.0 ± 1.3%).
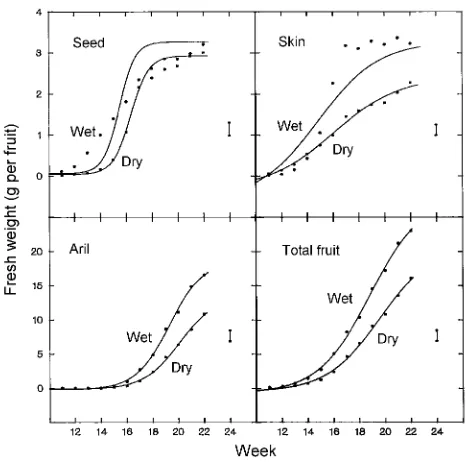
Water deficits did not shift the sigmoidal pattern of fruit development (r2 = 99%, P < 0.001), but reduced seed weight from Week 15 to 21, and skin, aril and total fruit weights from Week 13, Week 17 and Week 16, respectively (Figure 8). Water deficits reduced final fruit weight (16.2 ± 1.3 g versus 23.0 ± 0.3 g) mainly due to a reduction in skin and aril weights. Seed weight in drought-treated trees was about 90% of that in well-watered trees. There was also a lower proportion of aril in fruit harvested from drought-treated trees than from well-wa-tered trees (66.9 ± 0.9% versus 72.0 ± 0.6%). There was no effect of water deficits on RGR of the skin and only small Figure 6. Relationship between the ratios gs drought/gs well-watered
and A drought/A well-watered and ΨL in the drought treatment at 0900 h. Data are the means of eight trees during the drought cycle (Weeks 1 to 26). Regressions are: gs drought/gs well-watered = 0.5550
+ 0.6329/(1 + exp(−(ΨL + 1.0232)/0.1798)) (r2 = 68%, P < 0.001), and A drought/A well-watered = 0.0817 + 1.8046/(1 + exp(−(ΨL +
0.8471)/0.8321)) (r2 = 69%, P < 0.001).
Figure 7. Relationship between crop factor (kc) for well-watered
treat-ment and evaporation from Class Apan (Ep). Data are the means of eight trees and exclude periods after heavy rainfall when there was wetting of the profile. Regression is: kc = 0.3661 + 3.0481 exp
(−Ep/16.1473) (r2 = 64%, P < 0.001).
effects on the seed and aril (data not presented), indicating that the differences between treatments were largely established at the time when measurements began. Yield was 51.4 ± 5.5 kg tree−1 in the well-watered plots compared with 7.4 ± 3.3 kg tree−1 in the drought-treated plots, whereas sugar/acid was about 64/1 in both treatments. drought-treated trees than in leaves from well-watered trees. In contrast, there was no effect of drought on the concentration of other nutrients (data not presented). The concentrations of all nutrients were in the range for healthy high-yielding lychee trees, except for K which was low in both treatments.
Discussion
Our results do not support the hypothesis that increased fruit set in drought-treated lychee trees is a result of reduced com-petition with leaf flushes (Batten et al. 1994). Batten et al. (1994) found that drought-treated ‘Bengal’ lychee trees had almost twice the number of fruit of trees irrigated weekly, although fruit size was reduced by 16%. The discrepancy between our results and those of Batten et al. (1994) may be accounted for by differences in experimental design that re-sulted in the trees in our study being subjected to an earlier, longer and more severe water deficit.
Water use
Water extraction became proportionally greater in the deeper soil layers as the surface water contents (Figure 2b) and pre-sumably hydraulic conductivity decreased, although only 13% of the water extracted came from the 120 to 150 cm horizon. It was not possible to monitor soil water below 150 cm because of large rocks in the lower horizons.
Potential evapotranspiration as indicated by Ep fluctuated
widely. Tree water loss did not increase with increasing Ep and
potential evapotranspiration (Figure 7), presumably as a result of partial closure of the stomata. Thus, our hypothesis that Et
would increase with increasing Ep was not substantiated. There
was no seasonal trend in kc which was not appreciably higher
during the period of maximum fruit growth.
Tree water status and CO2 assimilation
The trees dried out slowly (Figure 3) even though they were growing in a sandy soil with low average water-holding capac-ity, and ΨL only began to fall rapidly after Week 10 when
average θ fell below 9.8% and water extraction did not match transpiration (Figure 4). The rapid decline in ΨL occurred
when the trees had used about two-thirds of the available soil water from 0 to 150 cm. In contrast, in pot experiments with ‘Tai So,’ trees wilted after 1 week without water in a sandy soil, and after 3 weeks without water in a clay soil (Roe et al. 1995). Because the trees dried out slowly, A did not respond
imme-diately as water was withdrawn (Figure 5), but only began to decline 10 weeks after water was withdrawn. Net CO2
assimi-lation was about 25% of maximum values when ΨL declined
to about −2.5 MPa (Figure 6). Averaged across the season, A in drought-treated trees was only half of that in well-watered trees. The drought treatment had a long-term effect on the leaves, because A (and gs) had not recovered 5 weeks after
rewatering, even though tree water status recovered within a week.
Plant growth
There was no effect of the drought treatment on growth of the floral panicles and leafy shoots before anthesis. In contrast, no new vegetative shoots were initiated in late October when morning ΨL fell to −2.5 MPa. Thus, leaf growth was
elimi-nated and CO2 assimilation was reduced after fruit set. Water
deficits reduced fruit set to about two-thirds of the rate in well-watered trees. The difference in fruit set between the two treatments was maintained throughout the fruit growth period, but it increased at harvest as a result of increased fruit splitting in the drought-treated trees. By harvest, 86% of fruit present at the start of the sampling had dropped off the drought-treated trees compared with 68% from the well-watered trees.
Fruits from drought-treated trees were only two-thirds of the size of those from well-watered trees (Figure 8). They also had a lower proportion of aril and thus were unmarketable. In contrast, there was only a small effect of drought on RGR of the fruit, indicating that the differences between treatments were largely established at the time when measurements began 1 week after the last male flower anthesis and 3 weeks after the last female flower anthesis. Water deficits reduced the size of the aril possibly by retarding early seed and skin growth. This conclusion is supported by data collected by Huang and Qui (1987) who showed that aril growth was partially linked to the growth of the skin and seedcoat in ‘Kwai May’ lychee. The lychee aril is initiated as an outgrowth of the young outer seedcoat about 7 weeks after anthesis of the female flowers (Steyn and Robbertse 1992). In the drought-treated plants, fruit splitting occurred after a period of light rainfall and high humidity but in the absence of a significant increase in avail-able soil water.Compared with the drought-treated trees, fluc-tuations in tree water status of the well-watered trees were much less and so was the incidence of fruit splitting.
Acknowledgments
Western Australia, and Yan Diczbalis, Northern Territory Department of Primary Industries and Fisheries, are gratefully acknowledged.
References
Anonymous. 1992. The cultivation of litchis. Bull. Agric. Res. Council South Africa, No. 425, 61 p.
Batten, D.J, C.A. McConchie and J. Lloyd. 1994. Effect of soil water deficit on gas exchange and water relations of orchard lychee (Litchi chinensis Sonn.) trees. Tree Physiol. 14:1077--1089.
Bredell, G.S. 1971. Water use of some subtropical fruit trees. Citrus Grower Subtrop. Fruit J. 456:15--19.
Chaikiattiyos, S., C.M. Menzel and T.S. Rasmussen. 1994. Floral induction in tropical fruit trees: effects of temperature and water supply. J. Hortic. Sci. 69:397--415.
Huang, H.B. and Y.X. Qui. 1987. Growth correlations and assimilate partitioning in the arillate fruit of Litchi chinensis Sonn. Aust. J. Plant Physiol. 14:81--88.
Koen, T.J., W. Langenegger and G. Smart. 1981. Determination of the fertiliser requirements of litchi trees. Inform. Bull. Citrus Subtrop. Fruit Res. Inst. 103:9--12.
Menzel, C.M., R.L. Aitken, A.W. Dowling and D.R. Simpson. 1990. Root distribution of lychee trees growing in acid soils of subtropical Queensland. Aust. J. Exp. Agric. 30:699--705.
Menzel, C.M. and D.R. Simpson. 1990. Performance and improve-ment of lychee cultivars: a review. Fruit Varieties J. 44:197--215. Ritchie, G.A. and T.M. Hinckley. 1975. The pressure chamber as an
instrument for ecological research. Adv. Ecol. Res. 9:165--255. Roe, D.J., J.H. Oosthuizen and C.M. Menzel. 1995. Rate of soil
droughting and previous water deficits influence the relationship between CO2 assimilation and tree water status in potted lychee
(Litchi chinensis Sonn.). J. Hortic. Sci. 70:15--24.