Full Terms & Conditions of access and use can be found at
http://www.tandfonline.com/action/journalInformation?journalCode=cbie20
Bulletin of Indonesian Economic Studies
ISSN: 0007-4918 (Print) 1472-7234 (Online) Journal homepage: http://www.tandfonline.com/loi/cbie20
Foreign direct investment and growth in East Asia:
lessons for Indonesia
Robert E. Lipsey & Fredrik Sjöholm
To cite this article: Robert E. Lipsey & Fredrik Sjöholm (2011) Foreign direct investment and growth in East Asia: lessons for Indonesia, Bulletin of Indonesian Economic Studies, 47:1, 35-63 To link to this article: http://dx.doi.org/10.1080/00074918.2011.556055
Published online: 15 Mar 2011.
Submit your article to this journal
Article views: 1893
View related articles
ISSN 0007-4918 print/ISSN 1472-7234 online/11/010035-29 © 2011 Indonesia Project ANU DOI: 10.1080/00074918.2011.556055
* We are grateful for comments and suggestions by Chris Manning and two anonymous referees. Jing Sun and Takuya Hasebe have provided excellent research assistance. Fredrik Sjöholm gratefully acknowledges inancial support from the Torsten and Ragnar Söder-berg Foundation.
‘Indonesia in Comparative Perspective’ Series
FOREIGN DIRECT INVESTMENT AND GROWTH
IN EAST ASIA: LESSONS FOR INDONESIA
Robert E. Lipsey* Fredrik Sjöholm*
National Bureau of Economic Research Research Institute of Industrial Economics,
and City University of New York Stockholm, and Örebro University
Foreign direct investment (FDI) has been important in the growth and global in-tegration of developing economies. Both Northeast and Southeast Asia, especially the latter, have been part of this development, with increasing inlows of FDI and greater foreign participation in local economies. However, Indonesia has been an outlier within the region. Inlows of FDI have been lower to Indonesia than to other countries, especially in manufacturing, and they have been lower than could be expected from Indonesia’s size, population and other country characteristics. We show that the inlows that have occurred have beneited Indonesia, and use the East Asian experience to identify measures that are likely to increase these lows. A rela-tively poor business environment, ineficient government institutions, low levels of education and poor infrastructure all seem to be important explanations for the low inlows of FDI to Indonesia.
INTRODUCTION
Foreign direct investment (FDI) has been a key aspect of increased globalisation in recent decades. Growth in FDI has been higher than growth in international trade. Multinational irms have come to account for about 10% of world output and 30% of world exports, and these irms develop and control a large share of new technologies (Jungnickel 2002).
FDI has played, and continues to play, a large role in Asian development. China is one of the world’s largest recipients of FDI and Japan is a major source. Some countries in the region, such as Singapore, have based much of their develop-ment strategy on reliance on foreign multinational enterprises (MNEs). Finally, East Asia is a prime home to the vertically integrated cross-country production networks of MNEs, in which different afiliates of a irm produce different parts and components, and others import and assemble them.
branches of the MNE, and coordination and supervision require visits by staff and a steady low of information. It is clear that the complexity of operations across national borders places large demands on the host country economic environ-ment. Countries differ in their ability to attract and handle FDI, which depends on characteristics such as infrastructure, trade regimes, labour force skills and institutional quality.
It should therefore come as no surprise that inlows of FDI differ substantially among countries in East Asia. FDI lows to Indonesia have been relatively mod-est, and lower than would be expected from the country’s size. This paper seeks to explain the low inlows of FDI by relating Indonesia’s experience to that of other countries in the region. East Asia’s heterogeneity provides an opportunity to identify and evaluate the determinants of FDI. What factors are typically most important in explaining FDI inlows into East Asia?
The paper offers an overview of FDI in East Asia (Northeast and Southeast Asia) and discusses its main determinants.1 We analyse FDI inlows to Indonesia by comparing actual inlows with those that could be predicted from Indonesia’s country characteristics. A literature survey identiies the main effects of FDI on the Indonesian economy. The evidence from the studies surveyed leads us to con-clude that Indonesia would beneit from higher FDI inlows. We use our analysis of the determinants of FDI in East Asia to suggest policy strategies that are likely to increase inlows of FDI to Indonesia. The paper ends with some conclusions about the main obstacles to more rapid economic growth in Indonesia, and espe-cially to growth fuelled by inward FDI.
While the aggregate FDI data analysed in the irst part of the paper cover all industries, our analyses of the effects of FDI focus on manufacturing, for several reasons. First, manufacturing FDI in Indonesia and elsewhere has been studied more intensively than FDI in other industries. Second, data on manufacturing are much stronger than data on the service industries. Third, while studies of FDI in mining, including petroleum, are relatively numerous, Indonesia is an outlier in East Asia in terms of the importance of mining, and few comparisons can be made with other countries in the region for this industry.
FDI IN THE GROWTH OF DEVELOPING EAST ASIA
The three main regions of the developing world, Asia (other than Japan), Latin America and Africa, have fared very differently since the middle of the 20th century. As late as four decades ago, Latin America had the highest per capita income, there was a good deal of optimism about Africa, and Asia was far behind Latin America. By the early 2000s, Northeast Asian countries had largely caught up with Latin America, and Southeast Asian countries were not far behind – indeed, some of the latter had even outstripped Latin America. Incomes in both
Northeast and Southeast Asian countries far surpassed those in Africa by this time.2
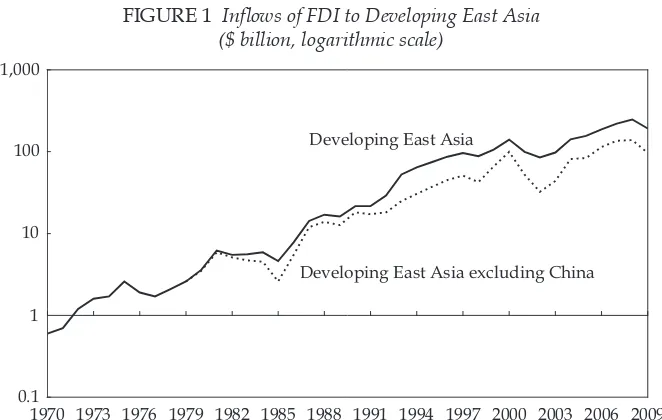
Most studies ind FDI to have been a source of the rapid growth in East Asia.3 That has been the case for most of the countries in the region, although less so and later for the Republic of Korea (hereafter ‘South Korea’) and Taiwan; they initially followed the Japanese model of placing restrictions on foreign-controlled irms, and only after 1990 began catching up with the rest of the region in receptiveness to FDI. Inlows of FDI to East Asia have been rising since the 1970s, with interrup-tions. They accelerated after the opening of China around 1990 (igure 1). The rise in inlows was set back briely in the mid-1970s, again in the mid-1980s and by the 1997–98 Asian inancial crisis, and then once more in the early 2000s by the troubles of the information technology industry, a major beneiciary of FDI capital inlow. The inancial crisis that began in 2008 has left its mark: inlows declined in 2009, but remained close to their highest levels to that point.
A crude measure of the role of inward FDI is the ratio of the inward stock of FDI to GDP, shown for selected East Asian countries in table 1. East Asia became a major destination for lows of FDI well before other developing regions did. The gross inward stock of FDI in 1980, for example, was about 42% of GDP in North-east Asia and 9% in SouthNorth-east Asia; it was 10% in Africa but only 5% in Latin America. By 1995, Southeast Asia had surpassed Northeast Asia, and the ratios of
2 For data on per capita incomes, see Heston, Summers and Aten (2009) and the other Penn World Tables at <http://pwt.econ.upenn.edu/>.
3 See, for example, among many, the country studies in Ito and Krueger (2000); Urata, Chia and Kimura (2006); and Zhang (2001).
FIGURE 1 Inlows of FDI to Developing East Asia ($ billion, logarithmic scale)
1970 1973 1976 1979 1982 1985 1988 1991 1994 1997 2000 2003 2006 2009 0.1
10 100 1,000
Developing East Asia excluding China Developing East Asia
1
inward FDI stock to GDP were 23% in Southeast Asia, 21% in Northeast Asia, 17% in Africa and 10% in Latin America.
China is a major contributor to the growth of FDI in the East Asian region. It has been the developing world’s largest recipient of FDI in the last decade (UNCTAD 2009: appendix table B-2). However, the growth in FDI to China started from a negligible base. Despite the large lows, China’s stock of inward FDI relative to its size (as measured by GDP) is still not very high by East Asian standards.
The highest ratios were those for the two entrepôts, Hong Kong and Singa-pore. In both cases, much of the FDI that entered these economies ended up in other countries, presumably inancing productive assets located elsewhere in the Asian region. We therefore show for these two locations not only total inward FDI stocks, as for the other countries, but also net inward FDI stocks – total or gross
TABLE 1 Stock of Inward FDI as a Percentage of GDPa
1980 1985 1990 1995 2000 2005 2009
Hong Kongb (gross) 616.8 515.6 262.3 157.8 269.3 294.3 432.0
Hong Kongb (net)c 616.3 509.1 246.8 103.1 39.7 29.2 37.0
Singapore (gross) 45.7 60.0 82.6 78.2 119.3 160.9 200.7 Singapore (net)c 39.1 54.0 61.4 36.5 58.0 60.5 76.2
Vietnamd 59.1 30.3 25.5 34.5 66.1 58.8 57.1
Malaysia 20.3 22.8 22.6 31.2 56.2 32.2 39.0 Thailand 3.0 5.1 9.7 10.5 24.4 34.3 36.2 Philippines 2.8 6.0 10.2 13.7 23.9 15.2 14.5
Indonesia 5.7 6.0 7.0 9.3 15.2 14.4 13.5
South Korea 1.7 1.8 1.9 1.8 7.1 12.4 13.3
Taiwan 5.7 4.6 5.9 5.8 6.1 12.1 13.1
China 0.4 2.0 5.1 13.4 16.2 11.8 10.1
Northeast Asiae
Gross 41.6 38.6 25.6 20.7 31.8 25.6 25.5 Netc 41.6 38.1 24.3 16.1 14.4 12.9 11.9
Southeast Asiae
Gross 9.4 12.5 18.1 22.5 44.5 44.7 46.3 Netc 9.0 12.1 15.9 17.3 35.0 31.3 32.0
Africa 9.6 10.2 12.1 16.9 25.9 27.7 35.8 Latin Americaf 5.0 8.7 9.1 10.1 20.9 26.6 30.1
a GDP is as used in UNCTAD calculations (see source).
b 1980–95 data are estimated by UNCTAD from 1998 stock and earlier low data.
c ‘Net’ ratios are based on the difference between inward FDI stock and outward FDI stock. d 1980–2000 stock is estimated by UNCTAD by cumulating inlows from 1970.
e See footnote 1.
f Latin America: Central America and South America.
inward stocks minus outward stocks – which might come closer to representing the FDI remaining in the country.4
Hong Kong (when measured on a gross basis) and Singapore were followed by Vietnam,5 Malaysia and (after 2000) Thailand. Indonesia has a substantially lower ratio of FDI to GDP than these three neighbouring countries. At about 14% in 2009, it was similar to the igure for the Philippines and to those for the latecomers to FDI inlows, Taiwan and South Korea.
An alternative measure of the importance of FDI to a country is the ratio of inward FDI lows to capital formation. This is shown, by ive-year periods, in table 2. The ratio of FDI to total capital formation in Southeast Asia has been
4 For a description of the entrepôt roles of Hong Kong and Singapore, see Low, Ramstetter, and Yeung (1998).
5 The inward FDI estimates for Hong Kong and Vietnam, at least through 1990, were roughly estimated by UNCTAD (see source for table 1) and should not be taken as based on substantial data.
TABLE 2 FDI Inlow as a Share of Gross Capital Formation (period averages)a
1980–84 1985–89 1990–94 1995–99 2000–04 2005–09
Singapore 18.9 29.2 27.9 39.0 62.7 63.7c
Vietnamb – 0.2 34.4 26.0 11.2 16.5
Thailand 2.7 4.6 4.3 8.9 13.9 14.5c
Malaysia 12.6 9.9 20.0 16.2 11.6 13.6d
Philippines 2.0 7.2 7.9 8.6 7.3 11.1
Taiwan 1.2 3.5 2.2 2.5 3.8 6.1
Indonesia 0.9 1.7 3.9 5.7 –2.4 6.1
China 0.8 2.3 9.4 11.8 8.6 5.5
Hong Konge 13.7 22.8 15.4 2.7 1.9 5.3c
South Korea 0.4 1.2 0.6 2.6 3.4 2.0c
Northeast Asiaf 1.8 3.5 5.9 7.7 6.9 5.2
Southeast Asiaf 5.3 7.2 10.3 15.3 15.5 16.2
a The period-sum of FDI inlow as a percentage of the period-sum of gross capital formation.
b For Vietnam, 1980–84 data are not available, and data in the 1985–89 column are for 1986–89. c 2005–08.
d 2005–07 and 2009. Data for 2008 are not reported.
e Up to 1996, Hong Kong’s inlows are as reported by UNCTAD. For 1997 on, when most were matched by outlows, presumably to China, Hong Kong’s inlows are measured as inlow minus outlow. f See footnote 1. Countries other than those listed above were dropped from the aggregation if the data on their FDI inlows or gross capital formation were not available. The effect on the aggregate ratios was small.
higher than the ratio in Northeast Asia since 1980, and in 2005–09 it was more than three times as high. FDI lows were very high relative to capital formation in Hong Kong, if measured on a gross basis (as they are through 1990–94 and the irst two years of the next period in the table), and in Singapore, again because much of the capital formation inanced by the FDI took place in other locations. The ratios are relatively high also in Vietnam, Malaysia and Thailand. The ratio of FDI to capital formation has increased over time in Indonesia – from about 1% in 1980–84 to 6% in 2005–09. This increase notwithstanding, the ratio is lower for Indonesia than for any other Southeast Asian country shown in the table.
Another indicator of the extent of inward FDI, calculated by the United Nations Conference on Trade and Development for 2005 and earlier years (UNCTAD 2008), is what is referred to as ‘transnationality’. This is a combination of several ratios of inward FDI activity to country characteristics, including FDI inlows as a percentage of gross ixed capital formation, 2003–05; inward FDI stocks as a per-centage of GDP in 2005; value added in foreign afiliates as a perper-centage of GDP in 2005; and employment in foreign afiliates as a percentage of total employment in 2005. A high igure on the transnationality index means a large presence of inward FDI. The average igure for developing countries in East Asia is approximately 25.5; the values range from 104 and 65 in Hong Kong and Singapore to about 8.5 in Indonesia, making it, by this measure, the least transnational of the Northeast and Southeast Asian countries.
WHY HAS SO MUCH FDI GONE TO EAST ASIA? Openness to FDI
A fundamental criterion for attracting FDI is that the host country welcomes such investments. This has not always been the case in East Asia. Developing countries for a long time used import substitution to encourage formation and growth of domestic irms. A natural part of this strategy was to restrict the access of foreign MNEs to the domestic market and to use other methods to acquire foreign tech-nology. Japan used this strategy successfully, and that success had a strong impact on development strategies in other countries across East Asia in the 1960s and 1970s.
Some Asian countries eventually experimented with a different development strategy, including a stronger reliance on foreign MNEs. Singapore pioneered this approach. When it was expelled from Malaysia in 1965, Singapore lost most of its former domestic market on the Malay peninsula.
[Its] original economic strategy, which was relected in its irst … development plan, became inoperative … Clearly, import replacement made no sense for a city-state … the most rapid economic progress seemed to lie in industrialization … The question was how to bring it about. The decision was made to encourage FDI … (Krause, Koh and Yuan 1987: 3).
2004). The exact reason for adopting a more liberal FDI regime varied. In some countries it was an attempt to augment domestic savings, in others to encourage technology transfer or to gain access to international markets for exports (Dobson 1997).
The business environment
While openness to FDI is a necessary condition for attracting foreign MNEs, it is not a suficient one. The host country needs to provide an economic environment that is attractive to multinational irms. A ranking of countries by ease of doing business, published annually by the World Bank, provides a set of indicators of the business environment. The major regions of the developing world have dif-fered substantially over the years with respect to the ease of doing business, a characteristic that summarises many of the obstacles and advantages of a coun-try’s institutions. Rankings of the four main developing regions and of individual East Asian countries are shown in table 3. A low rank represents a favourable business environment and a high rank indicates dificult conditions. Northeast Asia was the easiest of the four regions for doing business and its average rank has been improving. Southeast Asia has the second best ranking among the devel-oping regions, followed by Latin America and inally by Africa, the most dificult environment for business. The margin by which East Asia leads the other devel-oping areas has increased over the period.
TABLE 3 Regional and Country Rankings on the Ease of Doing Businessa
2006 2008 2010
Singapore 2 1 1
Hong Kong 6 4 3
Thailand 19 19 12
South Korea 23 22 19
Malaysia 25 25 23
Taiwan 43 58 46
China 108 90 89
Vietnam 98 87 93
Indonesia 131 127 122
Philippines 121 136 144
Northeast Asiab 45 44 40
Southeast Asiab 66 66 65
Latin America 91 99 105
Africa 130 136 137
a In 2007, 2009 and 2010, the Doing Business reports adjusted the previous years’ ‘ease of doing busi-ness’ rankings for changes in methodology, data corrections and the addition of new economies. The igures shown are the adjusted rankings. Regional rankings are unweighted averages of country rank-ings calculated by the authors from the same sources.
b See footnote 1.
Global production networks
A feature of the recent development of East Asian economies has been their par-ticipation in the global production networks of MNEs from developed countries, particularly the US and Japan (Athukorala 2005; Zhou and Lall 2005). MNEs locate different parts of the production process in different Asian countries to increase eficiency and reduce costs. One consequence of this ‘fragmentation’ of multinational irms’ production is to reduce the importance of country size in the location of production, since a small country can participate by specialising in a single stage of production for eventual use in many markets.
A series of papers by Ando and Kimura, summarised in Ando, Arndt and Kimura (2006), emphasises the importance of the growth of trade in machinery parts and components, and contrasts that trend in Asian trade with its absence in Latin American trade. When countries are arrayed in order of the importance of machinery and machinery parts and components in their exports, seven East Asian countries are above the median, and only one, Indonesia, is below it. Among the Latin American countries, only one, Mexico, showed a high share and nine a low share. Athukorala (2005: 9) shows that East Asia’s share of global trade in parts and components increased from 35% in 1990 to 40% in 2000. The bulk of trade in parts and components is conducted by MNEs.
Electronics has been the most important sector for international production net-works. International electronics irms were already looking in the 1960s and 1970s at opportunities to locate labour-intensive parts of their production in foreign coun-tries. East Asian countries were the prime location for these irms. For instance, Texas Instruments and National Semiconductor had located production in Singa-pore as early as the 1960s (Sjöholm 2003a). They were attracted there by subsidies, but also by an eficient bureaucracy, which, for instance, enabled Texas Instruments to start production 50 days after its investment decision (Huff 1994: 325).
Malaysia too became an important destination of foreign electronics companies at a relatively early date. One important location was the southern Malaysian state of Johor. This development was partly the result of strong historical links with Singapore, but it was facilitated by liberalisation of trade and border proce-dures in Malaysia and by investments in infrastructure on both sides of the bor-der (Sjöholm 2003a: 109). MNEs were able to ship goods back and forth between plants on both sides of the border. Similar networks have over time been spread-ing to countries such as China, Thailand, the Philippines and Vietnam.
Other determinants of FDI
The cost of production is particularly important for the location of vertically inte-grated production networks, and it depends on a host of factors including wages, productivity, infrastructure, tariffs and taxes. The authors whose work is sum-marised in Ando, Arndt and Kimura (2006) associate success in participating in these international production-sharing arrangements with the FDI environments in the host countries, and especially with the presence of supporting infrastruc-ture, including ‘costly communications and coordination infrastructure’ (p. 7).
Labour
ind the education and skills of the workforce to be important in MNEs’ location decisions.6 The level of education required varies, of course, with the type of production, but even relatively simple manufacturing typically calls at least for basic literacy and numeracy. For more sophisticated production, the skill requirements of the workforce are higher.7
Many East Asian countries were early leaders in the education of their popula-tions. Since the 1960s they have had higher rates of completion of secondary edu-cation than Latin America, Africa and South Asia, and higher rates of completion of tertiary education than all other developing areas except Latin America (Barro and Lee 2010: table 3). This lead in education may in part explain the early attrac-tiveness of some of these countries to investors. However, educational attainment differs within East Asia, with higher levels in Northeast than in Southeast Asia (Booth 1999a, 1999b).
Corruption
A number of studies try to identify additional determinants of FDI. For instance, Gastanaga, Nugent and Pashamova (1998) ind a general negative effect of cor-ruption on FDI in developing countries. Woo and Heo (2009) examine corcor-ruption in eight Asian countries and ind that it has a negative effect on FDI inlows. Hines (1995), in a study of US FDI, and Wei (1997), in a study of FDI in OECD countries, arrive at similar conclusions. The negative effect of corruption on FDI may seem a paradox, given that large inlows of FDI and high levels of corruption co-exist in many East Asian countries. One explanation is that other country characteristics such as cheap labour and large markets make up for the negative effect of corrup-tion. Another explanation might be the nature of corruption in East Asia. Rodri-guez, Uhlenbruck and Eden (2005) examine corruption from two perspectives: pervasiveness and arbitrariness. Highly pervasive corruption tends to be insti-tutionalised and predictable, whereas arbitrary corruption increases uncertainty. Corruption in East Asia tends to be of the predictable sort: irms know whom to bribe, and once the payment is done they will be free from the need to make similar payments to other actors. Lee and Oh (2007) argue that this predictability is especially important for foreign MNEs whose knowledge of local conditions is relatively poor: arbitrariness and uncertainty about whether bribery will have a favourable outcome are more harmful to foreign irms with limited knowledge of local conditions. That reform was important for business was implied by the unfa-vourable stock market reaction to a reformist Indonesian minister’s resignation in May 2010 (‘Reformer resigns, rattling Indonesia’, Wall Street Journal, 6/5/2010).
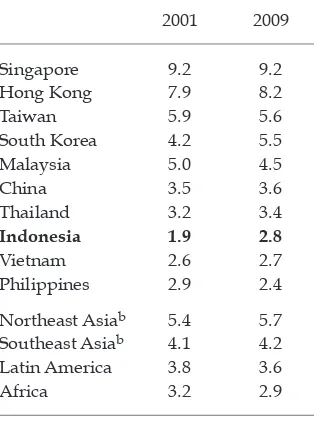
The ‘corruption perceptions index’ published each year by Transparency Inter-national suggests that there have been persistent differences among developing regions in the prevalence of corruption (table 4). The index is constructed from surveys and ratings by risk agencies and country analysts. The data are combined to form an index scaled from 0 to 10, with 0 representing the highest level of
6 See World Bank (2007: 180–1) for a discussion of skills and FDI in East Asia.
corruption and 10 the lowest. Among the developing regions, Northeast Asia was perceived as the least corrupt in 2001 and 2009, followed by Southeast Asia. Africa was perceived as the most corrupt.
With respect to the prevalence of corruption, the igures on individual coun-tries in table 4 suggest that there are three groups of councoun-tries: Singapore and Hong Kong, with low perceived corruption; Taiwan, South Korea and Malaysia, with intermediate levels of perceived corruption; and China, Thailand, Indonesia, Vietnam and the Philippines with relatively high levels of perceived corruption. Indonesia was perceived to have the highest level of corruption in 2001 but has made some progress: its corruption perceptions index in 2009 is similar to Viet-nam’s and better than that of the Philippines.
Institutional factors, infrastructure and the role of export-processing zones
Other studies also highlight the importance of institutions. Chantasasawat et al. (2004) examine FDI to eight East Asian countries between 1985 and 2001. Their results suggest that various institutional factors are among the most important determinants of FDI. For instance, low corporate taxes, low levels of corruption and a high degree of openness to the international economy are associated with higher levels of FDI. One explanation of the relationship lies in the role of production net-works. Such networks rely on low tariffs and low transactions costs to be able to ship parts and components economically among afiliates in different countries.
It is a major task for a developing country to implement all the policies that will increase FDI inlows. A number of East Asian countries have used
TABLE 4 Corruption Perceptions Index in Selected Developing Regionsa
2001 2009
Singapore 9.2 9.2 Hong Kong 7.9 8.2
Taiwan 5.9 5.6
South Korea 4.2 5.5
Malaysia 5.0 4.5
China 3.5 3.6
Thailand 3.2 3.4
Indonesia 1.9 2.8
Vietnam 2.6 2.7
Philippines 2.9 2.4
Northeast Asiab 5.4 5.7
Southeast Asiab 4.1 4.2
Latin America 3.8 3.6
Africa 3.2 2.9
a The index ranges from 10 (very low perceived corruption) to 1 (very high perceived corruption). Regional indices are unweighted averages of country indices calculated by the authors from the same source.
b See footnote 1.
export-processing zones (EPZs) to address this dificulty. Improvements in infrastructure can be concentrated in certain geographic locations, where the irms often receive special treatment in terms of taxes and regulations. Typical advantages of locating in EPZs include lower import and export restrictions, less restrictive labour requirements, lower taxes, liberal ownership regulations, liberal foreign exchange regulations and access to superior infrastructure and communications technologies (Madani 1999).
Countries such as Malaysia and Thailand have for decades relied heavily on EPZs. Other countries, such as Vietnam, started later but have also been relatively successful in using EPZs to attract FDI. China is perhaps the case for which such zones have been most instrumental in generating rapid growth. Foreign irms came in large numbers to the four zones established in 1980, and later to new zones that opened up at a rapid pace in the coastal provinces. As a result, foreign irms’ share of exports rose from 1% in 1985 to more than 50% in 2005 (Hofman, Zhao and Ishihara 2007).
It seems that EPZs are particularly important in countries with poor institu-tions. In those instances, EPZs allow foreign MNEs to avoid some of the domestic regulations and constraints. As countries develop, conditions in the surrounding economy tend to converge with those in the EPZs, and the role of the latter tends to decline.
Summary
East Asian countries as a group have for several decades been superior to other developing regions in respect of all the characteristics identiied here as attractive to investment by multinational irms. This has been the case for the education of the labour force, the control of corruption, the atmosphere for conducting busi-ness, the reliability of the infrastructure needed for coordinating chains of supply and production, and the willingness to make changes in institutions to attract foreign irms. The result has been a higher presence of foreign multinationals in East Asia than in other areas of the developing world.
INDONESIA AS A RECIPIENT OF FDI
We have shown that FDI inlows have been large to most countries in East Asia, but relatively modest to Indonesia. A useful way of describing Indonesia’s record in attracting inward FDI is to compare inward stocks over time with what might be predicted from equations that relate the expected inward stock to possible determinants of FDI inlow. In other words, how did Indonesia perform in terms of FDI inlows given its economic characteristics and performance on standard macroeconomic indicators?
provide a more precise measure of the openness of trade policy than a simple ratio of trade to output.
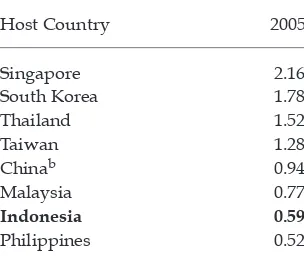
Table 5 compares the inward FDI stocks predicted from such a regression with actual stocks in 2005. The actual inward stock of FDI in Indonesia in 2005 (as reported by UNCTAD at <http://www.unctad.org/fdistatistics>) was 59% of the stock predicted by the equation shown below table 5. Actual levels for four East Asian countries were higher than predicted levels, and only the Philippines had a lower ratio than Indonesia of actual to predicted FDI stock.
The data on aggregate stocks and lows of FDI to individual countries are sub-ject to many problems of measurement and interpretation. For some countries, such as Hong Kong and Singapore, part of the FDI inlow does not add to the productive assets of the nominal destination country, but moves through to other countries, where it inances the creation of physical capital and the employment of labour.
For FDI from the US, more information is available about the composition and characteristics of lows and stocks. The main advantage of this is that we can study the real activities of multinational afiliates rather than looking at inancial lows.
TABLE 5 Ratio of Actual to Predicteda Inward FDI Stock, 2005
Host Country 2005
Singapore 2.16
South Korea 1.78
Thailand 1.52
Taiwan 1.28
Chinab 0.94
Malaysia 0.77
Indonesia 0.59
Philippines 0.52
a Predicted from equation:
FDI Inward Stockt = α + β1 GDPt 5 + β2 per capi
− tta GDP growth + β3 RES Op. .t−5
GDP is real GDP at the economy level, which is the product of real GDP per capita and population, both from the Penn World Table (Heston, Summers and Aten 2009). Per capita growth is calculated using the real GDP per capita chained index based on 2005 (see <http://pwt.econ.upenn.edu/php_site/pwt_ index.php>). Residual openness (‘RES.Op’) is calculated as the residual of the regression of trade share on population, land and a constant term. The samples in that regression are all the countries for which data were available, excluding OECD countries other than South Korea and Mexico. The same coun-tries were used to calculate predicted inward stock except where necessary variables were unavailable. Negative openness estimates were replaced by zero.
Most data were obtained from the World Bank’s World Development Indicators at <http://data. worldbank.org/data-catalog/world-development-indicators>. Data on the trade share for Singa-pore are from the Penn World Tables at <http://pwt.econ.upenn.edu>. For Taiwan, the data are from National Statistics, Republic of China (Taiwan), at <http://eng.stat.gov.tw/mp.asp?mp=5>. Data on FDI inward stock are from the online database of UNCTAD (see source for table 1).
b Hong Kong is combined with China in this table. The inward FDI stock in China is China’s inward stock plus Hong Kong’s inward stock minus its outward stock.
Employment in all US afiliates, and in manufacturing afiliates, can be predicted from the same independent variables that were used to predict the stock of inward FDI for table 5. These predicted levels can then be compared with data from actual surveys of US multinationals that give revised estimates of afiliate employment by country of location in 1985, 1990, 1995, 2000, and 2005 (available at <http:// www.bea.gov/scb/account_articles/international/iidguide.htm#page3>).
Employment in all US afiliates in Indonesia between 1985 and 2005 ranged from about half of the predicted level to a peak of 90%. For no other Northeast or Southeast Asian country was the over-prediction of US afiliate employment consistently greater than for Indonesia. Employment in US afiliates in manufac-turing in Indonesia was only 11% of the expected level in 1985, but it increased steadily to over 80% of expected employment in 2005, close to the median. In absolute terms, it was only a fraction of afiliate manufacturing employment in such small economies as Hong Kong and Singapore, until a more than doubling from 2000 to 2005 brought it above the levels in both of these countries.
In contrast, the level of physical capital in US afiliates in Indonesia, as repre-sented by net property, plant and equipment, was far above the predicted values in all the years from 1985 through 2005. That contrast is explained, as discussed below, by the large role of investment in capital-intensive mining in US FDI in Indonesia.
The igures above suggest, again, that the inlow of FDI to Indonesia, and especially the inlow to labour-intensive manufacturing, is lower than would be expected from standard macroeconomic indicators. Below we try to determine why FDI lows to Indonesia are low. One possibility is that FDI to Indonesia is concentrated in sectors where alternative locations are few, and that multinational irms choose other countries for their investments in sectors where there are alter-natives.
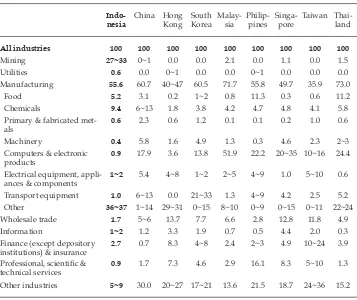
Some support for this hypothesis is given by igures on employment in afili-ates of US irms in Indonesia and other East Asian countries (table 6). The com-position of US irms’ employment in Indonesia was very different from that in the other East Asian countries shown. The share in mining was much higher in Indonesia, at over 27%. In none of the other countries was that share over 2.1%. The share in machinery is particularly low in Indonesia, at less than half of 1%, while in the other countries (except the Philippines) it ranged from 1.3% to 5.8%. Computers and electronic products accounted for less than 1% of employment in US irms’ afiliates in Indonesia, whereas the shares in the other countries ranged from 3.6% in Hong Kong to over 50% in Malaysia. In general, investment in Indo-nesia from the US avoided the manufacturing industries in which technology was important. An exception is chemicals, in which investment was probably drawn to Indonesia by the petroleum industry. The low share of US FDI in electronics suggests that Indonesia plays a quite minor role in the production networks of US-based MNEs. The ’other manufacturing‘ industries, which account for over one-third of US afiliate employment in Indonesia, include beverages and tobacco products; textiles, apparel and leather products; wood and paper products and printing; petroleum and coal products; and furniture and related products. These are mainly relatively low-tech industries.
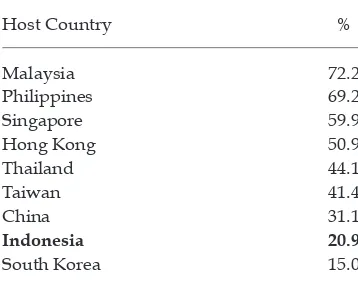
afiliates in Indonesia made only about 21% of their sales outside the country, while those in Taiwan and Thailand made over 40% of their sales abroad, and those in the other East Asian countries (except China and South Korea) made over 50% of their sales outside their home markets.
We also examined inlows of FDI from other countries where similar data on the activities of foreign afiliates are available. This partly conirmed our inding that inlows of FDI to Indonesia were lower than could be expected.8 Germany’s FDI in Indonesia was lower than would be expected from a prediction based on its FDI in all developing countries, whereas employment in Japanese-owned manufacturing plants in Indonesia was close to predicted levels.
The variables included in the predictions described above relate to Indonesia as a market for the investing irms and therefore capture mainly market-seeking FDI.
8 The results are available upon request.
TABLE 6 Shares of Industries in Employment by All Non-bank Afiliates
of US Parent Companies, 2007a (% of employment in all industries)
Indo-All industries 100 100 100 100 100 100 100 100 100
Mining 27~33 0~1 0.0 0.0 2.1 0.0 1.1 0.0 1.5
Utilities 0.6 0.0 0~1 0.0 0.0 0~1 0.0 0.0 0.0
Manufacturing 55.6 60.7 40~47 60.5 71.7 55.8 49.7 35.9 73.0
Food 5.2 3.1 0.2 1~2 0.8 11.3 0.3 0.6 11.2
Chemicals 9.4 6~13 1.8 3.8 4.2 4.7 4.8 4.1 5.8
Primary & fabricated met-als
0.6 2.3 0.6 1.2 0.1 0.1 0.2 1.0 0.6
Machinery 0.4 5.8 1.6 4.9 1.3 0.3 4.6 2.3 2~3
Computers & electronic products
0.9 17.9 3.6 13.8 51.9 22.2 20~35 10~16 24.4
Electrical equipment, appli-ances & components
1~2 5.4 4~8 1~2 2~5 4~9 1.0 5~10 0.6
Transport equipment 1.0 6~13 0.0 21~33 1.3 4~9 4.2 2.5 5.2 Other 36~37 1~14 29~31 0~15 8~10 0~9 0~15 0~11 22~24 Wholesale trade 1.7 5~6 13.7 7.7 6.6 2.8 12.8 11.8 4.9
Information 1~2 1.2 3.3 1.9 0.7 0.5 4.4 2.0 0.3
Other industries 5~9 30.0 20~27 17~21 13.6 21.5 18.7 24~36 15.2
a ‘0’ indicates fewer than 500 employees. Some shares, such as for mining in Indonesia, can only be shown as ranges (indicated by ‘~’), because the numbers are suppressed in the source to preserve the conidentiality of individual irm responses.
However, our results are corroborated in other studies using broader sets of vari-ables that relect Indonesia’s attractiveness as a location for export-oriented pro-duction. For instance, UNCTAD (2010) conirms Indonesia’s under-performance in terms of FDI inlows relative to predictions based on a set of country characteristics. This source ranks Indonesia 119th of 141 countries in terms of FDI inlows, but 85th in terms of an estimate of potential inlows based on 12 economic and policy variables.
The history of FDI in Indonesia has thus been one of fairly low participation of foreign irms compared with other countries in the region. Indonesia is not the country most closed to foreign irms, but it ranks low as a location for FDI in general and for participation in chains of production organised by foreign irms. In its modest inlows of FDI, Indonesia stands in sharp contrast to neighbouring countries, which are all characterised by a heavy concentration of MNEs.
THE EFFECT OF FDI ON THE INDONESIAN ECONOMY
It would be in Indonesia’s interest to increase inlows of FDI only if such inlows beneit the country. We therefore briely survey the literature on the effects of FDI in Indonesia. Table A1 in the appendix lists studies that look at a range of effects of FDI. They show surprisingly consistent beneits to Indonesia from FDI.
Productivity
Foreign irms bring in new production processes or begin to produce new prod-ucts. These beneits to the country are likely to manifest themselves in relatively high productivity in foreign irms. A number of studies show that this is indeed the case for Indonesia: foreign irms have higher labour productivity and higher total factor productivity than local irms. Moreover, not only the level but also the growth of productivity is higher in foreign irms. Finally, all of the studies listed in appendix table A1 ind productivity to be higher in foreign than in
TABLE 7 Share of Sales Outside the Host Country by Majority-owned
Foreign Manufacturing Afiliates of US Parent Companies, 2004a (%)
Host Country %
Malaysia 72.2
Philippines 69.2
Singapore 59.9
Hong Kong 50.9
Thailand 44.1
Taiwan 41.4
China 31.1
Indonesia 20.9
South Korea 15.0
a Sales outside the host country are total sales by afiliates minus local sales by afiliates.
local irms even after controlling for irm characteristics such as size and capital intensity.
Exports
The literature also reveals a clear difference in export intensities between for-eign and domestic irms: forfor-eign irms are substantially more integrated into the international economy through exports. This is not surprising: it is a result found in most countries. One interesting inding on Indonesia is that even foreign irms that start producing only for the Indonesian market are better able than local irms to switch to producing for export.
Wages
Foreign-owned establishments in Indonesia are found to pay higher wages than domestically owned irms, even when the studies control for the educational level of their employees. Accordingly, foreign acquisition of an Indonesian manufac-turing plant results in higher wages for the plant’s employees. Foreign irms also pay a higher premium for higher levels of education than do domestic irms. For-eign irms’ entry thus increases not only wages but also the returns to education, thus encouraging investment in further education.
Employment
A similar story applies to growth in employment. Foreign irms exhibit higher growth in employment than domestic irms. Moreover, foreign acquisitions of domestic irms increase growth in employment, despite the fact that foreign-owned irms are relatively large and large irms tend to have relatively low growth rates of employment.
Spillovers to local irms
The studies listed in table A1 suggest that foreign irms have higher productivity and higher exports, pay higher wages and demonstrate higher growth in employ-ment than domestic irms. If local irms beneit from FDI, it is clear that there are gains to the country from hosting foreign MNEs, but the beneits are less clear if local irms are instead hurt by the presence of foreign irms. The effects of FDI on local irms are often termed ‘spillovers’. Positive spillovers could arise, for example, from the transfer of technologies from foreign to domestic irms or from the expansion of markets for domestic suppliers of intermediate goods. Negative spillovers could result from increased competition if this forces domestic irms out of business or compels them to operate at a lower scale of production.
Appendix table A2 summarises existing studies of spillovers in Indonesia.9 Most studies focus on spillover effects on productivity, but there are also two studies of wage spillovers. All of the studies ind evidence of positive spillovers – of local irms beneiting from the presence of foreign irms within the industry or region. For productivity, the positive effect is likely to come from technology spillovers – new technologies and knowledge that are made available to domestic irms – and from increased competition, a pressure to improve to secure market share and survival. For wages, the positive effect of FDI is likely to be the result
both of increased productivity through spillovers and of increased demand for labour. Since the foreign plants also have higher productivity and pay higher wages than local irms, the two factors together imply that a greater foreign pres-ence raises the general productivity and wage level in a region or industry.
POLICY DISCUSSION: HOW COULD INDONESIA ATTRACT MORE FDI? Restriction of FDI
If faster growth is an important goal of economic policy, it would seem to be in Indonesia’s interest to increase inlows of FDI, given the beneits it brings in terms of productivity growth, higher wages and strong employment growth. How-ever, the Indonesian attitude towards FDI has always been rather ambivalent. In each recent annual review of FDI policy in UNCTAD’s World Investment Report (UNCTAD 2008, 2009, 2010), some added restrictions in Indonesia are mentioned: for example, ‘Indonesia extended the list of business activities that are closed and partially restricted to foreign investment’ (UNCTAD 2008: 52–3); ‘[i]n Indo-nesia … the Ministry of Communications issued a decree barring foreigners from investing in the construction and ownership of wireless communications towers’ (UNCTAD 2009: 56); and ‘some new restrictions [on engaging] in certain activities were introduced (e.g. in India and Indonesia)’ (UNCTAD 2010: 39). Indonesia was the only country mentioned as introducing new restrictions in all three reports.
Fiscal incentives
Fiscal incentives are often mentioned when policies to attract FDI are discussed in Indonesia. Such incentives have been used in other parts of East Asia, in the form of both favourable tax treatment and direct subsidies. Fiscal incentives can be justiied only if the beneit they bring to the host economy is larger than their cost. Many authors argue that this is seldom the case (Blomström and Kokko 2003b). Moreover, most studies suggest that iscal incentives are not important in MNEs’ localisation decisions (Morisset and Pirnia 1999). One serious problem is that iscal incentive schemes are dificult to administer and often give rise to corruption (Morisset 2003).
The business climate
It is therefore more fruitful to consider how the business climate in Indonesia can be made more conducive to FDI. Indonesia does not do well among East Asian countries in the World Bank’s rankings for the quality of the business environ-ment (table 3). In 2010 it was ranked 122nd of the 183 countries included. Singa-pore was ranked highest and Hong Kong as number three. South Korea, Thailand and Malaysia were also ranked as having quite high-quality business environ-ments. China, Vietnam and the Philippines are considered to have relatively poor environments for business, but only the Philippines was ranked lower than Indo-nesia in 2008 and 2010.
The Foreign Policy magazine’s Globalization Index measures economic, political and social international integration.10 As an indicator of investors’ perceptions of the investment climate, it is said to be closely watched by the international community.
In 2010 it ranked Indonesia 86th of 156 countries – behind all included countries in East Asia except Cambodia and Vietnam.
A favourable business environment encompasses a host of factors. Our discussion of the determinants of FDI in East Asia suggested that high levels of education, good institutions and openness to trade are all important contributors to the location decisions of MNEs.
Education
Education enrolment levels are poor in Indonesia. The exception is enrolment in primary education, which was substantially expanded in the 1970s with the use of public revenues from oil. However, enrolment in tertiary and secondary education has been lower in Indonesia than in most other countries in East Asia (Sjöholm 2005). Moreover, there is evidence that the quality of education is rela-tively poor (Jones and Hagul 2001; Welch 2007).
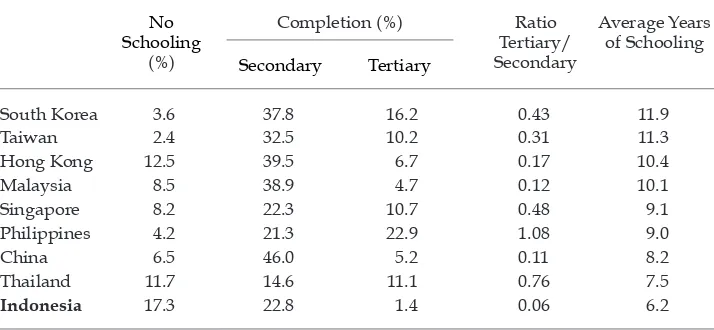
Table 8 shows that educational attainment in 2010 is lower in Indonesia than in any of the other East Asian countries discussed here. The proportion of the popu-lation aged 15 and over with no schooling is far higher in Indonesia than in the rest of the group. Only 1.4% of the population has completed tertiary education and the average Indonesian has had only a little over six years of education, the lowest level shown in the table. Only in the completion of secondary education is Indonesia ahead of some of its neighbours. The proportion of Indonesians with a tertiary qualiication was only 6% of the proportion who had completed second-ary education, the lowest ratio in the group. Either little tertisecond-ary education has been pursued, or many of those that have pursued it have left the country.
Technological capability
Improved education is important for attracting FDI, but it will also affect Indo-nesia’s absorptive capacity; the better the level of education the more Indonesia will beneit from the presence of foreign MNEs. The same can be said of
TABLE 8 Educational Attainment of the Total Population Aged 15 and Over in East Asian Countries, 2010
No Schooling
(%)
Completion (%) Ratio Tertiary/ Secondary
Average Years of Schooling
Secondary Tertiary
South Korea 3.6 37.8 16.2 0.43 11.9
Taiwan 2.4 32.5 10.2 0.31 11.3
Hong Kong 12.5 39.5 6.7 0.17 10.4
Malaysia 8.5 38.9 4.7 0.12 10.1
Singapore 8.2 22.3 10.7 0.48 9.1
Philippines 4.2 21.3 22.9 1.08 9.0
China 6.5 46.0 5.2 0.11 8.2
Thailand 11.7 14.6 11.1 0.76 7.5
Indonesia 17.3 22.8 1.4 0.06 6.2
technological capacity. A higher technological capacity would encourage foreign MNEs to upgrade production to higher value added activities in Indonesia, rather than placing such production in other countries. It would also increase spillovers by facilitating knowledge transfers from MNEs to local irms.
Technological capability seems to offer large scope for improvements that could help to attract FDI. Indonesian technology policies before the Asian inancial cri-sis in the late 1990s were dominated by large high-tech projects in aircraft, ship-building, railroads, telecommunications, electronics, steel and machinery. Poor management and a weak scientiic and engineering infrastructure caused most of these projects to fail (McKendrick 1992; Hill 1995; Hill and Thee 1998; Okamoto and Sjöholm 2003). High-tech projects were largely abandoned after the crisis, but no new technology policy has emerged in their place. As a result, Indonesia remains at the bottom of the technology ladder in the region.
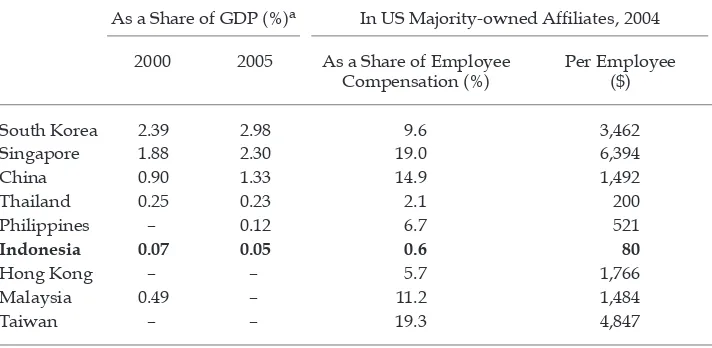
One indication of the poor state of technological development and capability, and perhaps one of its causes, is very low investment in research and develop-ment (R&D). The igures in table 9 show that R&D as a proportion of GDP is sub-stantially lower in Indonesia than in the other countries listed. They also indicate that the share of R&D declined in Indonesia between 2000 and 2005, whereas it increased in the other listed countries for which data are available, with the exception of Thailand.
Another gauge of technological capability is the extent to which foreign investors choose to undertake R&D in their Indonesian afiliates. Table 9 gives an indication of this for US multinational irms. On average, in 2004, US irms’ afiliates in the East Asian countries devoted to R&D about 12% of the amount they spent on employee compensation. The highest ratio among the countries listed in table 9 was 19% in Singapore and Taiwan. In contrast, the amount that afiliates in Indonesia spent on R&D was equal to only 0.6% of their employee
TABLE 9 Research and Development (R&D) Expenditure
As a Share of GDP (%)a In US Majority-owned Afiliates, 2004
2000 2005 As a Share of Employee Compensation (%)
Per Employee ($)
South Korea 2.39 2.98 9.6 3,462
Singapore 1.88 2.30 19.0 6,394
China 0.90 1.33 14.9 1,492
Thailand 0.25 0.23 2.1 200
Philippines – 0.12 6.7 521
Indonesia 0.07 0.05 0.6 80
Hong Kong – – 5.7 1,766
Malaysia 0.49 – 11.2 1,484
Taiwan – – 19.3 4,847
a ‘–’ = no data available.
compensation expenditure – far below the ratios of any other country in the group. The next lowest share, in Thailand, was over three times as high as that in Indonesia. The same stark contrasts can be seen for R&D expenditures per employee: $5,000–6,000 in the highest spending countries, Singapore and Tai-wan, but only $80 in Indonesia.
Infrastructure
Infrastructure is another factor that inluences the location decisions of foreign multinational irms. Its importance is clear from the experience in East Asia, where many countries have deliberately used improvements in infrastructure to attract foreign irms and to become integrated into international production networks. Many East Asian countries continue to invest heavily in infrastructure, and such investments increased further in countries such as China after the outbreak of the global inancial crisis in 2008.
Infrastructure is poor in Indonesia. A report in The Economist in 2009 quoted a Jakarta bank executive as saying that among his banks’ clients infrastructure had become the top obstacle to doing business in Indonesia.
… roads, air- and seaports are inadequate … Electricity generation lags [behind] demand … Only 18% of the population have piped water and only 2.5% are con-nected to a sewer system … Export industries are hindered by a lack of ports … (The Economist, 12/9/2009: 11–12).
The crisis in the late 1990s had a negative effect on Indonesia’s investment in infrastructure. However, investment remained very low even after the crisis was over. In 2010, The World Economic Forum’s Global Competitiveness Report ranked Indonesia 96th of 133 countries in terms of the quality of infrastructure. Some signs of improvement came in 2009, when the government tried to balance a large drop in external demand by launching a program of major infrastructure investment (Resosudarmo and Yusuf 2009). However, insuficient public fund-ing is only one of many factors that constrain infrastructure development. Other problems that will be dificult to solve include a lack of technical capability in responsible local governments, poor coordination between central and local gov-ernments and between regions, and large problems with land acquisition (Kong and Ramayandi 2008).
Institutional factors
The quality of institutions is perhaps the most important determinant of FDI. In a survey of Japanese irms that chose various countries as prospective sites for their foreign manufacturing locations, over 80% of those choosing Indonesia listed the ‘political and social environment’ as a weak point, far more than for any other location (Kimura and Ando 2006: table 2.8). Indonesia has traditionally been seen as having some of the world’s most corrupt institutions (Butt 2009). The igures in table 4 support this assessment.11 In a comment referring to 2008, Transparency International (2008) noted that Indonesia is plagued by rampant corruption, but that there have been some signs of improvement in recent years. Nonetheless, corruption remains a serious problem. Some recent reports indicate new setbacks, with the police force, the parliament and the attorney general’s ofice obstructing the work of the anti-corruption commission (Patunru and Von Luebke 2010).
It is dificult to know exactly how harmful corruption is to FDI inlows to Indonesia. However, there are many anecdotal reports of foreign irms deciding not to invest in Indonesia for fear that corruption would lead to ill-will or to problems with home country authorities (see, for example, Wells 2007: 354).
There are also reasons why changes in the nature of corruption might be harm-ful to FDI. Corruption was high under the New Order regime, but it was also highly institutionalised and predictable: once a standard contribution to the Soe-harto family or its closest allies had been made, the regime ensured that a foreign irm’s activities were not disturbed (World Bank 2003; Lee and Oh 2007)). Corrup-tion in the post-Soeharto era occurs mainly in the context of local government reg-ulations (Henderson and Kuncoro 2004). It differs across provinces and districts and is highly arbitrary. This makes it more dificult for foreign multinationals to deal with.
The government has tried since 2006 to reform the investment climate for foreign irms. Some reforms of particular importance are the equal treatment of foreign and domestic investors and the streamlined application procedures for investment approvals (Lindblad and Thee 2007). However, 25 sectors are closed to foreign irms. More importantly, Indonesia still at times imposes ownership-sharing requirements on foreign investments (Takii and Ramstetter 2007). Ownership-sharing between foreign and local irms has been abandoned in many other countries, because it provides no additional beneits to the host economy and may deter inlows of FDI (Blomström and Sjöholm 1999). Foreign irms that are afraid of losing their technologies to domestic actors will think twice before they engage in a joint venture with them.
The problems of foreign irms are often caused by local authorities. Since Indo-nesia’s decentralisation in 2001, the quality of public policies and economic gov-ernance has come to differ markedly across regions. Some local governments have been encouraging local and foreign irms, whereas many others have constrained irms through imprudent taxation, corruption and ineficient bureaucracy. Von Luebke (2009) cites a study by Rustiani (2003), which showed that a business licence could be obtained in two days in Yogyakarta, while this process took 20 days in Medan. His own indings demonstrate that effective local leadership can
make a substantial difference in reducing poor regulations and corruption, and can signiicantly improve the private sector business environment.12
Openness to trade
As the East Asian experience shows, openness to trade is another important determinant of FDI, especially for MNEs with vertically integrated production chains. The trade regime in Indonesia deteriorated after the crisis in 1997–98, with rising corruption in the customs services and increases in the time and money required to clear goods (Athukorala 2002). More recently, the situation seems to be improving. One of the criteria included in the World Bank’s Doing Business survey is ‘trading across borders’, which is deined as the documents, time and money required to export and import. On this measure, Indonesia was ranked 45th in 2009, substantially better than its average ranking of 122nd. Its rank is also better than those of many other countries in the region, and close to that of China (ranked 44th). A slightly worrying sign, however, is that Indonesia had dropped from rank 40 in 2007. Poor integration into the international economy is presum-ably one reason why Indonesia is not participating in international production networks to the same extent as many other East Asian countries.13
Finally, it is likely that past poor policies partly explain Indonesia’s low FDI inlows. The country was an early host to foreign MNEs in electronics. For instance, Fairchild and National Semiconductor established plants in Indonesia in the early 1970s. However, both irms closed their Indonesian operations in the 1980s because of an unfavourable business environment (Thee and Pangestu 1998: 223).
CONCLUDING REMARKS
FDI has been important in East Asia’s economic development. Multinational irms have contributed to host country development by bringing in new technologies and providing access to foreign markets. Indonesia is no exception in this respect: a survey of the literature shows that FDI has increased economic growth, wages, exports and employment in the Indonesian economy. The beneits of FDI have become increasingly obvious to policy makers over time, and this explains the changing attitude towards it in East Asia – from a negative view, relected in poli-cies aimed at keeping foreign irms out, to a position where substantial resources are spent on attracting foreign irms.
MNEs have responded to the policy changes and invested heavily in the region. Production networks, in which different parts of multinationals’ produc-tion chains are located in afiliates in different countries, seem to be particularly important in East Asia.
12 For case studies of inter-regional differences in the business environment, see Von Luebke (2009) and the references therein.
However, Indonesia has not fully participated in this development and attracts less FDI than would be expected from its size and growth, particularly in the period up to 1990 and in recent years. One reason for low inlows of FDI is that Indonesia has failed to integrate fully into international production networks. The composition of FDI in Indonesia therefore differs from that in other parts of East Asia, and foreign multinational irms seem often to choose other locations when there are alternatives, especially in manufacturing.
What should be done if Indonesia wishes to attract more FDI? As global and regional competition for FDI has increased, an FDI regime and an economic envi-ronment that were suficient for attracting FDI some years ago are not suficient today. An analysis of the determinants of FDI in East Asia gives some guidance about what is needed: good institutions, a skilled workforce and openness to trade. Indonesia has made improvements in some of these areas in recent years. If continued and intensiied, these improvements can be expected to make Indo-nesia more attractive to MNEs, although it will take time for them to have a more widespread impact on the economy.
There are, however, other areas where little progress has been made, leaving Indonesia a less attractive FDI destination than other countries in the region. The continuing poor state of infrastructure is damaging to Indonesia’s ability to attract FDI. The business environment is poorer than in many other East Asian countries. Indonesian institutions and administrative capacity need to be improved further. Despite some progress, corruption remains a larger problem in Indonesia than in most other countries in East Asia. Poor institutions and corruption increase the costs of production. MNEs that can choose from among several locations will tend to stay out of Indonesia unless these problems are addressed. Some prov-inces have in recent years been able to implement good policies and improve local institutions. To use these examples as models for reform and change at the national level would help to increase inlows of FDI and thereby be fruitful for the continued development of Indonesia.
REFERENCES
Ando, M., Arndt, S.W. and Kimura, F. (2006) ‘Production networks in East Asia: strategic behavior by Japanese and US irms’, JCER Discussion Paper No. 103, Japan Center for Economic Research (JCER), Tokyo. An expanded version was published in 2008 (in Japanese) in Japanese Firms’ Strategy in East Asia: A Comparison with US and European Firms, eds Kyoji Fukao and JCER, Nihon Keizai Shinbun Sha, Tokyo.
Arnold, J.M. and Javorcik, Beata S. (2009) ‘Gifted kids or pushy parents? Foreign acquisi-tions and plant performance in Indonesia’, Journal of International Economics 79: 42–53. Athukorala, P. (2002) ‘Survey of recent developments’, Bulletin of Indonesian Economic
Stud-ies 38 (2): 141–62.
Athukorala, P. (2005) ‘Product fragmentation and trade patterns in East Asia’, Asian Eco-nomic Papers 4 (3): 1–27.
Barro, Robert J. and Lee, Jong-Wha (2010) ‘A new data set of educational attainment in the world, 1950–2010’, NBER Working Paper No. 15902, National Bureau of Economic Research, Cambridge MA.
Blalock, G. and Gertler, P.J. (2008) ‘Welfare gains from foreign direct investment through technology transfer to local suppliers’, Journal of International Economics 74 (2): 402–21. Blalock, G. and Gertler, P.J. (2009) ‘How irm capabilities affect who beneits from foreign
Blomström, M. and Kokko, A. (2003a) ‘Human capital and inward FDI’, CEPR Discussion Paper No. 3762, Centre for Economic Policy Research, London.
Blomström, M. and Kokko, A. (2003b) ’The economics of foreign direct investment incen-tives’, EIJS Working Paper 168, European Institute of Japanese Studies, Stockholm School of Economics, Stockholm.
Blomström, M. and Sjöholm, F. (1999) ‘Technology transfer and spillovers: does local par-ticipation with multinationals matter?’, European Economic Review 43 (4–6): 915–23. Booth, A. (1999a) ‘Education and economic development in Southeast Asia: myths and
realities’, ASEAN Economic Bulletin 16 (3): 290–306.
Booth, A. (1999b) ‘Initial conditions and miraculous growth: why is South East Asia differ-ent from Taiwan and South Korea?’, World Development 27 (2): 301–22.
Brooks, D.H. and Hill, H. (2004) ‘Divergent Asian views on foreign direct investment and its governance’, Asian Development Review 21 (1): 1–36.
Butt, S. (2009) ‘”Unlawfulness” and corruption under Indonesian law’, Bulletin of Indo-nesian Economic Studies 45 (2): 179–98.
Chantasasawat, B., Fung, K.C., Iizaka, H. and Siu, A. (2004) ‘The giant sucking sound: is China diverting foreign direct investment from other Asian economies?’, Asian Eco-nomic Papers 3 (3): 122–40.
Dobson, Wendy (1997) ‘East Asian integration: synergies between irm strategies and gov-ernment policies’, in Multinationals and East Asian Integration, eds Wendy Dobson and Chia Siow Yue, Institute of Southeast Asian Studies, Singapore.
Gastanaga, V.M., Nugent, J.B. and Pashamova, B. (1998) ‘Host country reforms and FDI inlows: how much difference do they make?’, World Development 26 (7): 1,299–314. Henderson, J.V. and Kuncoro, A. (2004) ‘Corruption in Indonesia’, NBER Working Paper
No. 10674, National Bureau of Economic Research, Cambridge MA.
Heston, Alan, Summers, Robert and Aten, Bettina (2009) Penn World Table Version 6.3, Center for International Comparisons of Production, Income and Prices, University of Pennsylvania, Philadelphia, August, available at <http://pwt.econ.upenn.edu/>. Hill, Hal (1995) ‘Indonesia’s great leap forward? Technology development and policy
issues’, Bulletin of Indonesian Economic Studies 31 (2): 83–123.
Hill, Hal and Thee Kian Wie (1998) Indonesia’s Technological Challenge, Institute of Southeast Asian Studies, Singapore.
Hines, J.R. Jr (1995) ‘Forbidden payment: foreign bribery and American business after 1977’, NBER Working Paper No. 5266, National Bureau of Economic Research, Cam-bridge MA.
Hofman, B., Zhao, M. and Ishihara, Y. (2007) ‘Asian development strategies: China and Indonesia compared’, Bulletin of Indonesian Economic Studies 43 (2): 171–99.
Huff, W.G. (1994) The Economic Growth of Singapore: Trade and Development in the Twentieth Century, Cambridge University Press, Cambridge.
Ito, Takatoshi and Krueger, Anne O. (eds) (2000) The Role of Foreign Direct Investment in East Asian Economic Development, NBER–East Asia Seminar on Economics, Vol. 9, University of Chicago Press, Chicago IL and London.
Jones, G.W. and Hagul, P. (2001) ‘Schooling in Indonesia: crisis-related and longer-term issues’, Bulletin of Indonesian Economic Studies 37: 207–31.
Jungnickel, R. (2002) Foreign-Owned Firms: Are They Different?, Palgrave Macmillan, Hound-mills and New York NY.
Kaufmann, D., Kraay, A. and Mastruzzi, M. (2009) Governance Matters VIII: Aggregate and Individual Governance Indicators, 1996–2008, Development Research Group, World Bank, Washington DC.
Kong, T. and Ramayandi, A. (2008) ‘Survey of recent developments’, Bulletin of Indonesian Economic Studies 44 (1): 7–32.
Krause, L.B., Koh A.T. and Yuan, L.T. (1987) The Singapore Economy Reconsidered, Institute of Southeast Asian Studies, Singapore.
Lee, S.H and Oh, K.K. (2007) ‘Corruption in Asia: pervasiveness and arbitrariness’, Asia
Paciic Journal of Management 24: 97–114.
Lindblad, Thomas J. and Thee Kian Wie (2007) ‘Survey of recent developments’, Bulletin of Indonesian Economic Studies 43 (1): 7–33.
Lipsey, R.E. and Sjöholm, F. (2004a) ‘Foreign direct investment, education, and wages in Indonesian manufacturing’, Journal of Development Economics 73: 415–22.
Lipsey, R.E. and Sjöholm, F. (2004b) ‘FDI and wage spillovers in Indonesian manufactur-ing’, Review of World Economics 140 (2): 321–32.
Lipsey, R.E. and Sjöholm, F. (2005) ‘Host country impacts of inward FDI: why such dif-ferent answers?’, in The Impact of Foreign Direct Investment on Development: New Meas-urements, New Outcomes, New Policy Approaches, eds M. Blomström, E. Graham and T. Moran, Institute for International Economics, Washington DC: 23–43.
Lipsey, R.E. and Sjöholm, F. (2006) ‘Foreign irms and Indonesian manufacturing wages: an analysis with panel data’, Economic Development and Cultural Change 55 (1): 201–21. Lipsey, R.E., Sjöholm, F. and Sun, J. (2010) ‘Foreign ownership and employment growth
in Indonesian manufacturing’, NBER Working Paper No. 15936, National Bureau of Economic Research, Cambridge MA.
Low, L., Ramstetter, E.D. and Yeung, H.W.C. (1998) ‘Accounting for outward direct invest-ment from Hong Kong and Singapore: who owns what?’, in Geography and Ownership as Bases for Economic Accounting, eds R.E. Baldwin, R.E. Lipsey and J.D. Richardson, University of Chicago Press, Chicago IL: 139–68.
McKendrick, D. (1992) ‘Obstacles to “catch-up”: the case of the Indonesian aircraft indus-try’, Bulletin of Indonesian Economic Studies 28 (1): 39–66.
Madani, D. (1999) ‘A review of the role and impact of export processing zones’, World Bank Policy Research Working Paper No. 2238, World Bank, Washington DC.
Morisset, J.P. (2003) ‘Using tax incentives to attract foreign direct investment’, Private Sec-tor and Infrastructure Network, Viewpoint 253, World Bank, Washington DC.
Morisset, J.P. and Pirnia, N. (1999) ‘How tax policy and incentives affect foreign direct investment: a review’, Policy Research Working Paper 2509, World Bank, Washington DC.
Okamoto, Y. and Sjöholm, F. (2003) ‘Technology development in Indonesia’, in Competitive-ness, FDI and Technological Activity in East Asia, eds S. Lall and S. Urata, Edward Elgar, London: 375–96.
Okamoto, Y. and Sjöholm, F. (2005) ‘FDI and the dynamics of productivity in Indonesian manufacturing’, Journal of Development Studies 41 (1): 160–82.
Patunru, A.A. and Von Luebke, C. (2010) ’Survey of recent developments’, Bulletin of Indo-nesian Economic Studies 46 (1): 7–32.
Ramstetter, E.D. (1999) ‘Trade propensities and foreign ownership shares in Indonesian manufacturing’, Bulletin of Indonesian Economic Studies 35 (1): 45–66.
Resosudarmo, B.P. and Yusuf, A.A. (2009) ‘Survey of recent developments’, Bulletin of Indo-nesian Economic Studies 45 (3): 285–306.
Rodriguez, P., Uhlenbruck, K. and Eden, L. (2005) ‘Government corruption and the entry strategies of multinationals’, Academy of Management Review 30 (2): 383–96.