Original study
Microsatellite based genetic diversity among the three
water buffalo (
Bubalus bubalis
) populations in Turkey
Emel Özkan Ünal1, M. İhsan Soysal1, Eren Yüncü2, Nihan Dilşad Dağtaş2 and İnci Togan2
1Department of Animal Science, Faculty of Agricultural, Namık Kemal University, Tekirdağ, Turkey, 2Department of
Biological Sciences, Middle East Technical University, Ankara, Turkey
Abstract
In this study, twenty microsatellite loci were used to define genetic diversity among 56 water buffalo samples. Their somatic tissues (the skin and cartilage tissues from ears) and DNAs were deposited in Turkish Gene Banks. Samples of healthy animals were collected from three different geographic regions: Northern Turkey, North-Western Turkey and Eastern Thrace. Three (loci CSSM57, ETH3) to ten (locus CSSM47) different alleles were identified per micro-satellite locus in a total of 103 alleles. PIC values for the micro-satellite loci analysed ranged from 0.14 (CSSM32) to 0.82 (CSSM47) with a mean of 0.4945. In all of the populations for each of the loci, the observed heterozygosities (HO) were greater than the expected heterozygosities (HE), indicating that populations suffered from bottleneck. HE per population ranged between 0.5359 in the Black Sea Region and 0.5208 in the Aegean-South Marmara Region. Within the population, inbreeding estimates (FIS) was positive in only four of the 20 loci analysed. Individuals of the different geographic populations did not cluster on the neighbour joining tree which was constructed on the basis of allele sharing distances. Population differentiation was further visualized by Factorial Correspondence Analysis and determined by the pairwise estimations of fixation index (FST) and Nei’s standard genetic distance (Da). The results revealed that populations have inertia (as depicted by Factorial Correspondence Analysis), they are differentiated significantly but little (by pairwise FST values) and the least genetic distance is between Black Sea Region and Thrace Region. Comparative studies indicated that the genetic diversity of water buffalo harboured in the Gene Banks of Turkey is at the lower end of the diversity spectrum. This study thus highlights the usefulness of heterologous bovine microsatellite markers to assess the genetic variability in Anatolian water buffalo breeds. Furthermore, the results can be utilized for future breeding strategies and conservation.
Archiv Tierzucht 57 (2014) 8, 1-12 Received: 20 December 2013 doi: 10.7482/0003-9438-57-008 Accepted: 2 April 2014 Online: 19 May 2014 Corresponding author:
Emel Ozkan Unal; email: [email protected],
Namık Kemal University, Faculty of Agricultural, Department of Animal Science, 59030, Tekirdağ, Turkey
© 2014 by the authors; licensee Leibniz Institute for Farm Animal Biology (FBN), Dummerstorf, Germany.
Ünal et al.: Three water buffalo (Bubalus bubalis) populations in Turkey 2
Keywords: water buffalo, genetic diversity, microsatellites, Turkey
Abbreviations: Da: Nei’s standard genetic distance, DNA: deoxyribonucleic acid, FIS: inbreeding coefficient,
FST: fixation index, HE: expected heterozygosities, HO: observed heterozygosities, MFAL: Turkish
Ministry of Food, Agriculture and Livestock, PIC: polymorphism information content value
Introduction
The water buffalo has prime importance in the lives of farmers and thus the economy of many countries worldwide. They are not only draught animals, but also a source of meat, horns, skin and particularly the rich and precious milk that may be converted into cream, butter, yoghurt and many different kinds of cheese (Michelizzi et al. 2010). The number of water buffaloes in the world has increased rapidly over the past few decades and according to FAO statistics (2011) (http://faostat.fao.org/), there are about 195 million buffaloes in the world. However, in Turkey the Anatolian buffalo population has declined dramatically in the last decade. From 2001 to 2011, there was a 42 % decrease in the breeding population because of the preference for cattle over buffalo (http://faostat.fao.org). FAO statistics (2011) show that the current total buffalo population is 84 726 head in Turkey. In Turkey, only the river type water buffalo is found (Soysal et al. 2007). It is believed that the buffalo arrived in Turkey from India in the seventh Century during the expansion of Islam (Moioli & Borghese 2005). Currently, they are mostly bred in the Central Black Sea, Marmara (Thrace) and Western Central Anatolia regions of Turkey (Atasever & Erdem 2008, Gürcan et al. 2011). The genetic characterization of buffalo populations is necessary for their effective conservation and meaningful improvement (Sajid et al. 2007). In the MoDAD Project proposed by FAO, microsatellite markers are recommended for the analysis of genetic variation and relationships among farm animal populations (Hoffmann et al. 2004). In recent years, several studies using microsatellites have been published regarding domestic river buffalo in Egypt, Greece and Italy (Moioli et al. 2001, El-Kholy et al. 2007), Iran (Aminafshar et al. 2008), Iraq (Jaayid & Dragh 2013), India (Kumar et al. 2006, Tantia et al. 2006, Kataria et al. 2009, Vijh et al. 2008, Mishra et al. 2009, Padeeri, et al. 2009, Kathiravan et al. 2009), China (Zhang et al. 2007, Zhang et al. 2011), Pakistan (Babar et al. 2009, Saif et al. 2012) as well as Turkey (Gargani et al. 2009, Soysal et al. 2007).
Material and methods
Samples, geographic populations and DNA isolation
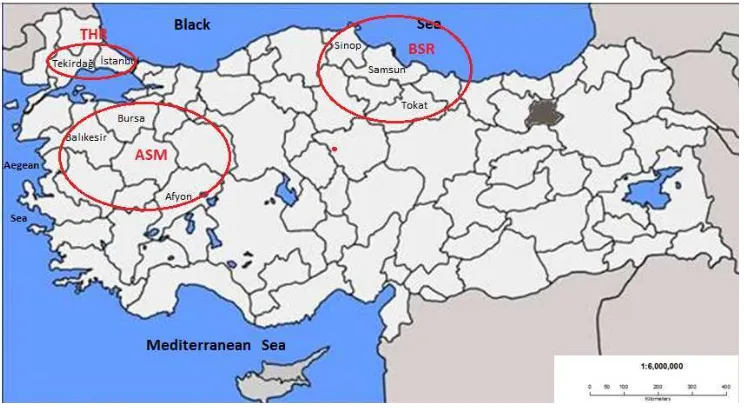
Randomly chosen, unrelated animals were collected by the personnel of MFAL from 8 different provinces in Turkey (İstanbul-Silivri, Tekirdağ-Saray, Balıkesir, Bursa, Afyon, Tokat, Sinop and Samsun) in the year 2012 (Figure 1). These provinces were known for their relatively large buffalo populations in Turkey. Throughout the national project (TURKHAYGEN-I) candidate animals were first screened for several diseases (IBR, IBR-IPV, tuberculosis, Leptospirosis, Brucella, etc.). Then, somatic tissues (the skin and cartilage tissues from ears) and blood were taken from the healthy animals. DNA was extracted from the blood. The tissues and the DNA were deposited, in replicate, into two Gene Banks of Turkey. There were 56 tissues from healthy individuals in the Gene Banks. From those water buffalo individuals, eight to 10 mL of whole blood was collected from the jugular vein in EDTA-coated Vacutainer tubes (BD Vacutainer Systems, Plymouth, UK) and transported to the laboratory at 0 to 5 °C. Genomic DNA was extracted by using a standard phenol-chloroform extraction method (Sambrook & Russell 2001). The concentration of DNA was judged in comparison with the standard DNA marker concentration on agarose gels. The quality of DNA was checked on 0.8 % agarose gels prepared with a Tris-Boric acid-EDTA buffer. Since there was no pedigree recording for the water buffalo and thus no genetic isolation between the individuals in Turkey, they were considered in three geographic groups: the Aegean-South Marmara Region (Afyon, Balıkesir and Bursa), the Black Sea Region (Sinop, Samsun and Tokat) and the Thrace Region (Istanbul-Silivri, Tekirdağ-Saray).
Figure 1
Region (Afyon, Balıkesir, Bursa), BSR – Black Sea Region (Sinop, Samsun, Tokat), THR – Thrace Region (Istanbul, Tekirdag)
Figure 1
Ünal et al.: Three water buffalo (Bubalus bubalis) populations in Turkey 4
Microsatellite loci and PCR-based profiling
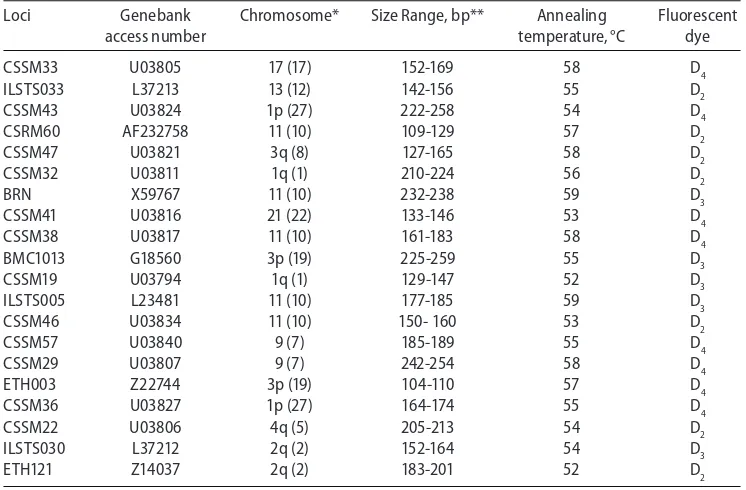
A total of 20 heterologous microsatellite loci from the recommended list by FAO for the buffalo were chosen for the study (http://www.fao.org/docrep/014/i2413e/i2413e00.pdf) and presented in Table 1.
Table 1
Microsatellite loci used in the present study to characterize water buffalo individuals and populations Loci Genebank Chromosome* Size Range, bp** Annealing Fluorescent
access number temperature, °C dye CSSM33 U03805 17 (17) 152-169 58 D4
*cattle chromosome assignments in parentheses, **allele size range in the present study
Statistical analyses
Allele frequencies, the number of alleles, observed heterozygosity and unbiased estimates of expected heterozygosities (HE: Nei 1987), Nei et al. (1983) DA distances and significant tests (1 000 permutations) for the DA were calculated using GENETIX v4.05.2 (Belkhir et al. 1996-2004). Heterozygosity deficiency within populations for each loci and all loci was estimated by FIS and pairwise genetic differentiation of the populations was estimated by FST (Weir & Cockerham 1984), using FSTAT v2.9.3.2 (Goudet 2002). In order to evaluate the significance of the FIS values, permutation tests were carried out by permuting the alleles within samples over all loci in each breed using the GENEPOP software (Raymond & Rousset 1995, Rousset 2008). Similarly, to test the significance of pairwise genetic differentiation (FST), permutation tests (1 000 permutations) implemented in the package GENETIX v4.05.2 were used. The Bonferroni correction (Weir 1996) was employed to determine the levels of probability for multiple tests. To visualize the genetic relationship between all of the individuals, a neighbour joining tree was built on the basis of allele sharing distances by employing Populations v1.2.31 software (Langella 1999), Factorial Correspondence Analysis using Genetix software was carried out also.
Results and discussion
In this study, the number of alleles (na), expected (HE) and observed (HO) heterozygosity, FIS and PIC values for each locus and population as well as the average values for the loci and populations are given in Table 2. Totally 103 alleles were detected in the whole sample and the number of alleles varied from 3 (loci CSSM57, ETH003) to 10 (locus CSSM47) with the mean number of alleles being 5.15 per locus (Table 2). The mean number of alleles observed in populations differed slightly: the minimum 3.70 was observed in THR and the maximum 4.35 was in BSR. The polymorphic information content (PIC) was calculated for each marker and ranged from 0.14 (locus CSSM32) to 0.820 (locus CSSM47), which has the highest number of alleles per locus in the present study. The average PIC in our populations was 0.4945. Nine microsatellites (ILSTS033, CSSM43, CSRM60, CSSM47, BMC1013, CSSM29, CSSM36, ILSTS030 and ETH121), having a PIC value higher than the threshold of 0.5 (Botstein et al. 1980, Seyedabadi et al. 2006), seemed to be highly informative and can be used in quantifying the genetic diversity and also in paternity studies in Turkey.
Importantly, for every loci and for each geographic population, HO was more than HE indicating the bottleneck (Cornuet & Luikart 1996) that was experienced by the buffalo populations in Turkey. The dramatic decline in the total population size of buffalo was reported by FAO (42 % between 2001 and 2011) (http://faostat.fao.org).
Ünal
Genetic variability measures in water buffalo across 20 microsatellite markers
Loci na PIC ASM (n=21) BSR (n=21) THR (n=14) ASM-FIS BSR-FIS THR-FIS
the loci employed and inbreeding is not yet very high. Perhaps the only significant +FIS in Black Sea Region is due to the significances observed in two of its loci. In terms of the mean expected heterozygosity of the populations, the range was 0.5208 (Aegean-South Marmara Region) to 0.5359 (Black Sea Region).
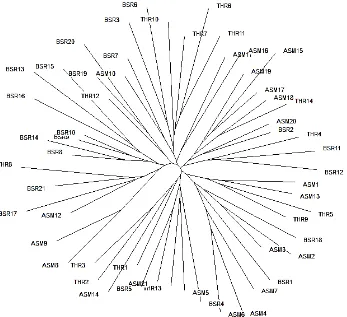
The genetic relatedness of the individuals was depicted by a neighbor joining tree where the allele sharing distances among 56 buffalo on 20 microsatellites were used (Figure 2). Generally, consecutive numbers belonging to a geographic region represent those individuals which were close in their collection sites. Most of the time, there are high similarities between the pairs of individuals coming from the same geographic regions, such as AS8 and AS9. However, in many instances, geographically distant individuals, even from different geographic regions, exhibited high genetic resemblances (e.g. TH12 ASM10, BS20). There seems to be no consistent genetic differentiation between the samples of the three geographically different populations, on the basis of the loci and samples used in the study (Figure 2).
Figure 2
Ünal et al.: Three water buffalo (Bubalus bubalis) populations in Turkey 8
The results of Factorial Correspondence Analysis in Figure 3 were shown in two dimensions. The axes represent 53.08 % (first), and 46.92 % (second axis) of the overall variability that exists between the buffalo individuals. On the Factorial Correspondence Analysis, individuals from the similar geography were indicated by the contours labeled as Black Sea Region (BSR-blue), Aegean-South Marmara Region (ASM-yellow) and Thrace Region (THR-white). Figure 3 depicted that although three populations representing three different geographic regions have some inertia, they are not very different from each other and there is also an overlap between the individuals of the populations.
(Afyon, Balıkesir, Bursa), BSR – Black Sea Region (Sinop, Samsun, Tokat), THR – Thrace Region (Istanbul, Tekirdag)
Figure 3
Factorial Correspondence Analysis results showing the relationship between all of the individuals analysed in the study
Population differentiations were compared on the basis of FST and Nei’s DA in Table 3. It can be seen that buffalos of Thrace and Black Sea Regions are the most similar ones because the minimum genetic distance (0.02194) was observed between this pair. However, since all pairwise FST values are significantly (P<0.05) different from each other, it can be concluded that all geographical populations are significantly different from each other. Because FST values are less than 0.05, pairwise differentiations can be considered as minor (Hartl 1980) as had been visualized by the Factorial Correspondence Analysis in Figure 3.
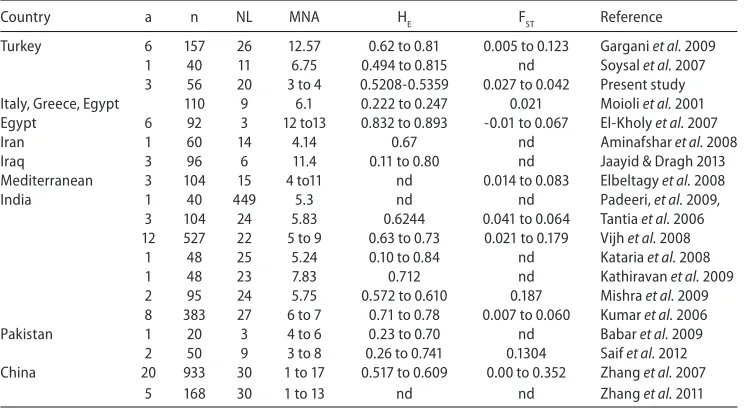
Kataria et al. 2009, Padeeri et al. 2009, Vijh et al. 2008, Kathiravan et al. 2009, Mishra et al. 2009, Zhang et al. 2007, Zhang et al. 2011). First of all, in these different studies, both the loci and the number of loci involved (Table 4) were different from each other. Thus, differences in the results may partly be attributable to the differences in the loci employed. In the two previous studies covering water buffalo from Turkey (Gargani et al. 2009, Soysal et al. 2007) and in the present study, samples were collected from nearly the same geographic regions. However, in the present study, except for one (CSSM047), the loci used were different from those of the previous studies. Within the afore-mentioned limitation, it is noted that genetic diversity (measured by MNA and HE) seemed to decrease among the water buffalo of Turkey, even in the last decade.
Table 3
Pairwise FST values (belows diagonal) and Nei’s DA genetic distances (aboves diagonal) based on 20 microsatellite loci for water buffalo populations from 3 different regions of Turkey
Aegean-South Marmara Region Black Sea Region Thrace Region
Aegean-South Marmara Region – 0.02708*** 0.03453***
Black Sea Region 0.033*** – 0.02194*
Thrace Region 0.042*** 0.027*** –
*** P<0.001; * P<0.05
Table 4
Published data for genetic diversity in different buffalo (Bubalus bubalis) populations
Country a n NL MNA HE FST Reference heterozygosity, FST: pairwise FST values, nd: no data available
Ünal et al.: Three water buffalo (Bubalus bubalis) populations in Turkey 10
(Moioli et al. 2001, El-Kholy et al. 2007, Elbeltagy et al. 2008) and neighbouring countries (Aminafshar et al. 2008, Jaayid & Dragh 2013) as seen in Table 4. Furthermore, it can be seen that on the basis of the samples studied in Turkey no distinct population/breed (FST: 0.027-0.042) was seen, different from what was observed in for instance India (FST: 0.179 or 0.187), China (0.352) or Pakistan (0.1304) Table 4 also shows that the differentiation between the populations is slightly more than what was observed (FST: 0.021) among the buffalo populations of Mediterranean countries (Moioli et al. 2001).
In Turkey, if the genetic diversity in water buffalo is decreasing, as predicted by the present study, it can be said that the cryoconservation of tissues of 56 individuals was timely. Since the usefulness of bovine microsatellite markers to assess the genetic variability in Anatolian water buffalo is confirmed in the present study, they can be utilized to minimize the loss of genetic diversity in the water buffalo populations of Turkey. Because individuals of different populations are not very distinct, the tissues of individuals kept in the gene banks might be used to support the populations (by nuclear transfers) in the future if populations further lose their existing genetic diversity. Finally, in Southeast Anatolia there are some other water buffalo populations (Atasever & Erdem 2008, Gürcan et al. 2011) which were not represented in the Gene Banks of Turkey and therefore were not included in the present study. Their samples must also be considered as a possible additional source of genetic diversity in the Gene Banks.
In conclusion, the results of the present study suggest that the water buffalo individuals represented by their tissues in Turkish Gene Banks confirmed that a bottleneck had been experienced in Turkey. They are genetically related to each other within and between geographic regions. The genetic diversity level captured in the gene banks for the buffalo populations in Turkey is within the range observed for the buffalo populations distributed around the Mediterranean countries but at the lower end. This information’s may be useful in acquiring new samples for the Turkish Gene Banks and in supporting the buffalo populations of Turkey in the future.
Acknowledgements
Research for this paper was supported by TURKHAYGEN-I project and the Turkish Scientific and Technical Research Council (Grant number: KAMAG 106G005). We thank Sezen Arat, Oya Akin, Bekir Ankarali, Arzu Taş Çaputçu and Fatih Karakaya for the organization and collection of the water buffalo samples.
References
Aminafshar M, Amirinia C, Vaez Torshizi R (2008) Genetic Diversity in Buffalo Population of Guilan Using Microsatellite Markers. J Anim Vet Adv 7, 1499-1502
Atasever S, Erdem H (2008) [Water buffalo raising and its future in Turkey]. OMÜ Zir Fak Dergisi, 23, 59-64 [in Turkish]
Babar ME, Hussain T, Nadeem A, Jabeen R, Javed M (2009) Genetic Characterization of Azakheli Buffalo Breed of Pakistan Using Microsatellites DNA Markers. Pak J Zool 9 (Suppl.), 361-366
Botstein D, White RL, Skolnick M, Davis RW (1980) Construction of a genetic linkage map in man using restriction fragment length polymorphisms. Am J Hum Genet 32, 314-331
Cornuet JM, Luikart G (1996) Description and Power Analysis of Two Tests for Detecting Recent Population Bottlenecks From Allele Frequency Data. Genetics 144, 2001-2014
Elbeltagy AR, Galal S, Abdelsalam AZ, El Keraby FE, Blasi M, Mohamed MM (2008) Biodiversity in Mediterranean buffalo using two microsatellite multiplexes. Livest Sci 114, 341-346
El-Kholy AF, Hassan HZ, Amin AMS, Hassanane MS (2007) Genetic diversity in Egyptian buffalo using microsatellite markers. Arab J Biotech 10, 219-232
FAO statistics (2011) FAO Statistics Division http://faostat.fao.org/site/573/DesktopDefault.aspx? PageID=573#ancor [last accessed 11.04.2014]
FAO (2011) Animal production and health guidelines. Molecular genetic characterization of Animal Genetic Resources. Commission on Genetic Resources for Food and Agriculture Food and Agriculture Organization of the United Nations. Rome, Italy http://www.fao.org/docrep/014/i2413e/i2413e00.pdf [last accessed 11.04.2014]
Gargani M, Pariset L, Soysal MI, Özkan E, Valentini A (2009) Genetic variation and relationships among Turkish water buffalo populations. Anim Genet 41, 93-96
Gürcan EK, Tuna YT, Soysal MI (2011) [The Morphometric Characterization of Anatolian Water Buffalo Accordıng to Body Measurements]. J Tekirdag Agricultural Faculty 8, 143-152 [in Turkish]
Goudet J (2010) FSTAT, a program to estimate and test gene diversities and fixation indices (version 2.9.3.2) www2.unil.ch/popgen/softwares/fstat.htm [last accessed 11.04.2014]
Hartl DL (1980) Principles of population genetics. Sinauer Assoc. Inc., Sunderland, MA, USA
Hoffmann I, Marsan PA, Barker JSF, Cothran EG, Hanotte O, Lenstra JA, Milan D, Weigend S, Simianer H (2004) New MoDAD marker sets to be used in diversity studies for the major farm animal species: recommendations of a joint ISAG/FAO working group. In: Proc 29th Int Conf Anim Genet, Tokyo, Japan
Jaayid TA, Dragh MA (2013) Genetic biodiversity in buffalo population of Iraq using microsatellites markers. Journal of Agricultural Science and Technology A 3, 297-301
Kataria RS, Sunder S, Malik G, Mukesh M, Kathiravan P, Mishra BP (2009). Genetic diversity and bottleneck analysis of Nagpuri buffalo breed of India based on microsatellite data. Russ J Genet, 826-832
Kathiravan P, Mishra BP, Kataria RS, Sadana DK (2009) Evaluation of genetic architecture and mutation drift equilibrium of Marathwada buffalo population in central India. Livest Sci 121, 288-293
Kumar S, Gupta J, Kumar N, Dikshit K, Navani N, Jain P, Nagarajan M (2006) Genetic variation and relationships among eight Indian riverine buffalo breeds. Mol Ecol 15, 593-600
Langella O (1999) Populations version 1.2.30. Distributed by the author, CNRS UPR9034, France
Michelizzi VN, Dodson MV, Pan Z, Amaral MEJ, Michal JJ, McLean DJ, Womack JE, Jiang Z (2010) Water Buffalo Genome Science Comes of Age. Int J Biol Sci, 6, 333-349
Mishra BP, Kataria RS, Bulandi SS, Prakash B, Kathiravan P, Mukesh M, Sadana DK (2009) Riverine status and genetic structure of Chilika buffalo of eastern India as inferred from cytogenetic and molecular marker-based analysis. J Anim Breed Genet 126, 69-79
Moioli B, Borghese A (2005) Buffalo Breeds and Management Systems. In: Borghese A (ed.) Buffalo Production and Research, Reu Technical Series 67, Rome, Italy, 51-76
Moioli B, Georgoudis A, Napolitano F, Catillo G, Giubilei E, Ligda C, Hassanane M (2001) Genetic diversity between Italian, Greek and Egyptian buffalo populations. Livest Prod Sci 70, 203-211
Muraleedharan P, Jain N, Naidu H, Rao G, Raddy C, Krs SR (2009) Development of multiplexes reactions for linkage mapping in water buffalo (Bubalis bubalis). Int J Integr Biol 6,154-172
Navani N, Jain PK, Gupta S, Sisodia BS, Kumar S (2002) A set of cattle microsatellite DNA markers for genome analysis of riverine buffalo (Bubalus bubalis). Anim Genet 33, 149-154
Ünal et al.: Three water buffalo (Bubalus bubalis) populations in Turkey 12
Nei M, Tajima F, Tateno Y (1983) Accuracy of Estimated Phylogenetic Trees from Molecular Data II. Gene Frequency Data. J Mol Evol 19, 153-170
Padeeri M, Jain N, Naidu H, Rao G, Reddy C, Rao KRS (2009) Development of multiplex reactions for linkage mapping in water buffalo (Bubalus bubalis). Int J Integr Biol (IJIB) 6, 154-157
Raymond M, Rousset F (1995) GENEPOP (version 1.2): population genetics software for exact tests and ecumenicism. J Heredity 86, 248-249
Rousset F (2008) Genepop’007: a complete reimplementation of the Genepop software for Windows and Linux. Mol Ecol Res 8, 103-106
Saif R, Babar ME, Awan AR, Nadeem A, Hashmi AS, Hussain T (2012) DNA fingerprinting of Pakistani buffalo breeds (Nili-Ravi, Kundi) using microsatellite and cytochrome b gene markers. Mol Biol Rep 39, 851-856 Sajid IA, Babar ME, Javed K (2007) Genetic Diversity of Nili-Ravi from Nili and Ravi Buffalo Breeds of Pakistan.
Ital J Anim Sci 6 (Suppl. 2), 314-317
Sambrook J, Russell DW (2001) Molecular cloning: a laboratory manual. 3rd ed., Cold Spring Harbor, NY, USA Seyedabadi H, Amirinia C, Banabazi MH, Emrani H (2006) Parentage verification of Iranian Caspian horse using
microsatellites markers. Iran J Biotechnol 4, 260-264
Soysal MI, Tuna YT, Gurcan EK, Ozkan E, Kok S, Castellano N, Cobanoglu O, Barone CMA (2007) Anatolian water buffaloes husbandry in Turkey: preliminary results on somatic characterization. Ital J Anim Sci 6 (Suppl. 2), 1302-1307
Tantia MS, Vijh RK, Mishra B, Kumar STB, Arora R (2006) Multilocus Genotyping to Study Population Structure in Three Buffalo Populations of India. Asian-Aust J Anim Sci 19, 1071-1078
Vijh RK, Tantia MS, Mishra B, Kumar STB (2008) Genetic relationship and diversity analysis of Indian water buffalo (Bubalus bubalis), J Anim Sci 86, 1495-1502
Weir BS (1996) Genetic Data Analysis II: Methods for discrete population genetic data. 2nd rev. exp. ed., Sinauer Associates, Inc., Sunderland, MA, USA
Weir BS, Cockerham CC (1984) Estimating F-Statistics for the Analysis of Population Structure. Evolution 38, 1358-1370
Yue XP, Li R, Xie WM, Xu P, Chang TC, Liu L, Cheng F, Zhang RF, Lan XY, Chen H, Lei CZ (2013) Phylogeography and Domestication of Chinese Swamp Buffalo. PLoS ONE 8, 2-13 (e56552)
Zhang Y, Su D, Yu Y, Zhang Y (2007) Genetic diversity and differentiation of Chinese domestic buffalo based on 30 microsatellite markers. Anim Genet 38, 569-575


![LESSON STUDY [Compatibility Mode]](data:image/gif;base64,R0lGODlhAQABAIAAAP///wAAACH5BAEAAAAALAAAAAABAAEAAAICRAEAOw==)