ARTICLE
Genetic polymorphism of two genes associated
with carcass trait in Egyptian buffaloes
Othman E. Othman
a,*
, Fawzia A. Zayed
b, Ali A. El Gawead
b,
Medhat R.A. El-Rahman
aa
Cell Biology Department, National Research Centre, Dokki, Egypt
bZoology Department, Faculty of Science, Zagazig University, Egypt
Received 10 May 2011; accepted 10 May 2011 Available online 22 June 2011
KEYWORDS
Buffalo; Leptin;
l-Calpain;
PCR; RFLP
Abstract Leptin and l-calpain have been considered as two candidate genes for carcass
performance and meat quality traits in the farm animals. The micromolar calcium-activated neutral
protease (CAPN1) gene encodesl-calpain that degrades myofibril proteins under the postmortem
conditions which appears to be the primary enzyme in the postmortem tenderization process.
Leptin is the hormone product of the obese (LEP) gene. The role of leptin as a lipostatic signal
regulating whole-body energy metabolism makes it one of the best physiological markers of body weight, food intake, reproduction and immune system functions.
Genomic DNA extracted from 100 healthy buffaloes was amplified using primers that were
designed from the cattle CAPN1and LEPgene sequences. The amplified fragments ofCAPN1
obtained from all tested buffalo DNA at 670-bp were digested withFokI endonuclease. The result
showed that all tested buffaloes are genotyped as CC forCAPN1. ForLEPgene, the amplified
fragments obtained from all tested buffalo DNA at 400-bp were digested withSau3AI
endonucle-ase. All buffalo animals investigated in the present study are genotyped as AA forLEPgene.
ª2011 Academy of Scientific Research and Technology. Production and hosting by Elsevier B.V.
All rights reserved.
1. Introduction
There is a considerable interest in the application of molecular genetic technologies in the form of specific DNA markers that are associated with various QTL to promote more efficient and relatively easy selection and breeding of farm animals with an advantage for the inheritable traits of growth rate, body weight, carcass merit, feed intake as well as milk yield and
composition[48]. Leptin and l-calpain have been considered
as two candidate genes for carcass performance and meat qual-ity traits in the farm animals.
* Corresponding author.
E-mail address:[email protected](O.E. Othman).
1687-157Xª2011 Academy of Scientific Research and Technology. Production and hosting by Elsevier B.V. All rights reserved.
Peer review under National Research Center, Egypt. doi:10.1016/j.jgeb.2011.05.003
Production and hosting by Elsevier
Academy of Scientific Research & Technology and
National Research Center, Egypt
Journal of Genetic Engineering and Biotechnology
Calpain is a ubiquitous cytoplasmic cysteine protease and
its activity is dependent on the concentration of calcium[47].
In cattle there are two genes of calpain that have been
identi-fied:CAPN1(l-calpain) andCAPN2(m-calpain)[50]. Bovine
CAPN1has been mapped to the telomeric end of BTA29[46].
Recently, a QTL for meat tenderness was found to be
segregat-ing in this region of BTA29[6,35]. The evaluation ofCAPN1
as a candidate gene for meat tenderness was supported by
Meat Animal Research Center, MARC[1].
TheCAPN1gene encodes al-calpain that degrades
myofi-bril proteins under postmortem conditions and appears to be the primary enzyme in the postmortem tenderization process
[26–28,3]. Regulation ofl-calpain activity has been correlated
with variation in meat tenderness in cattle[20].
InCAPN1gene, more than 100 single nucleotide
polymor-phisms (SNPs) have been identified in cattle[46,41,24]. Among
them, four polymorphisms, two non-synonymous SNPs (G316A and V530I) and two intronic SNPs (C4685T and C4751T) have been found to have significant effects on meat
tenderness[41,42,52,36,44,51].
Leptin is the hormone product of the obese (leptin) gene that has been mapped to bovine chromosome (BTA) 4
[49,43]. It is a 16-kDa protein that is synthesized by white
adi-pose tissue[55,22]. The role of leptin as a lipostatic signal in
the regulation of whole-body energy metabolism makes it one of the best physiological markers of the body weight, food
intake, energy expenditure[21,53,2], reproduction[11,18]and
certain immune system functions[33].
Leptin has been considered as a candidate gene for
perfor-mance, carcass and meat quality traits in beef cattle[17,4,29].
Genetic polymorphisms in the coding regions of the leptin gene in cattle have been associated with serum leptin
concen-tration [31], feed intake [30,39], milk yield [32,5] and body
fat[4,37].
With the aim of assessing the presence of sequence
poly-morphisms in the buffalo leptin gene, Orru` et al. [40]
sequenced the entire coding region and part of the introns on a panel of Italian river buffaloes. They identified a new set of single nucleotide polymorphism (SNP) that is useful for the association studies between the sequence polymor-phisms and the traits like the milk yield, feed intake, fat content and carcass and meat quality. To the best of our knowledge, this is the first published data on the genetic
poly-morphism ofCAPN1gene in river buffalo.
In the present study, the PCR–RFLP technique was used to
detect the genetic polymorphism within intron 14 ofCAPN1
and intron 2 ofLEPgenes. These two introns exhibited many
polymorphisms in cattle. Due to gene mapping conservation and nucleotide sequence homology between cattle and buffalo, we focused on the detection of genetic polymorphism within these two regions in Egyptian buffaloes for the first time.
2. Materials and methods
2.1. Animals
Water buffalo belongs to genusBubalus, speciesbubalis. Water
buffalo includes both river buffalo (Bubalus bubalis bubalis,
2n= 50) and swamp buffalo (Bubalus bubalis carabanesis,
2n= 48), the Egyptian buffaloes are of the river type.
Egyptian river buffaloes have been classified according to
minor phenotypic differences and their geographical locations, such as Beheiri, Menoufi and Balady which are found mainly
in Northern-Egypt and Saiedy found in Southern-Egypt[12].
These differences are not well defined to be relied on as
taxo-nomic classification. Few studies[15,14]have investigated the
genetic variations in Egyptian buffaloes and concluded that
all Egyptian river buffaloes belong to one population (B.
bubalis bubalis).
2.2. Genomic DNA extraction
Genomic DNA was extracted from the whole blood of 100 unrelated healthy female buffaloes according to the method
described by John et al.[23]with minor modifications. Briefly,
10 ml of blood taken on EDTA were mixed with 25 ml of cold sucrose-triton and double distilled water. The tubes were placed on ice for 10 min and mixed by inversion several times. After centrifugation, the pellet was re-suspended by nucleic ly-sis buffer using plastic pipette. The content was mixed with
108ll of 20% SDS and 150ll of proteinase. The tubes were
placed in a water bath at 37C overnight.
After 24 h of incubation, the tube contents were transferred to a 15-ml polypropylene tube and 1 ml of saturated NaCl was added and shaken vigorously for 15 s. After centrifuging at
3500 rpm for 15 min at 4C, the supernatant was transferred
to a clean 15-ml polypropylene tube and mixed with absolute ethanol. The tubes were agitated gently to mix the liquids and a fluffy white ball of DNA was formed. The precipitated DNA was picked up using the heat sealed pasture pipette, then washed twice in 70% ethanol and exposed to air to dry completely.
The DNA was dissolved in 200ll TE buffer in 1.5-ml
Microfuge tube and kept overnight in an incubator at 37C.
DNA concentration was determined and diluted to the
work-ing concentration of 50 ng/ll, which is suitable for polymerase
chain reaction.
2.3. Polymerase chain reaction (PCR)
The primers used in this study were designed from cattle
CAPN1andLEPgene sequences. The 670-bp DNA fragment
(exons 14–18) ofCAPN1gene[24]and the 400-bp DNA
frag-ment (intron 2) ofLEPgene[30]were amplified using buffalo
DNA.
CAPNI:
Primer forward: TTC AGG CCA ATC TCC CCG ACG Primer reverse: GAT GTT GAA CTC CAC CAG GCC CAG
LEP:
Primer forward: TGG AGT GGC TTG TTA TTT TCT TCT
Primer reverse: GTC CCC GCT TCT GGC TAC CTA ACT
A PCR cocktail consists of 1.0lM forward and reverse
primers and 0.2 mM dNTPs, 10 mM Tris (pH 9), 50 mM
KCl, 1.5 mM MgCl2 and 1.25 U of Taq polymerase. The
The reaction was run in MJ research PTC-100 Thermocycler
for 1 min at 94C (denaturation), 2 min at 62C forCAPN1
or 55C forLEP(annealing) and 2 min at 72C (extension)
for 30 cycles. The PCR reaction products were electrophoresed
on 1.5% agarose/1·TBE gel stained with ethidium bromide to
test the amplification success.
2.4. RFLP and agarose gel electrophoresis
Twenty microliters of PCR products were digested with 10
units of restriction enzymes FokI (for CAPN1) or Sau3AI
(forLEP)in a final reaction volume 25ll. The reaction
mix-ture was incubated at 37C in water bath for 5 h. After
restric-tion digesrestric-tion, the restricted fragments were analyzed by
electrophoresis on 2.5% agarose/1·TBE gel stained with
ethi-dium bromide. The 100-bp ladder was used as a molecular size marker. The bands were visualized under UV light and the gels were photographed using Mp4 plus Polaroid Camera.
3. Results and discussion
Several QTL for meat performance and carcass trait produc-tion in farm animals have been identified. A number of poten-tial candidate genes have been identified and selected for analyses based on a known relationship with physiological or biochemical processes and production traits. It is seldom re-ported that one particular polymorphism in a candidate gene would influence several traits of economic importance in
live-stock at the same time. Leptin andl-calpain have been
consid-ered as two candidate genes for carcass performance and meat quality traits in farm animals.
Calpain is a ubiquitous cytoplasmic cysteine protease and
its activity is dependent on the concentration of calcium[47].
Two isoforms of calpain have been identified; l-calpain
(CAPN1) that requires calcium at micromolar concentrations for activity and m-calpain (CAPN2), for which calcium at
mil-limolar concentrations is needed[50]. Both calpains have been
shown to degrade most of the myofibrillar protein excluding
actin and myosin[3]. Regulation ofl-calpain activity has been
correlated with variation in meat tenderness [20]. Bovine
CAPN1andCAPN2genes have been mapped to chromosome
29[46].
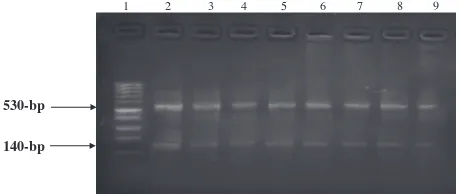
In this study by using PCR and RFLP techniques, we aimed to detect the genetic polymorphism within intron 14
of buffalo CAPN1. The amplified fragments obtained from
all the tested buffalo DNA (100 animals) were at 670-bp (Fig. 1).
These PCR amplified fragments were digested with FokI
endonuclease. Depending on the alteration of the presence of C/T at position 4685 (within intron 14), it is easy to differenti-ate between 3 different genotypes: TT with undigested one fragment at 670-bp, CC with two digested fragments at bp and 140-bp and TC with three fragments at 670-bp, 530-bp and 140-530-bp. All buffalo animals investigated in this study are genotyped as CC where all the tested buffalo DNA
ampli-fied fragments were digested withFokI endonuclease and gave
two digested fragments at 530- and 140-bp. The restriction site is resulted due to the presence of C base at position 4685 in all animals and the absence of T base in this position within
in-tron 14 (Fig. 2).
Thirty-eight SNPs in bovineCAPN1were identified in two
sires[41]. They identified six SNPs in introns being two
substi-tutions T/C (intron 7), one substitution C/T in intron 8 and three mutations: T/C, C/T and G/A (intron 18). Two SNPs in exon 6 were synonymous substitutions: G/A and T/C.
The two SNPs were reported by Page et al.[41,42]in bovine
CAPN1 gene representing exon 9 (A/G) and exon 14 (G/C)
predicted amino acid changes: substitution in exon 9 (Gly316/
Ala316) and exon 14 (Val530/Ile530). Analysis of genotypes
and shear force values in the two sires revealed a difference
be-tweenCAPN1alleles in which the allele encoding isoleucine at
position 530 and glycine at position 316 associated with de-creased meat tenderness (inde-creased shear force values) relative to the allele encoding valine at position 530 and alanine at
position 316 (p< 0.05).
The genetic analysis of these both SNPs at 316 and 530 positions was done in two bovine populations by Page et al.
[42]and indicated an association of genotype and phenotype
for both markers. Animals homozygous for the C allele at
marker 316 had lower shear force (p= 0.02) than animals of
CG or GG genotype, whereas the animals with homozygous GG genotype at marker 530 had lower shear force
(p= 0.04) than animals of AG or AA genotype.
Juszczuk-Kubiak et al. [24] reported the appearance of
three SSCP patterns – within intron 14 of bovine CAPN1–
in 141 tested animals belonging to seven cattle breeds. These three SSCP patterns were confirmed by RFLP and gave three different genotypes, CC (35%), CT (35%) and TT (30%) due
to the transition of CfiT at position 4685 in tested animals
which showed T allele. The allele frequency was 0.62 and 0.38 for C and T allele, respectively. The authors reported that
1 2 3 4 5 6 7 8 9
670-bp
Figure 1 Ethidium bromide-stained gel of PCR products
repre-senting amplification ofCAPN1gene in Egyptian buffaloes. Lane
1: 100-bp ladder marker. Lanes 2–9: 670-bp PCR products amplified from Egyptian buffalo DNA.
1 2 3 4 5 6 7 8 9
530-bp
140-bp
Figure 2 The electrophoretic pattern obtained after digestion of
PCR amplified buffalo CAPN1 with FokI restriction enzyme.
the TT genotype was significantly associated with a higher lean share in valuable cuts; the advantage over the CC genotype
was 4.5% (p60.01).
Casas et al.[7]assessed the association of four SNPs in the
bovineCAPN1 gene with meat trait in Brahman population.
The CAPN530 marker was uninformative in this population, the G allele seems to be fixed or at high frequency. The marker
CAPN316 was associated (p< 0.05) with sensory panel
ten-derness score. The three markers CAPN316, CAPN4753 and
CAPN5331 were associated with hump height (p< 0.02).
An-other new SNP marker in this population was reported by
White et al.[52]. This marker, CAPN4751, was associated with
shear force on postmortem d 7 (p< 0.01), 14 (p= 0.015) and
21 (p< 0.001) in this population demonstrating that genetic
variation important for tenderness segregates in cattle at or
nearCAPN1.
By direct DNA sequencing of 24 unrelated Korean cattle,
Cheong et al.[9]identified 39 polymorphisms in Korean cattle
CAPN1gene within exons and their flanking regions. Among
them, 12 common polymorphic sites were selected for
genotyp-ing in the beef cattle (n= 421). Associations ofCAPN1
poly-morphisms with cold carcass weight (CW) and marbling score
(MS) were analyzed. One polymorphism (479CfiT) showed
significant associations with MS. The T allele revealed an addi-tive effect on MS, i.e., the lowest MS was found in T/T (MS = 0.94), intermediate in C/T (MS = 1.56) and the
high-est in C/C (MS = 2.34) (p= 0.02).
Leptin is the hormone product of the obese (LEP) gene[55]
which is located on bovine chromosome 4 (BTA 4)[49]. It is a
16-kDa protein that synthesized by white adipose tissue[30].
The role of leptin as a lipostatic signal regulating whole-body energy metabolism makes it one of the best physiological markers of body weight, food intake, energy expenditure
[21,53,2,16,13,54,19], reproduction[11,18]and certain immune
system functions[33].
Polymorphisms have been reported in the coding regions of
theLEPgene that show considerable associations with feed
in-take[30,29,39], carcass merit[4,37,25], serum leptin
concentra-tion[31]and milk quantity and quality[5,32,34,8]in cattle.
In the present study by using PCR, the genomic buffalo DNA was amplified using oligonucleotide primers that were
designed from the cattle LEP gene sequence. The amplified
fragments obtained from all tested buffalo DNA (100 animals)
were at 400-bp (Fig. 3).
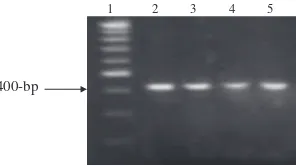
The PCR amplified fragments were digested with Sau3AI
endonuclease to detect the genetic polymorphism within intron
2 of buffaloLEPgene. With this technique, it is easy to
differ-entiate between 3 different genotypes: AA with one undigested fragment at 400-bp, BB with two digested fragments at 300-and 100-bp 300-and AB with three fragments at 400-, 300- 300-and 100-bp. All buffalo animals investigated in the present study are genotyped as AA where all the tested buffalo DNA
ampli-fied fragments were digested with Sau3AI endonuclease and
gave one undigested fragment at 400-bp (Fig. 4).
The presence of A allele in high frequency is also reported
in cattle by Liefers et al.[30]and Madeja et al.[34]. By using
the same primer andSau3AI enzyme which were used in the
present study, Liefers et al.[30]genotyped 613 Holstein
Frie-sian heifers and found that the genotyping frequencies were 0.813, 0.185 and 0.002 for AA, AB and BB, respectively. Also,
Madeja et al.[34]genotyped 117 Polish Black- and White-bulls
and reported the frequencies of alleles as 0.86, 0.11 and 0.03 for A, B and C alleles, respectively.
Liefers et al. [30] studied the restriction fragment length
polymorphism located in intron 2 of the leptin gene in cattle. The authors showed significant differences between genotypes AA and AB (BB genotype was excluded from the analysis be-cause it appeared only in one animal) for milk yield, protein yield, feed intake and lactose yield. The difference of milk yield increased from 1.23 to 1.32 kg/d. Significance levels for mean live weight and live weight at week 15 were between 0.05 and 0.10. The difference for live weight at week 15 between the
two genotypes was 10.8 kg (p= 0.077) and for mean live
weight over the first 15 weeks of lactation, the difference was
9.1 kg (p= 0.097). The genotype AB tended to show the
high-er body weight in comparison with genotype AA.
Allelic variation (cytosine C to thymine T transition that
re-sults in an Arg25Cys) in the LEP gene has been associated
with higher leptin mRNA levels in adipose tissue and increased
fat deposition in mature beef cattle[25]. Buchanan et al.[5]
re-ported that this genetic variant is also present in dairy breeds. Body fat reserves play an important role in sustaining high milk production in early lactation when the energy intake is limited. Animals homozygous for the T allele produced more milk (1.5 kg/d vs. CC animals) and had higher somatic cell count linear scores without significantly affecting milk fat or protein percent over the entire lactation. The increase in milk yield is most prominent in the first 100 days of lactation (2.44 kg/d) and declining to 1.74 kg/d between 101 and 200 days in lactation. These results indicated that the leptin TT genotype is associated with increased milk and protein yield without changing yield of the fat of the milk.
Nkrumah et al.[38]reported an association between SNP
in the 5 untranslated promoter region of the bovine leptin gene
400-bp
1 2 3 4 5 6 7 8 9
Figure 3 Ethidium bromide-stained gel of PCR products
repre-senting amplification ofLEPgene in Egyptian buffaloes. Lane 1:
100-bp ladder marker. Lanes 2–9: 400-bp PCR products amplified from Egyptian buffalo DNA.
1 2 3 4 5
400-bp
Figure 4 The electrophoretic pattern obtained after digestion of
PCR amplified buffalo LEP products with Sau3AI restriction.
with serum leptin concentration, growth, body weight, feed in-take, feeding behavior and carcass merit in cattle. The authors detected that animals with the TT genotype of a less frequent cytosine/thymine (C/T) substitution detected at position 528 in the bovine leptin promoter showed 48% and 39% increases in
serum leptin concentration (p< 0.001), 39% and 31%
in-creases in backfat thickness (p< 0.001) and 13% and 9%
in-creases in marbling score (p= 0.01) compared with CC or CT
genotypes, respectively. Animals with the TT genotype also
showed significantly higher feed intake (p< 0.001), growth
rate and metabolic body weight (p< 0.05) and live weight at
slaughter (p< 0.01).
The same authors reported that the animals with the GG genotype of a more frequent cytosine/guanine (C/G) substitu-tion at posisubstitu-tion 1759 in the bovine leptin promoter also
showed higher feed intake (p= 0.001), growth rate (p< 0.1)
and body weight (p< 0.01). The thymine allele at position
528 and the guanine allele at position 1759 were separately
associated with higher feeding duration (p< 0.05).
Five SNPs (UASMS1, UASMS2, UASMS3, E2JW and
E2FB) were genotyped by Schenkel et al.[45]in bovine. Only
four SNPs were analyzed because UASMS1 and UASMS3 were completely linked. The two leptin exon-2 SNPs were
asso-ciated with grade fat, lean yield and grade fat (E2JW,p< 0.01
and E2FB,p< 0.05) and they interacted in their effect on lean
meat tenderness (p< 0.01).
The association of E2FB with fat yield, grade fat and lean
yield was previously reported by Nkrumah et al. [37], where
E2FB was genotyped in 144 commercial cattle from five genet-ic lines with different foundation breeds. These authors con-cluded that animals carrying the T allele vs. the C allele produce carcasses with poorer grades and lower lean meat yields, but do not differ in carcass marbling. Buchanan et al.
[4]also reported a significant E2FB genotype effect on grade
fat and average fat where the T allele associated with higher fat but with no significant association with carcass marbling
score. Crews et al.[10]did not find any association of E2FB
with carcass traits of 433 Charolais and Charolais-cross steers, which included backfat thickness and carcass marbling.
On conclusion of the first study was done to detect the genetic polymorphism of carcass trait genes in Egyptian
buffaloes, the monomorphism of CAPN1 and LEP genes
declared that all Egyptian buffaloes belong to one population without genetic difference in these two carcass trait genes. The absence of molecular genetic variation in Egyptian buffaloes
was previously reported by El-Kholy et al.[15]and El-beltagy
et al. [14] who studied the genetic diversity of North- and
South-Egyptian buffalo populations using microsatellites and reported that all Egyptian buffaloes belong to one population.
References
[1] AMSA, Research Guidelines for Cookery, Sensory Evaluation and Instrumental Tenderness Measurements of Fresh Meat, Am. Meat Sci. Assoc., Chicago, IL, 1995.
[2] C.A. Baile, M.A. Della-Fera, R.J. Martin, Annu. Rev. Nutr. 20 (2000) 105–127.
[3] J.A. Beltran, I. Jaime, P. Santolaria, C. Sanudo, P. Alberti, C. Roncales, Meat Sci. 45 (1997) 201–207.
[4] F.C. Buchanan, C.J. Fitzsimmons, A.G. Van Kessel, T.D. Thue, C. Winkelman-Sim, S.M. Schmutz, Genet. Sel. Evol. 34 (2002) 105–116.
[5] F.C. Buchanan, A.G. Van Kessel, C. Waldner, D.A. Christensen, B. Laarveld, S.N. Schmutz, J. Dairy Sci. 86 (2003) 3164–3166.
[6] E. Casas, S.D. Shackelford, J.W. Keele, R.T. Stone, S.M. Kappes, M. Koohmaraie, J. Anim. Sci. 78 (2000) 560–569. [7] E. Casas, S.N. White, D.G. Riley, T.P. Smith, R.A. Brenneman,
T.A. Olson, D.D. Johnson, S.W. Coleman, G.L. Bennett, C.C. Chase, J. Anim. Sci. 83 (2005) 13–19.
[8] R.C. Chebel, F. Susca, J.E.P. Santos, J. Dairy Sci. 91 (2008) 2893–2900.
[9] H.S. Cheong, D. Yoon, B.L. Park, L.H. Kim, J.S. Bae, S. Namgoong, H.W. Lee, C.S. Han, J.O. Kim, I.C. Cheong, H.D. Shin, BMC Genet. 9 (2008) 33–39.
[10] D.H. Crews, J.D. Nkrumah, J. Yu, S.S. Moore, Can. J. Anim. Sci. 84 (2004) 749–750.
[11] M.J. Cunningham, D.K. Clifton, R.A. Steuner, Biol. Reprod. 60 (1999) 216–222.
[12] DAD-IS, Domestic Animal Diversity Information Systemwww/ fao.org.dad, 2004.
[13] C. Delavaud, A. Ferlay, Y. Faulconnier, F. Bocquier, G. Kann, Y. Chilliard, J. Anim. Sci. 80 (2002) 1317–1328.
[14] A.R. El-beltagy, S. Galal, A.Z. Abdelsalam, F.E. El Keraby, M. Blasi, M.M. Mohamed, Livest Sci. 114 (2008) 341–346. [15] A.F. El-Kholy, H.Z. Hassan, A.M.S. Amin, M.S. Hassanane,
Arab J. Biotechnol. 10 (2007) 219–232.
[16] R.A. Ehrhardt, R.M. Slepetis, J.S. Willott, M.E.V. Amburgh, A.W. Bell, Y.R. Boisclair, J. Endocrinol. 166 (2000) 519–528. [17] C.J. Fitzsimmons, S.M. Schmutz, R.D. Bergen, J.J. McKinnon,
Mamm. Genome 9 (1998) 432–434.
[18] M.R. Garcia, M. Amstalden, S.W. Williams, R.L. Stanko, C.D. Morrison, D.H. Keisler, S.E. Nizielski, G.L. Williams, J. Anim. Sci. 80 (2002) 2158–2167.
[19] T.W. Geary, E.L. McFadin, D.M. MacNeil, E.E. Grings, R.E. Short, R.N. Funston, D.H. Keisler, J. Anim. Sci. 81 (2003) 1–8. [20] G.H. Geesink, M. Koohmaraie, J. Anim. Sci. 77 (1999) 2685–
2692.
[21] K.L. Houseknecht, C.A. Baile, R.L. Matteri, M.E. Spurlock, J. Anim. Sci. 76 (1998) 1405–1420.
[22] S. Ji, G.M. Willis, R.R. Scott, M.E. Spurlock, Anim. Biotechnol. 9 (1998) 1–4.
[23] S.W.M. John, G. Weitzner, R. Rozen, C.R. Scriver, Nucleic Acid Res. 19 (1991) 408–412.
[24] E. Juszczuk-Kubiak, T. Sakowski, K. Flisikowski, K. Wicinska, J. Oprzadek, S.J. Rosochacki, J. Appl. Genet. 45 (2004) 457– 460.
[25] P.J. Kononoff, H.M. Deobald, E.L. Stewart, A.D. Laycock, F.L. Marquess, J. Anim. Sci. 83 (2005) 927–932.
[26] M. Koohmaraie, Biochemistry 74 (1992) 239–245. [27] M. Koohmaraie, Meat Sci. 36 (1994) 93–104. [28] M. Koohmaraie, Meat Sci. 43 (1996) S193–S201.
[29] R. Lagonigro, P. Wiener, F. Pilla, J.A. Woolliams, J.L. Williams, Anim. Genet. 34 (2003) 371–374.
[30] S.C. Liefers, M.F.W. Te-Pas, R.F. Veerkamp, T. van der Lende, J. Dairy Sci. 85 (2002) 1633–1638.
[31] S.C. Liefers, M.F.W. Te-Pas, R.F. Veerkamp, Y. Chilliard, C. Delavaud, R. Gerritsen, T. van der Lende, Mamm. Genome 14 (2003) 657–663.
[32] S.C. Liefers, R.F. Veerkamp, M.F.W. Te-Pas, C. Delavaud, Y. Chilliard, T. van der Lende, J. Dairy Sci. 86 (2003) 799–807. [33] G.M. Lord, G. Matarese, J.K. Howard, R.J. Baker, S.R. Bloom,
R.I. Lechler, Nature 394 (1998) 897–900.
[34] Z. Madeja, T. Adamowicz, A. Chmurzynska, T. Jankowski, J. Melonek, M. Switonski, T. Strabel, J. Dairy Sci. 87 (2004) 3925– 3927.
[36] C.A. Morris, N.G. Cullen, S.M. Hickey, P.M. Dobbie, B.A. Veenvliet, T.R. Manley, W.S. Pitchford, Z.A. Kruk, C.D. Bottema, T. Wilson, Anim. Genet. 37 (2006) 411–414. [37] J.D. Nkrumah, C. Li, J.B. Basarab, S. Guercio, Y. Meng, B.
Murdoch, C. Hansen, S.S. Moore, Can. J. Anim. Sci. 84 (2004) 211–219.
[38] J.D. Nkrumah, C. Li, J. Yu, C. Hansen, D.H. Keisler, S.S. Moore, J. Anim. Sci. 83 (2005) 20–28.
[39] J. Oprzadek, K. Flisikowski, L. Zwierzchowski, E. Dymnicki, Anim. Sci. Papers Rep. 21 (2003) 135–145.
[40] L. Orru`, G.M. Terzano, F. Napolitano, M.C. Savarese, G. De Matteis, M.C. Scata`, G. Catillo, B. Moioli, Ital. J. Anim. Sci. 6 (2) (2007) 342–344.
[41] B.T. Page, E. Casas, M.P. Heaton, N.G. Cullen, D.L. Hyndman, C.A. Morris, A.M. Crawford, T.L. Wheeler, M. Koohmaraie, J.W. Keele, T.P. Smith, J. Anim. Sci. 80 (2002) 3077–3085.
[42] B.T. Page, E. Casas, R.L. Quaas, R.M. Thallman, T.L. Wheeler, S.D. Shackelford, M. Koohmaraie, S.N. White, G.L. Bennett, J.W. Keele, M.E. Dikeman, T.P. Smith, J. Anim. Sci. 82 (2004) 3474–3481.
[43] D. Pomp, T. Zou, A.C. Clutter, W. Barendse, J. Anim. Sci 75 (5) (1997) 1427.
[44] G. Rincon, J.F. Medrano, Anim. Genet. 37 (2006) 294–295.
[45] F.S. Schenkel, S.P. Miller, X. Ye, S.S. Moore, J.D. Nkrumah, C. Li, J. Yu, I.B. Mandell, J.W. Wilton, J.L. Williams, J. Anim. Sci. 83 (2005) 2009–2020.
[46] T.P. Smith, E. Casas, C.E. Rexroad, S.M. Kappes, J.W. Keele, J. Anim. Sci. 78 (2000) 2589–2594.
[47] H. Sorimachi, A. Freiburg, B. Kolmerer, S. Ishiura, G. Stier, C.C. Gregorio, D. Labeit, W.A. Linke, K. Suzuki, S. Labeit, J. Mol. Boil. 270 (1997) 688–695.
[48] R.J. Spelman, H. Bovenhuis, Anim. Genet. 29 (1998) 77–84. [49] R.T. Stone, S.M. Kappes, C.W. Beattie, Mamm. Genome 7
(1996) 399–400.
[50] K. Suzuki, H. Sorimachi, FEBS Letters 433 (1998) 1–4. [51] A.L. Van Eenennaam, J. Li, R.M. Thallman, R.L. Quaas, M.E.
Dikeman, C.A. Gill, D.E. Franke, M.G. Thomas, J. Anim. Sci. 85 (2007) 891–900.
[52] S.N. White, E. Casas, T.L. Wheeler, S.D. Shackelford, M. Koohmaraie, D.G. Riley, C.C. Chase, D.D. Johnson, J.W. Keele, T.P. Smith, J. Anim. Sci. (2005) 83: 20.
[53] S.C. Woods, R.J. Seeley, D. Porte, M.W. Schwartz, Science 280 (1998) 1378–1383.
[54] T. Yamada, S.I. Kawakami, N. Nakanishi, J. Anim. Sci. 74 (2003) 95–100.