Gadjah Mada International Journal of Business Vol. 18, No. 1 (January-April, 2016): 1-19
The Role of Emotional and Rational Trust in Explaining
Attitudinal and Behavioral Loyalty:
An Insight Into SME Brands
Chuan Huat Ong,
*Salniza Md. Salleh,
and
Rushami Zien Yusoff
School of Business Management, Universiti Utara Malaysia, Kedah, Malaysia
Abstract: Brand trust is a powerful asset for Small and Medium size Enterprises (SMEs) to retain good relationships with their loyal customers, to ensure their long term survival. However, SME managers first need to understand the consequences of the two unique emotional and rational components of trust on attitudinal and behavioral loyalty, because both loyalty dimensions have unique consequences for a brand’s performance. Hence, this study aims to answer two research issues: (1) Do brand intentions and brand reliability influence both attitudinal loyalty and behavioral loyalty? (2) Which component of trust explains attitudinal and behavioral loyalty more? Data were obtained from 210 customers through the use of an intercept survey method on successful SME brands in the restaurant industry. The findings revealed that emotional and rational trust influenced both attitudinal and behavioral loyalty. Despite that, customers have a higher tendency to exhibit attitudinal and behavioral loyalty when a brand can be relied upon to deliver on its promises.
Abstrak: Kepercayaan atas merek adalah aset yang kuat untuk usaha kecil dan menengah (UKM) untuk mempertahankan hubungan baik dengan pelanggan setia mereka, dan juga untuk memastikan kelangsungan hidup jangka panjang mereka. Namun, manajer UKM harus terlebih dahulu memahami konsekuensi dua komponen kepercayaan emosional dan rasional yang unik terhadap loyalitas sikap dan perilaku, karena kedua dimensi loyalitas tersebut memiliki konsekuensi yang unik pada kinerja suatu merek. Oleh karena itu, penelitian ini bertujuan untuk menjawab dua isu: (1) apakah tujuan dan keandalan merek berpengaruh, baik terhadap sikap loyalitas maupun sikap perilaku?; (2) Apa komponen yang lebih menjelaskan sikap loyalitas dan perilaku? Data diperoleh dari 210 pelanggan melalui peng gunaan metode survei intercept
pada merek UKM yang sukses di industri restoran. Temuan menunjukkan bahwa kepercayaan emosional dan rasional mempengaruhi loyalitas baik sikap maupun perilaku. Namun, pelang gan memiliki kecenderungan lebih tinggi untuk menunjukkan sikap loyalitas dan perilaku ketika sebuah merek dapat diandalkan untuk memenuhi janjinya.
Keywords:attitudinal loyalty; behavioral loyalty; brand intentions; brand reliability; SME Brands
Introduction
The Small and Medium size Enterprises (SMEs) have served as the backbone of the economy for Malaysia. In addition, almost all of the business establishments in Malaysia are SMEs (SME Corp 2012). These SMEs have contributed 32 percent to the nation’s Gross Domestic Product (GDP) and more than 50% to employment in 2011 (Depart-ment of Statistics 2012; SME Corp 2012). The foodservice industry has always been re-silient in contributing toward global growth even during economic recessions. In addition, SMEs in the service industries, especially the foodservice industry, play an important role in contributing toward Malaysia’s economy (SME Corp 2012). However, big brands such as McDonald’s and KFC have dominated about 70% of the Malaysian foodservice in-dustry (Euromonitor 2013). Such circum-stances possess the possibility of wiping out weaker SME brands, because SMEs rely on domestic market revenues for their survival (SME Corp 2012). According to Baldinger et al. (2002), SME brands are more volatile in losing out on market share as compared to big brands. Besides being faced by the com-mon lack of resources which disadvantage the SMEs, brand related issues are another one of the hindrances to SMEs’ growth (Centeno et al. 2013). One of the best ways for SME brands to increase their market share is to retain their loyal customers through re-peated sales in a trusting relationship (Aaker 1996; Baldinger et al. 2002; Eggers, O’Dwyer et al. 2013; Rauyruen et al. 2009). Prior to that occurring, the SMEs’ managers first need to understand the consequences of the two unique emotional and functional components of trust (i.e. brand intentions and brand reli-ability) on attitudinal and behavioral loyalty, because both loyalty dimensions have unique
consequences on brand perfor mance (Chaudhuri and Holbrook 2001; Rauyruen et al. 2009).
For the past few decades, research into the SMEs’ branding has sparked interest among academics and practitioners around the world (Ahmad et al. 2012). However, studies done by past researchers each con-tributed from a different branding aspect. Some studies have tried to investigate brand-ing practices among SMEs (Ahonen 2008), the perception of SME owners or managers about brand building and management (Gundala and Khawaja 2014; Mitchell et al. 2012; Spence and Essoussi 2010), SME branding as a competitive strategy to improve business performance (Abimbola 2001; Agostini et al. 2014; Merriless et al. 2011), the determinants of customer loyalty (Lam et al. 2009), factors of brand equity on SMEs’ perfor mance (Asamoah 2014), the differ-ences of micro, small and medium enterprises’ practices on branding and marketing (Reijonen et al. 2012), and the ways to build a brand identity and image through websites (Opoku et al. 2007; Vlahvei et al. 2011). This study acknowledged the contributions to-wards the SMEs’ branding literature by the past studies mentioned above. However, there is still a lack of studies into researching the SMEs’ brands, as compared to that for the big brands (Centeno et al. 2013; Krake 2005).
components in conceptualizing trust, such as altruism, benevolence, credibility, confi-dence, dependability, fairness, honesty, integ-rity and reliability (Delgado-Ballester et al. 2003; Moorman et al. 1993; Ganesan 1994; Morgan and Hunt 1994; Garbarino and Johnson 1999; Sirdeshmukh et al. 2002; Grayson et al. 2008). Despite some termi-nology having an almost similar meaning, it is noteworthy that different reference subjects for tr ust have different conceptualizations. For instance benevolence, in the context of interpersonal trust between intimate partners or couples, is defined as the intention of a partner to seek personal benefit or together-ness benefit in a relationship (Larzelere and Huston 1980). Meanwhile benevolence, in the context of the interpersonal trust between retailer-vendor, is defined as the extent to which the retailer believes the vendor will have good faith in his/her welfare in a situa-tion where a new commitment has not been made, and when there is a new condition (Ganesan 1994). On the other hand, Delgado et al. (2003) defined benevolence using dif-ferent terminology, intentions, in the context of trust in a brand. Intentions, in the context of a brand’s trust, refers to the consumer’s belief that the brand will prioritize the wel-fare of its consumers when unforeseen issues with product consumption happen. Follow-ing this, a consistent conceptualization of trust, according to the reference subject, is important in order to analyze the different components’ contribution toward the brand’s relationships. Given that the reference sub-ject of this study is the SMEs’ brands, trust in this study refers to two distinct compo-nents, namely intentions and reliability, as proposed by Delgado et al. (2003) to mea-sure trust in the context of the brand.
This study is different from earlier stud-ies because this study examines the emotional
and functional components of trust sepa-rately, in the context of a brand on the attitu-dinal and behavioral loyalties. Besides, Bagozzi (1975) had previously looked into specific social and psychological processes (i.e. trust) that assist in the creation of mar-keting exchanges. This study acknowledges that past studies have also tested the con-struct of trust either as a composite variable, (Gurviez and Korchia 2003) or separately, (Delgado-Ballester and Munuera-Aleman 2005; Kantsperger and Kunz 2010). How-ever to the best of our knowledge, there are still no empirical studies to be found examing the components of brand trust (i.e. in-tentions and reliability) on attitudinal and behavioral loyalty for the SMEs’ brands. It is important to study the relationship of these two unique components on SME brand loy-alty because the brand management of an SME is different from the brand management of large enterprises. Berthon, Ewing, and Napoli (2008) have found that 9 out of the 10 brand management dimensions recom-mended in Keller’s report card (2000) had significant differences between SMEs and large enterprises. Besides, some brand rela-tionships may have different impacts on SME brands (Baldinger et al. 2002). Researchers have found that not every factor which con-tributed toward the success of a big firm has the same impact on the SMEs (Caloghirou et al. 2004; Parijat et al. 2011; Shashank et al. 2013).
and Kunz (2010), where components of trust (i.e. benevolence and credibility) were each separately studied. Besides, the literature has argued that emotion based trust tends to be long lasting, compared to common rational based trust (Kantsperger and Kunz 2010; McAllister 1995; Williams 2001). Hence, the result of this study would be useful for SMEs’ managers to gain a deeper understanding of these two distinct components of trust on their customers’ loyalty in order to execute effective marketing strategies.
Literature Review
Brand Loyalty
Brand loyalty is the loyalty derived from the brand itself, in regard of the value saving a product or service has to offer. Reviews of the available literature have shown that brand loyalty consists of two unique dimensions, namely attitudinal and behavioral loyalty (Aaker 1991; Assael 1998; Day 1969; Jacoby and Kyner 1973; Oliver 1999; Tucker 1964). Following this, brand loyalty in this study re-fers to the degree of both attitudinal and be-havioral loyalty by diners toward a restaurant brand (Chaudhuri and Holbrook 2001). Atti-tudinal loyalty is defined as the degree of the consumers’ commitment, willingness to pay more, and word of mouth recommendation for a particular SME brand. Customers who are loyal attitudinally will have a higher ten-dency to spread positive word of mouth rec-ommendations among friends and family, have a higher commitment to the brand, and will not be reluctant to pay more for a par-ticular brand (Chaudhuri and Holbrook 2001; Ismail and Spinelli 2000; Lau and Lee 1999; Zhang and Bloemer 2008). Meanwhile, be-havioral loyalty is defined as the degree of
the consumers’ intention to maintain continu-ance purchasing of a particular SME brand. Customers who are behaviorally loyal will have a higher tendency to maintain continu-ance purchasing for a particular brand (Chaudhuri and Holbrook 2001; Lau and Lee 1999; Zhang and Bloemer 2008). Therefore, SME owners/managers should emphasize the importance of both attitudinal and behavioral loyalty separately to achieve their business goals and to sustain their position in the mar-ketplace. Attitudinal loyalty should be em-phasized if the objective is to charge higher prices for a particular brand offering, while behavioral loyalty should be more important if the objective is to increase the market share or profits. (Chaudhuri and Holbrook 2001; Rauyr uen et al. 2009; Sethuraman and Gielens 2014). In other words, both dimen-sions of loyalty contribute differently toward a business’ revenues and profits.
SME brands usually suffer a higher risk of being driven out of the market when customers do not return to make repeat pur-chases. Aaker (1996) argued that brand loy-alty is a vital benchmark for a successful busi-ness marketing strategy. Despite that, there is a lack of studies on the context of SMEs’ brand loyalty (Berthon et al. 2008; Krake 2005). Furthermore, the deter minants of customer loyalty of the big brands are differ-ent from those for the SME brands (Rauyruen et al. 2009). Therefore it is important to ex-amine empirically the emotional and rational tr ust components of both attitudinal and behavioral loyalty to provide owners or man-agers of SME brands a deeper knowledge of their SMEs’ sustainability in the marketplace (Bettman 1973; Gordon et al. 1993).
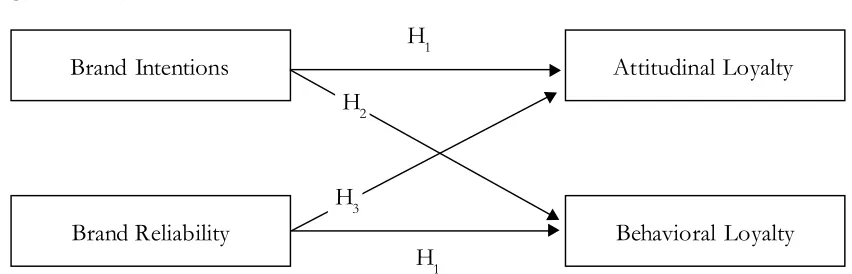
reliability on attitudinal and behavioral loy-alty. The following section discusses the re-lationships between the constructs of the proposed model (Figure 1) and the develop-ment of the hypotheses for this research.
Brand Trust
Trust in the context of a brand consists of two unique components, namely its inten-tions and reliability (Delgado et al. 2003). Following this, intentions are defined as the degree of a consumer’s belief that a particu-lar SME brand will act in good faith by pri-oritizing the consumer’s interests when a risky situation related to consumption happens (Delgado-Ballester et al. 2003). Meanwhile, reliability is defined as the degree of a consumer’s belief that a particular SME brand is reliable in fulfilling its value promise (Delgado-Ballester et al. 2003). In other words, the perception of a brand’s good in-tentions will help to earn the customer’s emo-tional trust, while the perception of a brand’s reliability will help to earn customers’ ratio-nal trust. Hence, this study will look into both components of trust separately, because trust is an important competitive tool for SMEs, which depend highly on their relationship marketing to ensure their survival in the mar-ketplace (Reijonen 2010). In addition, the small customer base of SMEs makes brand trust a vital contributor for continuance rev-enue streams, through the creation of cus-tomer loyalty (Chaudhuri and Holbrook 2001; Delgado-Ballester and Munuera-Aleman 2005; Eggers et al. 2013; Rauyruen et al. 2009). Many researchers have also shown that when customers trust a particular brand, they will tend to develop loyalty toward that brand (Forgas et al. 2010; Lee and Back 2010; Sahin et al. 2011; Zehir et al. 2011). Hence, trust is an important variable because loyalty is the outcome of trust, Lau and Lee (1999) argued
that loyalty develops when consumers trust a brand.
Despite the importance of brand trust on SMEs’ survival being acknowledged in the marketing literature, there are several gaps which remain. Firstly, past loyalty studies (e.g. Chaudhuri and Holbrook 2001; Delgado-Ballester and Munuera-Aleman 2005; Eggers et al. 2013; Rauyruen et al. 2009) have mainly been conducted from the perspective of trust as a composite construct. Only a few re-searchers (i.e. Delgado-Ballester and Munuera-Aleman 2005; Kantsperger and Kunz 2010) have studied the effects of both emotional and rational trust on loyalty. They argued that the distinct dimensions, namely the intentions and reliability of a brand, in-fluence loyalty differently. However, their studies are only applicable to the banking in-dustry and consumer products such as sham-poos and beer. Secondly, past research has reported inconsistencies in the findings. De-spite a few studies (e.g. Chaudhuri and Holbrook 2001; Matzler et al. 2008; Taylor et al. 2004) which have found a positive ef-fect of brand trust on both attitudinal and behavioral loyalty, there are studies (e.g. Forgas et al. 2010; Rauyruen et al. 2009; Zhang and Bloemer 2008) that fail to sup-port this positive effect of brand trust on both the dimensions of brand loyalty. This sparked our interest to investigate whether both the emotional and rational brand trust compo-nents, namely intentions and reliability, in-fluenced both dimensions of loyalty positively for the SME brands in the food service in-dustry. Following the argument above, the current study proposes that intentions and reliability will have a positive influence on SME brand loyalties.
H2: Customers’ trust in a brand’s intentions has a positive effect on behavioral loy-alty.
H3: Customers’ trust in a brand’s reliability has a positive effect on attitudinal loy-alty.
H4: Customers’ trust in a brand’s reliability has a positive effect on behavioral loy-alty.
Research Settings and Subjects
The survey was carried out solely by the researcher himself, with 210 diners who had dined in the particular local chain restaurants. The brands chosen for this study are two suc-cessful local SMEs casual dining restaurant chains, that have operated for more than 10 years in Malaysia, and have expanded their operations into the international market. Both these SME brands were selected from the list of companies held by SME Corp. Malaysia (SME Corp. 2014). Both these brands have received the SMEs’ Bestbrand awards in rec-ognition for their successful branding (The BrandLaureate 2014). Prior to the data col-lection, the outlet managers allowed the re-searcher to do the survey, but with the con-dition that their brand names were not ex-posed in any publication. The chosen brands were justified following other loyalty studies Figure 1. Proposed Model
Brand Intentions
Brand Reliability
Attitudinal Loyalty
Behavioral Loyalty
H1
H2
H3
H1
(e.g. Brakus et al. 2009; Lee et al. 2009; Lin 2010; Lin and Huang 2012; Mengxia 2007; Nam et al. 2011; Yoo and Donthu 2000) which had similarly chosen brands which were considered easily recognizable by the public, and had also been established for more than 10 years. The data collection were carried out in several locations within a five week pe-riod from early November to early Decem-ber in the Klang Valley, Malaysia
Council, Petaling Jaya City Council, Subang Jaya City Council, Shah Alam City Council, and Sepang Municipal Council. These ten districts were home to the majority of the population within the central region and are also known as greater Kuala Lumpur or the Klang Valley. The Klang Valley is the largest metropolitan area in Malaysia with approxi-mately 6 million people living there, and con-tributed RM263 billion to the Gross National Income (GNI) in 2010 (Economic Transfor-mation Program 2012; Department of Sta-tistics Malaysia 2011). Next each of the se-lected SME brands were found to be allocated equally and randomly among the ten districts. One restaurant branch was selected at ran-dom in each district, based on its business volume as reported by the outlet’s manager. This research used systematic sampling to select the respondents, in which the first of every five diners exiting the restaurant after paying their bill were approached. The ques-tionnaires were distributed on randomly se-lected weekdays and weekends during the lunch (12pm-3pm) and dinner time (6pm-9pm) periods.
The Partial Least Squares Str uctural Equation Modeling (PLS-SEM) data analy-sis technique commonly attains high levels of statistical power, with smaller sample sizes, compared to the Covariance Based Structural Equation Modeling (CB-SEM) (Henseler 2010; Reinartz et al. 2009). In ad-dition, Cohen (1988) suggests that the sample size for PLS-SEM is dependent on the statis-tical power to be achieved. According to Gefen, Rigdon, and Straub (2011), the mini-mum acceptable power in social sciences re-search is 80 percent. Following this, the mini-mum sample size is determined based on the power analysis using the G*Power program as recommended by Hair et al. (2012). The analysis of the G*Power program suggested
that a minimum sample of 68 observations would be required to achieve a significance level of 0.05 and a statistical power of 80 percent for hypotheses testing. Nevertheless, a large sample size is necessary for Structural Equation Modeling (SEM) due to its estima-tion procedure, and the estimaestima-tion for the model’s fit is based on the assumption of a large sample size (Hair et al. 2006). Kelloway (1998) suggests that the minimum sample size to conduct an SEM would be at least 200 observations. In addition, this minimum sample of at least 200 observations would be subject to complexities in the model (Kline 2011, p. 12). On the contrary, the PLS-SEM works well with a smaller sample size, even for a complex model, as compared to the CB-SEM which required at least 200 observa-tions to avoid non-convergence and improper solutions (Boomsma and Hoogland 2001, p. 8; Hairet al. 2014, p. 108). Given that the model in this study is not complex, the re-searcher increased the final sample size to 210 observations. In addition, the derivation of 210 observations as the final sample size was also due to the higher non-response rate as-sociated with the intercept survey method used in this study (Gates and Solomon 1982; p 46; Hornik and Ellis 1988, p. 539; Zikmund et al. 2009, p.213).
Measurement
were adapted from items developed by Chaudhuri and Holbrook (2001), Lau and Lee (1999), Zhang and Bloemer (2008). All the statements were measured with a six-point Likert scale (1=strongly disagree and 6=strongly agree). According to Garland (1991), the presence of a five-point Likert scale with a middle point of ‘3’ “neither agree nor disagree” would interfere with the find-ings of the study due to its social desirability bias. He further argued that respondents would answer based on the content of the questions when given an even number of re-sponses on the scale. Additionally, respon-dents from Asian countries tend to choose the middle category response, as opposed to respondents from Western countries (Mitchell 1999; Si and Cullen 1998). It was also found that both validity and reliability tended to be higher for an even number response scale, when compared to an odd number response scale (Birkett 1986; Coelho and Esteves 2007). Following this, the use of the six-point Likert scale in this study is justified. The ques-tionnaires were translated following methods suggested by Brislin (1970) to minimize any translation problems. The final questionnaires were bilingual, namely in English and Malay. In addition, Malhotra et al. (2002) suggested that a sample size of between 15 to 30 re-spondents would be required for a pilot test. Therefore, 30 questionnaires were distributed to diners at both the selected SME brands’ restaurants in Penang. According to the De-partment of Statistics Malaysia (2014), Penang recorded the second highest GDP per capita in Peninsular Malaysia. In other words, Penang was chosen because consumers there have high purchasing power. In addition, the service sector including foodservices is the largest contributor towards Penang’s economy (Penang Economic Indicators 2015). Consequently, 15 questionnaires were
allocated to each brand. The breakdown of the 15 respondents from each outlet was as follows: Ten of the respondents used the con-venience sample while 5 respondents used the systematic sample. Based on the pilot study feedback from the respondents, certain words were reconstructed to provide a better un-derstanding of the questions. The result sug-gested that all the Cronbach’s alpha values were greater than 0.90 which indicates that the measurements were reliable (Nunnally 1978).
Data Analysis Technique
Partial Least Squares (PLS) version 2.0 (Ringle, Wende, and Will 2005) was used as the technique to analyze the data for hypoth-eses testing in this study. Besides this, a bootstrapping method of 500 re-samples was carried out in order to determine the signifi-cance levels for the loadings and path coeffi-cients (Chin 1998).
Analysis
Profile of respondents
statistical power of 80 percent for the hypoth-eses testing had been obtained. The profiles of the respondents were analyzed according to gender, age, education, and occupation as summarized in Table 1. All the respondents were Malaysian.
From the total of 210 respondents, a total of 154 (73%) were female while 56 (27 percent) were male. This result is also con-sistent with other restaurant sur vey studies (Chang 2013; Kim et al. 2012; Lee et al.
2009). One plausible reason for the female dominant response is due to the higher likeli-hood of females answering surveys compared to men (Gannon et al. 1971; Green 1996). The age groups of 21-30 (36%) and 31-40 (38%) accounted for the biggest portion of the sample, meanwhile the age group of less than 21 years old (4%) was the smallest in the sample. Only 6 percent of respondents had a postgraduate degree. Most of the re-spondents were in work as employees (72%).
Table1. Respondent Profile
Demographic Characteristics Frequency %
Gender
Male 56 27
Female 154 73
Age
< 21 8 4
21-30 75 36
31-40 81 38
41-50 25 12
>50 21 10
Education
Primary school 5 2
Secondary school 36 17
College (Certificate/ Diploma/ Advanced Diploma) 71 34
Bachelor degree 85 41
Postgraduate degree 13 6
Occupation
Student 18 9
Employee 152 72
Self-employed 17 8
Non Response Bias
This study also tested the non-response bias using an extrapolation method as sug-gested by Armstrong and Overton (1977). This method assumes that respondents who answered in an unprepared condition are simi-lar to non-respondents. This unprepared con-dition refers to respondents answering later or answering after receiving more reminders (Ar mstrong and Overton 1977, p. 397). Moreover, they suggested the independent t-test with an assumption of equal and unequal group variances in order to test the mean score differences between early and late re-spondents. The data collection were
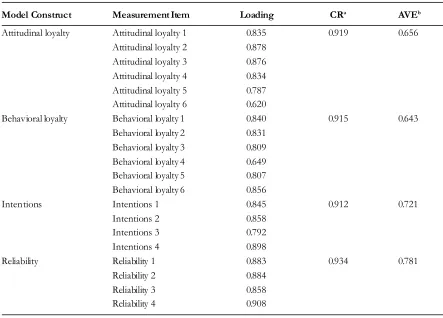
con-ducted over a period of five weeks from early November to early December 2014. Lindner et al. (2001) suggest that statistical powers will be reduced if unequal sizes of early and late respondent are used in comparison. They further recommend that a minimum of 30 late respondents are required for the compari-son. Therefore, the first 50 responses received were compared with the last 50 to test whether their mean scores differed. The re-sult showed that there was no difference be-tween both groups, because the mean for every variable in the study exceed the 0.05 significance level between both groups (Pallant 2010). Therefore, the issue of non-response bias did not occur in this study. Table 2. Result of Measurement Model
Model Construct Measurement Item Loading CRa AVEb
Attitudinal loyalty Attitudinal loyalty 1 0.835 0.919 0.656 Attitudinal loyalty 2 0.878
Attitudinal loyalty 3 0.876 Attitudinal loyalty 4 0.834 Attitudinal loyalty 5 0.787 Attitudinal loyalty 6 0.620
Behavioral loyalty Behavioral loyalty 1 0.840 0.915 0.643 Behavioral loyalty 2 0.831
Behavioral loyalty 3 0.809 Behavioral loyalty 4 0.649 Behavioral loyalty 5 0.807 Behavioral loyalty 6 0.856
Intentions Intentions 1 0.845 0.912 0.721
Intentions 2 0.858
Intentions 3 0.792
Intentions 4 0.898
Reliability Reliability 1 0.883 0.934 0.781
Reliability 2 0.884 Reliability 3 0.858 Reliability 4 0.908
Note: aComposite Reliability (CR) = (square of the summation of the factor loadings)/{(square of the summation of
the factor loadings) + (square of the summation of the error variances)}; bAverage Variance Extracted (AVE) =
This study used the two-step approach as recommended by Anderson and Gerbing (1988). Firstly, convergent validity and reli-ability were evaluated as shown in Table 2. In order to achieve convergent validity, load-ings must be greater than 0.5 (Bagozzi and Yi 1991), composite reliability must be greater than 0.7 (Gefen et al. 2000), and the Average Variance Extracted (AVE) must be greater than 0.5 (Fornell and Lacker 1981). As shown in Table 1, the measures achieve sufficient convergent validity and reliability because they achieve the criterion stated above.
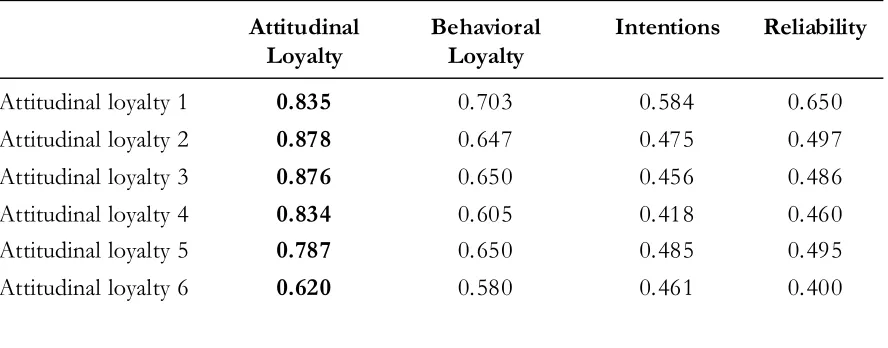
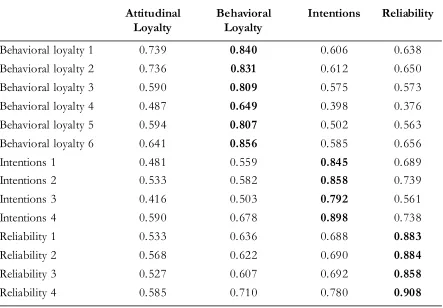
Next, the discriminant validity is evalu-ated as shown in Table 3. In order to achieve this discriminant validity, the average
vari-ance shared between each construct and its measures should be greater than the variance shared between the construct and the other constr ucts (Fornell and Lacker 1981). The measures achieve sufficient discriminant va-lidity because the correlation values for each construct (including row and column) is lower than the square root of the AVE by the indi-cators measuring that construct, which is dis-played on the diagonal. Hair et al. (2014, p. 105) suggest that the loadings of measure-ment items should be higher than the cross loadings to achieve sufficient discriminant validity for PLS-SEM analysis. As shown in Table 4, the loadings of all constructs satisfy this criterion. Thus, the discriminant validity is achieved.
Table 3. Discriminant Validity of Constructs
Constructs Attitudinal Loyalty Behavioral Loyalty Intentions Reliability
Attitudinal loyalty 0.810
Behavioral loyalty 0.795 0.802
Intentions 0.601 0.689 0.849
Reliability 0.627 0.730 0.808 0.884
Note: Value on the diagonals represents square root of the AVE while the other entries represent the correlations value.
Table 4. Cross loadings of Constructs
Attitudinal Behavioral Intentions Reliability
Loyalty Loyalty
Attitudinal loyalty 1 0.835 0.703 0.584 0.650
Attitudinal loyalty 2 0.878 0.647 0.475 0.497
Attitudinal loyalty 3 0.876 0.650 0.456 0.486
Attitudinal loyalty 4 0.834 0.605 0.418 0.460
Attitudinal loyalty 5 0.787 0.650 0.485 0.495
Table 5. Path Coefficients and Hypothesis Testing
Hypothesis Relationship Std Beta Std Error t-value Supported
H1 Brand Intentions attitudinal loyalty 0.271 0.101 2.670** Yes H2 Brand Intentions behavioral loyalty 0.287 0.067 4.297** Yes H3 Brand Reliability attitudinal loyalty 0.408 0.088 4.655** Yes H4 Brand Reliability behavioral loyalty 0.499 0.070 7.105** Yes
Note: *p < 0.05 (1.645); **p < 0.01 (2.33) one tail Table 4. Continued
Attitudinal Behavioral Intentions Reliability
Loyalty Loyalty
Behavioral loyalty 1 0.739 0.840 0.606 0.638
Behavioral loyalty 2 0.736 0.831 0.612 0.650
Behavioral loyalty 3 0.590 0.809 0.575 0.573
Behavioral loyalty 4 0.487 0.649 0.398 0.376
Behavioral loyalty 5 0.594 0.807 0.502 0.563
Behavioral loyalty 6 0.641 0.856 0.585 0.656
Intentions 1 0.481 0.559 0.845 0.689
Intentions 2 0.533 0.582 0.858 0.739
Intentions 3 0.416 0.503 0.792 0.561
Intentions 4 0.590 0.678 0.898 0.738
Reliability 1 0.533 0.636 0.688 0.883
Reliability 2 0.568 0.622 0.690 0.884
Reliability 3 0.527 0.607 0.692 0.858
Structural Model
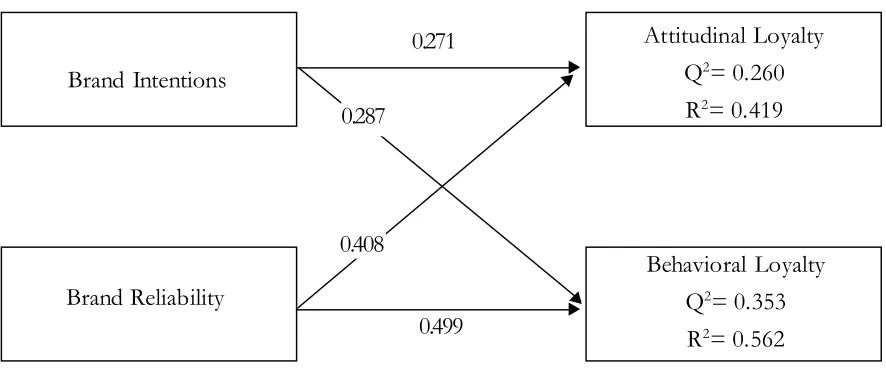
The results of the structural model for this study are shown in Table 5 and Figure 2.
Firstly, intentions ( = 0.271, p < 0.01) are found to exert a positive influence on attitu-dinal loyalty. Therefore, H1 is supported. Sec-ondly, the result also showed that intentions ( = 0.287, p < 0.01) positively influenced behavioral loyalty. Therefore, H2 is sup-ported. Next, reliability ( = 0.408, p < 0.01) is a significant predictor of attitudinal loy-alty. Hence, H3 is accepted. Lastly, the result shows that reliability ( = 0.499, p < 0.01) is a significant predictor of behavioral loyalty. Thus, H4 is accepted.
Figure 2 exhibited both Q2 values and R2 values for the respective endogenous vari-ables. The R2 values are 0.419 and 0.562 re-spectively which suggest that the modeled variables can explain 41.9 percent on attitu-dinal loyalty and 56.2 percent on behavioral loyalty. Table 5 shows all the hypotheses were fully supported. In addition, the Q2 values for attitudinal loyalty (Q2 = 0.260) and behav-ioral loyalty (Q2 = 0.353) are both greater than value of zero suggesting that the model has predictive relevance (Fornell and Cha 1994).
Discussions
The aim of this study was to test whether intentions and reliability exert a di-rect and positive influence on both attitudi-nal and behavioral loyalty. The result of this study found that both brand intentions and brand reliability have a direct positive rela-tionship on both attitudinal and behavioral loyalty. This empirical evidence supports the findings in the literature from different re-search contexts, that brand intentions and brand reliability have positive effects on brand loyalty (Delgado-Ballester and Munuera-Aleman 2005; Kantsperger and Kunz 2010). If a brand is reliable, but has bad intentions, such as ignoring customers’ welfare by earning profits, customers will dis-trust that brand when they find out. On the other hand, customers will similarly distrust a brand even if the brand has good intentions but is unreliable, such as never fulfilling their promises towards their customers. Hence, both intentions and reliability are important factors for SMEs’ brands to enhance their profits through the repurchasing loyalty of their customers. Besides that, reliability seems to have a stronger influence on both
attitudi-Brand Intentions
Brand Reliability
Attitudinal Loyalty Q2= 0.260 R2= 0.419
Behavioral Loyalty Q2= 0.353 R2= 0.562
0.271
0.287
0.408
0.499
nal and behavioral loyalty as compared to intentions in the foodservice context. This explains that successful Malaysian SME brands tend to retain their customers by earn-ing their trust rationally (i.e. consistently serv-ing the meals exactly as they are shown in their promotional promises to their custom-ers, with marketing gimmicks). In addition, to the best of our knowledge, this is a new empirical discovery for the brand intentions, brand reliability, attitudinal loyalty, and be-havioral loyalty relationships from the per-spective of the SMEs’ brands. Given that the current literature has only examined such notions from the perspective of certain glo-bal brands, this study believes that it is also crucial to examine such relationships from the perspective of the SMEs’ brands. Such find-ings will provide insights, for the managers or owners of SMEs in the foodservice indus-try, into the contributions of both emotional and rational trust, namely for brand intentions and brand sustainability for the SMEs’ brands in earning their customers’ loyalty from both attitudinal and behavioral perspectives.
Implications
From a theoretical view, the findings contribute to the literature by providing em-pirical evidence of the relationships between brand intentions, brand reliability, attitudinal loyalty, and behavioral loyalty. The literature had urged that more studies to examine emo-tional trust be done, given that it has received little attention in the past (Das et al. 2014). Our best understanding is that there is not yet a study examining the influence of both the emotional and rational trusts separately, on both attitudinal and behavioral loyalty. The empirical findings suggest that both emo-tional and raemo-tional trust does positively in-fluence customers’ attitudinal and behavioral
respondents in the selected SME restaurant brands where this sur vey took place (Zikmund 1994, p. 98).
Limitation and Future
Research
Although the current study provides interesting findings into the influence of in-tentions and reliability on both attitudinal and behavioral loyalty, it has several limitations.
Firstly, the results of this study are obtained from data from only two successful Malay-sian SME brands in the casual dining indus-try. Therefore, the results should be general-ized with a caveat, because the findings could be different if the data were collected from other successful SME brands from different industries such as Flipper and Coveithci, in the footwear industry (The BrandLaureate 2014). This study strongly urges more re-search to be undertaken into other SMEs’ brands to further validate our findings. More-over, the literature has indicated there is a
dearth of branding studies in the context of SME brands in comparison to the global/big brands (Agostini et al. 2014; Asamoah 2014; Reijonen et al. 2012; Spence and Essousi 2010). Secondly, the systematic sampling method resulted in a skewed dominant female response over male respondents. Perhaps a quota sampling of equal numbers of male and female respondents might provide a differ-ent outcome for the model tested in this study.
Thirdly, this study intercepted the first of ev-ery five people who left the restaurant, to use as their respondents, because the outlet man-agers prohibited the survey from being con-ducted inside their outlets. This method re-sulted in a higher non-response rate. Future studies may try to conduct the drop and col-lect method to gain more responses in order to further validate the findings. In addition, it would be interesting to enhance the cur-rent model with the inclusion of other ante-cedents, such as a brand’s reputation, image, and effect, to study their relationships on both the attitudinal and behavioral loyalty.
References
Aaker, D. A. 1991. Managing Brand Equity: Capitalizing on the Value of a Brand Name. New York: The Free Press.
Aaker, D. A. 1996. Measuring brand equity across products and markets. California Management Review, 38(3): 102-120.
Abimbola, T. 2001. Branding as a competitive strategy for demand management in SMEs. Journal of Research in Marketing and Entrepreneurship 3 (2): 97-106.
Ahonen, M. 2008. Branding - does it even exist among SMEs? Proceedings of the 16th Nordic Conference on Small Business Research (May 21st-23rd 2008), Tallinn, Estonia.
Agostini, L., R. Filippini, and A. Nosella. 2014. Corporate and product brands: Do they improve SMEs’ performance? Measuring Business Excellence 18 (1): 78-91.
Anderson, J. C., and D. W. Gerbing. 1988. Structural equation modeling in practice: A review and recom-mended two-step approach. Psychological Bulletin 103 (3): 411-423.
Assael, H. 1998. Consumer Behavior and Marketing Action. Cincinnati, OH: South-Western. Bagozzi, R. P. 1975. Marketing as exchange. Journal of Marketing 39: 32-39.
Bagozzi, R. P. and Y. Yi. 1991. Multitrait-multimethod matrices in consumer research. Journal of Consumer Research 17 (4): 426-439.
Baldinger, A. L., E. Blair, and R. Echambadi. 2002. Why brands grow. Journal of Advertising Research 42: 7-14.
Berthon, P., M. T. Ewing, and J. Napoli. 2008. Brand management in small and medium-sized enterprises.
Journal of Small Business Management 46 (1): 27-45.
Bettman, J. R. 1973. Perceived risk and its components: A model and empirical test. Journal of Marketing,
10 (2): 184-190.
Brakus, J. J., B. H. Schmitt, and Zarantonello. 2009. Brand experience: What is it? How is it measured? Does it affect loyalty? Journal of Marketing 73: 52-68.
Bush, A. J., and J. F. Hair. 1985. An assessment of the mall intercept as a data collection method. Journal of Marketing Research 22 (2): 158-167.
Caloghirou, Y., A. Protogerou, Y. Spanos, and L. Papagiannakis. 2004. Industry versus firm specific effects on perfor mance: Contrasting SMEs and large sized firms. European Management Journal 22 (2): 231-243.
Centeno, E., S. Hart, and K. Dinnie. 2013. The five phases of SME-brand building. Journal of Brand Management 20 (6): 445-457.
Chaudhuri, A., and M. B. Holbrook. 2001. The chain of effect from brand trust and brand affect to brand performance: The role of brand loyalty. Journal of Marketing 65: 81-93.
Chin, W. W. 1998. Issues and opinion on structural equation modeling. MIS Quarterly 22 (1): 5-16. Day, G. S. 1969. A two-dimensional concept of brand loyalty. Journal of Advertising Research 9 (3): 29-35. Delgado-Ballester, E., J. L. Munuera-Aleman, and M. Yague-Guillen. 2003. Development and validation
of a brand trust scale. International Journal of Market Research 45 (1): 35-53.
Delgado-Ballester, E., and J. L. Munuera-Aleman. 2005. Does brand trust matter to brand equity? Journal of Product and Brand Management 14 (3): 187-196.
Department of Statistics Malaysia. 2012. Press Release: Media Conference Census Report on SMEs 2011. Re-trieved from http://www.statistics.gov.my
Department of Statistics Malaysia. 2014. National Accounts: GDP by state 2005-2013. Retrieved from http:/ /ww w.statistics.gov.my
Eggers, F., M. O’Dwyer, S. Kraus, C. Vallaster, and S. Guldenberg. 2013. The impact of brand authentic-ity on brand trust and SME growth: A CEO perspective. Journal of World Business 48: 340-348. Forgas, S., M. A. Moliner, J. Sanchez, and R. Palau. 2010. Antecedents of airline passenger loyalty:
Low-cost versus traditional airlines. Journal of Air Transport Management 16: 229-233.
Fornell, C., and J. Cha. 1994. Partial Least Squares. In R. P. Bagozzi (Ed.), Advanced Methods of Marketing Research: 52-78. Cambridge, MA: Blackwell Business.
Fornell, C. and D. F. Lacker. 1981. Evaluation structural equation models with unobserved variables and measurement error. Journal of Marketing Research 18 (1): 39-50.
58: 1-19.
Garbarino, E., and M. Johnson. 1999. The different roles of satisfaction, trust, and commitment in customer relationships. Journal of Marketing 63 (2): 70-87.
Gefen, D., D. W. Straub, and M-C. Boudreau. 2000. Structural equation modeling and regression: Guide-lines for research practice. Communications of the Association for Information Systems 4: 1-79.
Gordon, G. L., R. J. Calantone, and C. A. Di Benedetto. 1993. Brand equity in the business-to-business sector. Journal of Product and Brand Management 2 (3): 4-16.
Grayson, K., D. Johnson, D-F. R. Chen. 2008. Is firm trust essential in a trusted environment? How trust in the business context influences customers. Journal of Marketing Research 45: 241-256.
Gundala, R. R., and H. Khawaja. 2014. Brand management in small and medium enterprise: Evidence from Dubai, UAE. Global Journal of Business Research 8 (1): 27-38.
Gurviez, P., and M. Korchia. 2003. Test of a consumer-brand relationship model including trust and three consequences. 30th International Research Seminar in Marketing: 1-20.
Hair, J. F. Jr., G. T. M. Hult, C. M. Ringle, and M. Sarstedt. 2014. A Primer on Partial Least Squares Structural Equation Modeling (PLS-SEM). United States of America: SAGE Publications, Inc.
Ismail, A. R., and G. Spinelli. 2012. Effects of brand love, personality, and image on word of mouth: The case of fashion brands among young consumers. Journal of Fashion Marketing and Management 16 (4): 386-398.
Jacoby, J., and D. B. Kyner. 1973. Brand loyalty versus repeat purchasing behavior. Journal of Marketing Research 10 (1): 1-9.
Kantsperger, R., and W. H. Kunz. 2010. Consumer trust in service companies: A multiple mediating analysis. Managing Service Quality 20 (1): 4-25.
Keller, K. L. 2000. The brand report card. Harvard Business Review 78 (1): 147-156.
Krake, F. B. G. J. M. 2005. Successful brand management in SMEs: A new theory and practical hints.
Journal of Product and Brand Management 14 (4): 228-238.
Kuikka, A., and T. Laukkanen. 2012. Brand loyalty and the role of hedonic value. Journal of Product and Brand Management 21 (7): 529-537.
Lam, R., S. Burton, and H. Lo. 2009. Customer tradeoffs between key determinants of SME banking loyalty. International Journal of Bank Marketing 27 (6): 428-445.
Larzelere, R. E., and T. L. Huston. 1980. The dyadic trust scale: Toward understanding interpersonal trust in close relationship. Journal of Marriage and Family 42 (3): 595-604.
Lau, G. T., and H. Lee. 1999. Consumers’ trust in a band and the link to brand loyalty. Journal of Market Focused Management 4 (4): 341-370.
Lee, J., and K. Back. 2010. Examining antecedents and consequences of brand personality in the upper-upscale business hotel segment. Journal of Travel and Tourism Marketing 27: 132-145.
Lee, Y-K., K. J. Back, and J-Y. Kim. 2009. Family restaurant brand personality and its impact on customer’s emotion, satisfaction, and brand loyalty. Journal of Hospitality and Tourism Research 33 (3): 305-328. Lin, L. 2010. The relationship of consumer personality trait, brand personality and brand loyalty: An
Lin, Y., and P. Huang. 2012. Effects of big five brand personality dimensions on repurchase intentions: Using branded coffee chain as examples. Journal of Foodservice Business Research 15: 1-8.
Matzler, K., S. Grabner-Krauter, and S. Bidmon. 2008. Risk aversion and brand loyalty: The mediating role of brand trust and brand affect. Journal of Product and Brand Management 17 (3): 154-162. Mengxia, Z. 2007. Impact of brand personality on PALI: A comparative research between two different
brands. International Management Review 3 (3): 36-44.
Merrilees, B., S. Rundle-Thiele, and A. Lye. 2011. Marketing capabilities: Antecedents and implications for B2B SME performance. Industrial Marketing Management 40: 368-375.
Mitchell, R., K. Hutchinson, and S. Bishop. 2012. Interpretation of the retail brand: An SME perspective.
International Journal of Retail and Distribution Management 40 (2): 157-175.
Moorman, C., R. Deshpande, and G. Zaltman. 1993. Factors affecting trust in market research relation-ships. Journal of Marketing 57 (1): 81-101.
Morgan, R. M., and S. Hunt. 1994. The commitment-trust theory of relationship marketing. Journal of Marketing 58 (3): 20-38.
Nam, J., Y. Ekinci, and G. Whyatt. 2011. Brand equity, brand loyalty and consumer satisfaction. Annals of Tourism Research 38 (3): 1009-1030.
Oliver, R. L. 1999. Whence consumer loyalty? Journal of Marketing 63: 33-44.
Opoku, R. A., R. Abratt, M. Bendixen, and L. Pitt. 2007. Communicating brand personality: Are the websites doing the talking for food SMEs? Qualitative Market Research: An International Journal 10 (4): 362-374.
Parijat, U., J. Saeed, and K. D. Pranab. 2011. Factors influencing ERP implementation in Indian manufac-turing organizations: A study of micro, small, and medium scaled enterprises. Journal of Enterprise Information Management 24 (2): 130-145.
Penang Economic Indicators. 2015. Penang Economic Indicators: An Extract from Penang Monthly Issue 4(April 2015). Retrieved from http://w ww.investpenang.gov.my/
Rauyruen, P., K. E. Miller, and M. Groth. 2009. B2B services: Linking service loyalty and brand equity.
Journal of Service Marketing 23 (3): 175-186.
Reijonen, H. 2010. Do all SMEs practice the same kind of marketing? Journal of Small Business and Enter-prise Development 17 (2): 279-293.
Reijonen, H., T. Laukkanen, R. Komppula, and S. Tuominen. 2012. Are growing SMEs more market-oriented and brand-market-oriented? Journal of Small Business Management 50 (4): 699-716.
Ringle, C. M., S. Wende, and A. Will. 2005. SmartPLS 2.0 (beta)’. Hamburg, available at: www.smartpls.de Sahin, A., C. Zehir, and H. Kitapci. 2011. The effects of brand experiences, trust, and satisfaction on building brand loyalty: An empirical research on global brands. Procedia Social and Behavioral Sciences
24: 1288-1301.
Sethuraman, R., and K. Gielens. 2014. Determinants of store brand share. Journal of Retailing 90 (2): 141-153.
Shashank, S., N. Siddhartha, and C. M. Subhas. 2014. Identifying success factors for implementations of ERP at Indian SMEs: A comparative study with Indian large organizations and the global trend.
Sirdeshmukh, D., J. Singh, and B. Sabol. 2002. Consumer trust, value, and loyalty in relational exchanges.
Journal of Marketing 66 (1): 15-37.
SME CORP. 2012. SME Annual Report 2011/12: Redefining the Future. Retrieved from http:// ww w.smecorp.gov.my
Spence, M., and L. H. Essoussi. 2010. SME brand building and management: An exploratory study.
European Journal of Marketing 44 (7/8): 1037-1054.
Taylor, S. A., K. Celuch, and S. Goodwin. 2004. The importance of brand equity to customer loyalty.
Journal of Product and Brand Management 13 (4): 217-227.
The BrandLaureate. 2014. The BrandLaureate: SMEs Bestbrands Awards. Retrieved from http:// ww w.thebrandlaureate.com.
Tucker, W. T. 1964. The development of brand loyalty. Journal of Marketing Research 1 (3): 32-35. Vlahvei, A., O. Notta, and E. Grigoriou. 2013. Establishing a strong brand identity through a website:
The case of Greek food SMEs. Procedia Economics and Finance 5: 771-778.
Yoo, B., N. Donthu, and S. Lee. 2000. An examination of selected marketing mix elements and brand equity. Journal of the Academy of Marketing Science 28 (2): 195-211.
Zehir, C., A. Sahin, H. Kitapci, and M. Ozsahin. 2011. The effects of brand communication and service quality in building brand loyalty through brand trust: The empirical research on global brands.
Procedia Social and Behavioral Sciences 24: 1218-1231.
Zhang, J., and J. M. M. Bloemer. 2008. The impact of value congruence on consumer-service brand relationships. Journal of Service Research 11 (2): 161-178.