IJG Vol. 46, No.1, June 2014 (62 - 68) © 2014 Faculty of Geography UGM and he Indonesian Geographers Association
Urban Risk Assessment of Lahar Flows in Merapi Volcano
(Study Case: Muntilan Urban Area, Central Java)
Cosmas Bambang Sukatja, Sudibyakto, RPGA Voskuil
Received: 22 12 2013 / Accepted:18 03 2014/ Published online: 30 06 2014 © 2014 Faculty of Geography UGM and he Indonesian Geographers Association
Abstract he objective of the research was to analyse probability of lahar lows occurrence in Muntilan urban area, Central Java. By using integrated methods, which involve the numerical simulation program, Geographic Information System (GIS), Remote Sensing (RS) and ield veriication to produce lahar lows Hazard Map and Risk Map. Muntilan urban area located at western lank of Merapi volcano, and in down stream of Lamat river. he river is Lahar River that is endangering from Merapi volcano, which lowing down to cuts a cross of that area. herefore, Muntilan urban area is vulnerable area from lahar lows disaster. Lahar lows, generally occur during intense rainfall on saturated volcanic deposit in upper stream of river or wall of volcano. Lahar lows are extremely dangerous especially to those living in valley areas near a volcano, which can undercut banks and cause houses destruction situated on the banks, and can bury and destroy resident, structures, infrastructure facilities including roads and bridges. Meanwhile, development of Muntilan urban area that caused many illegal settlements appears surrounding that area. Occasionally, un-beneit people constructing house in disaster prone area, such as down stream of river side that have lahar lows risk. he research was concluded that lahar low occurrence in 100 years return period will be buried the Muntilan urban area. With the meth-ods integrating of GIS, RS, ield veriication can be done analysing of lahar lows hazard map, and risks map to produce risk assessment in Muntilan urban area.
Abstrak Tujuan dari penelitian ini adalah untuk menganalisis kemungkinan terjadinya aliran lahar di perkotaan Muntilan
, Jawa Tengah. Metode penelitian ini merupakan metode terpadu dengan melibatkan program simulasi numerik, Sistem In-formasi Geograis (SIG), Penginderaan Jauh (PJ) dan veriikasi lapangan untuk menghasilkan Peta Bahaya dan Peta Risiko aliran lahar. Daerah perkotaan Muntilan terletak di sisi barat Gunung Merapi hingga bagian hilir sungai Lamat. Sungai tersebut adalah sungai dengan ancaman banjir lahar dari Gunung Merapi, yang mengalir ke persilangan dari daerah terse-but. Oleh karena itu, daerah perkotaan Muntilan adalah daerah rentan dari bencana banjir lahar. Aliran lahar umumnya terjadi saat curah hujan yang intens pada endapan vulkanik jenuh di hulu sungai atau sisi gunungapi. Aliran lahar sangat berbahaya terutama bagi mereka yang tinggal di daerah lembah dekat gunungapi, yang dapat menghancurkan rumah sepanjang sisi sungai dan dapat mengubur penduduk, struktur bangunan, dan fasilitas infrastruktur termasuk jalan dan jembatan. Sementara itu, pengembangan daerah perkotaan Muntilan menyebabkan banyak pemukiman ilegal muncul di sekitar daerah tersebut. Terkadang, penduduk membangun rumah di daerah rawan bencana, seperti sisi hilir sungai yang memiliki risiko tinggi terhadap banjir lahar. Penelitian ini menyimpulkan bahwa terjadinya aliran lahar dalam kala ulang 100 tahun akan mengubur sebagian daerah perkotaan Muntilan. Dengan metode mengintegrasikan SIG, PJ, dan veriikasi lapangan analisis dari peta bahaya dan peta risiko banjir lahar dapat dilakukan untuk menghasilkan penilaian risiko di daerah perkotaan Muntilan.
Keywords: lahar lows, urban area, risk assessment.
Kata kunci: Sistem evaluasi lahan otomatis, survey tanah, kualitas lahan, karakteristik lahan, interpretasi citra.
Lahar is an Indonesian word describing mudlows and debris lows that originate from the slopes of a vol-cano [Lavigne, 2000]. Both types of lows contain a high concentration of rock debris to give them the internal strength necessary to transport high boulders as well as buildings and bridges and to exert extremely high impact forces against objects in their paths. he size of lahars materials is variety, from several centimeters
C.B. Sukatja Balai Sabo Yogyakarta Email: [email protected]
Sudibyakto
Faculty of Geography Universitas Gadjah Mada, Yogyakarta
RPGA Voskuil
Faculty of Geo-information Science and Earth Observation, University of Twente, the Netherlands
of diameters, lowing less than one meter per second. On the steep slope, particularly unvegetated slopes are oten good sites to observe such small lows during a heavy rain. At the other extreme, they can be a few hun-dred meters wide, tens of meters deep, low at several tens of meters per second, and travel over 100 kilome-ters from a volcano [Power, 1985, Yamasita, 2006].
Muntilan urban area is one of district in Magelang regency, which located in the lahar lows disaster prone area of Merapi volcano. Related to a new Indonesian government’s policy declaring the Local Government has autonomy in economical matters, the Muntilan dis-trict will imply to explore the local natural resources to improve a local economic income.
Considering ever increasing population growth in Muntilan urban area, the expansions of the settlements,
Indonesian Journal of Geography, Vol. 46 No.1, June 2014 : 62 - 68
many people in and around the area are now forced to build their houses in prone lahars low areas. Most of-ten, the construction of buildings is taking place with very little or without any regard to lahars low. he last lahars low occurs in that area in 1932, so many in-habitants was not familiar with the lahars low disas-ter, especially their new generation and new residents. Also, according to the interval eruption and direction of pyroclastic lows is not indubitable, therefore the settlements and socio-economic activities around the western slope of the volcano, have became potentially endangered. Hence, countermeasures to prevent or mitigate the negative efects resulting from lahar lows should be taken.
In order to minimize the impacts and at to opti-mize land utilization in around Muntilan urban area, the better planning and mitigation measures against la-hars lows are absolutely required. his requires a com-prehensive risk assessment in the area.
he results of the research should highlight the present condition of lahars low prone areas and it’s surround-ing. hese results should at least be able to predict the future conditions of such places. In this way, sustainable development of the area would be improved. On this basic, a framework for risk assessment due to the lahars low problems may be worked out.
One of the most important tools for the design and formulation of policies and strategies for the reduction of the risk of the population is the production of Zone Risk maps that can be used by the urban development planers and local authorities.
Risk assessment of lahars low impact should be part of the activities to diminish the impacts of lahars low occurrence. he aim of this study is to present the way in which computer tools, such as a Geographic In-formation System (GIS), combined with remote sensing technique, contributes to the analysis and representa-tion of the informarepresenta-tion required for risk assessment of lahar lows.[Barrough, 1989, Van westen, et.al, 2005]
he implementation and efort for supporting the research objective must be known cause of lahar lows occurrence. he lahar lows will happen with presence of three natural elements, as volcanic deposits, slope of channel and rainfall intensity which triggering the lahar lows occurrence. he location of volcanic de-posit will decide of direction of lahar lows occurrence. When the area threatened of lahar low disaster can be predicted and the elements at risk area is knowing, then risk assessment can be calculated. A GIS can con-tribute to solve the data integration problems through their wide capabilities to input analyses and manage the multi-sources data involved in the risk assessment of lahar lows impact processes. he adoption of both techniques, to estimate risk assessment of lahar lows impact, provides a new powerful approach to analyses and represents it, even when the amount of data avail-able for evaluation is scarce. he introduction of a set of computer tools in risk assessment of lahar lows impact
processes have set the need to adapt risk assessment of lahar lows impact methodologies to a new operat-ing environment. his will be achieved by designoperat-ing a computational method, where the parameters and pro-cedures required to estimate potential volcanic risk are clearly identiied for each of volcanic phenomena.
he main objective of the research work is to pro-duce risk map of lahar lows in Muntilan urban area using integrated methods, which involve the use of Re-mote Sensing, Geographical Information Systems and ield veriication.
he speciic objectives of the research are the fol-lowing: (1) identify the distribution of pyroclastic de-posits in surrounding of Merapi slopes area, especially in Muntilan urban area (based on temporal remote sensing data, volcanology Survey Indonesia), (2) iden-tify distribution of lahar lows deposits material in alongside of Lamat river, based on JICA reports 1980. Report of Review Master Plan of Mt. Merapi, 2001 and ield interviews, (3) analyze the morphology of channel data to get the probability of lahars over low in the study area, (4) construct the lahar lows hazard map, and (5) use amount of elements risk in Muntilan urban area to assess of lahar lows risk in study area, such as people, sources, properly, environment, livelihood.
2. Research Methodology
his research was conducted in Muntilan urban area, Central Java. Due to the nature of this research, the methodology adopted for the entire work was sys-tematically divided into 4 (four) phases. he data col-lected during these phases was used to prepare the inal hazard and risk maps. he four phases were as follows: (1) data Preparation: Study literature, collecting sec-ondary data, (2) pre-ield work: GIS Work using digital orthophoto to get of DEM, slope, aspect maps, (3) ield work: Data collection about volcano eruption, pyroclas-tic lows relevant data, channel capcity and Interview people about lahar lows events, and (4) post-ield work. For estimation the vulnerability of lahar lows with JSAS Numerical Simulation sotware. And using the result of that simulation and integrated methods to cre-ate the Hazard and Risk of lahar lows Map, with Arc view sotware. Identiication and inventory of elements at risk conduct by digitizing the land use type directly from aerial photograph. he quantitative estimation of risk may be determined by using the following formula [ITC Hodule, 2004]:
Risk analysis can be described as follow:
1. Lahar lows Hazard (H) is probability (potential hazard) of the event with a certain magnitude. 2. he vulnerability of the elements at risk (V)
(build-ing stock, life lines, critical facilities, population, economic activities) exposed to the event with a certain magnitude
3.Result and Discusion
Vulnerability of Lahar lows in Muntilan urban area can be estimated with JSAS Numerical Simulation sot ware. In order to processing the input data to the sot ware, must be done the un-generate works by using ArcInfo sotware. Un-generate works to converts con-tour vector data of digital ortho photo to the grid data (X,Y and Z). Besides the grid data necessary to input several parameters such as inlow point & hydrograph of lahar lows.
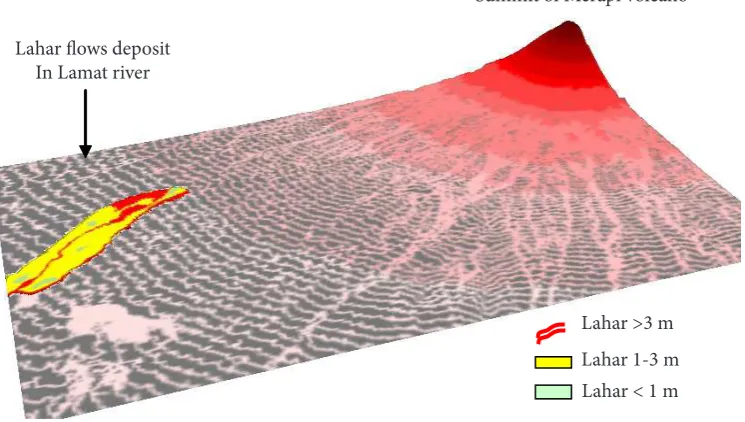
At last, by using JSAS Simulation sotware would be present of lahar lows distribution and depth in Munti-lan urban area, as presented on Figure 1.
A simulation of the hazard lahar lows as the most hazardous event at Merapi volcano has been construct-ed by the numerical simulation. Considering a deviat-ing propagation of lowdeviat-ing mechanism of lahar lows in the Muntilan urban area, this map was created with lahar lows hazard scenarios mechanism for 100 year return period.
According the result of JSAS Numerical Simula-tion the sediments of lahar lows will covered in down stream of Lamat River. he sediments buried in that area on elevation 487 m (Ngrajeg sub-village, Ngadipu-ro village, + 485 m) until 312 m (Gunung Pring village, + 313 m). he dimension of sediment deposit around 15 km2, with length : 5.8 km and wide : 2.59 km.
he elements at risk data provide information re-quired to characterise the value of population, proper-ties, economic activiproper-ties, including public services in the given area. he data layer, which is implemented to calculate an impact level in Muntilan urban area is
buried by lahar lows, it is focused on population, infra-structures (settlements, schools, health centres, bridge and road network and natural land (irrigated and non-irrigated agriculture, commercial plantation, forest, and bareland). his ield area is administratively covered within Muntilan, Gunung Pring and Villages in Mun-tilan District and Ketunggeng, Ngadipuro, Banyubiru Villages in Dukun District, Magelang Regency, Central Java Province.
In connection with the focus of this paper, it is lim-ited only risk assessment in Muntilan urban area, then the next calculation of lahar lows impact in element at risk area is only administratively covered within Mun-tilan District, such as MunMun-tilan and Gunung Pring vil-lages.
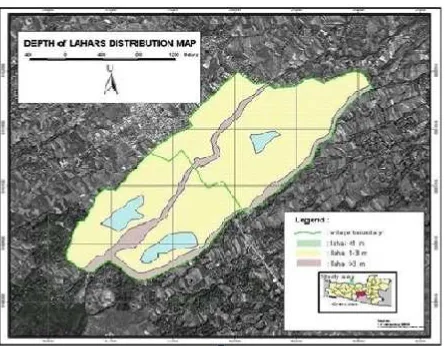
Lahar hazard area is threatened area from the lahar lows occurrence, usually that area be related in a cer-tain way buried with lahar material. Lahar Hazard map in the Muntilan urban area presented in 3 classiications be based on depth of lahar lows material which buried at ield area, see Table 1.
he phenomena of lahar lows afected in the down stream and three dimensions modeling of lahar distri-bution in down stream of Lamat river can be presented in Figure 2.
Hazard map of lahar lows in Muntilan urban area presented in Figure 3, is constitute of threatened area from the lahar lows occurrence. According the result of JSAS Numerical Simulation, the distribution of lahar lows materials in Muntilan urban area is not same of depth. Diversiication of lahars material are depends of contour and condition of river channel.
Lahar lows deposit In Lamat river
Summit of Merapi volcano
Lahar >3 m
Lahar 1-3 m Lahar < 1 m
Indonesian Journal of Geography, Vol. 46 No.1, June 2014 : 62 - 68
Figure 2. Phenomena area afected of Lahar lows in down Stream of Lamat River
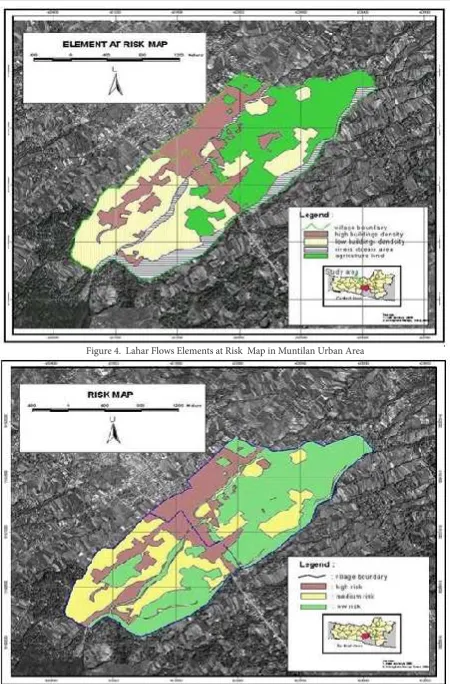
Figure 4. Lahar Flows Elements at Risk Map in Muntilan Urban Area
Indonesian Journal of Geography, Vol. 46 No.1, June 2014 : 62 - 68
Table 1. Classiication of lahar depth
No Depth of Lahar Material Colour of Classiication
1 Lahar material > 3 m Red 2 Lahar material 1 - 3 m Yellow
3 Lahar material < 1m Green
Elements at risk map as presented in Figure 4. is constitute of classiication of elements at risk in that area. he elements at risk tol classiication for deciding of elements at risk integrate in order to optimize the risk map in future. he elements at risk in lahar lows hazard map is classify as presented in Table 2.
In the Figure 5 presented of the risk map in urban area. By analysing of each elements at risk can devided into element value, and then by comparing each value of elements, it can be devided into three level of risk. Table 3 classiication of elements at risk is inluential with risk level as presented in Table. 4
his risk assessment is intended to provide infor-mation that will help communities to identify and pri-oritize mitigation activities that will reduce losses from the identiied hazards.
he essential data required for risk assessment are the lahar lows hazard map with diferent depth of lahar lows buried in risk area, distribution of the elements at risk, and status of a land cover area. By integrating these data, a general procedure how to determine the analysis
of the elements at risk caused by lahar lows hazard is presented in Figure 3.
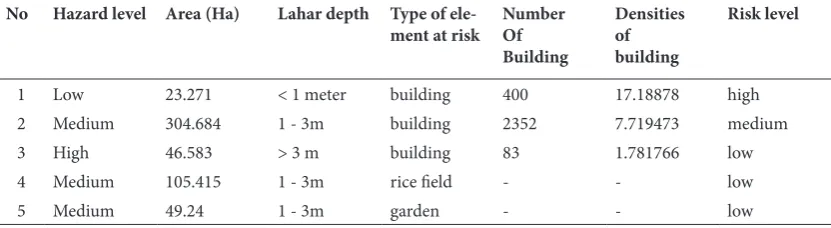
Identiication and inventory of element at risks can be conducted by digitizing the land use type directly from aerial photographs (Figure 4) scale 1 : 12.500. he-ses element at risks can be classiied based on the land utilisation presented in aerial photograph combined with the secondary data from Muntilan District. hree major of element at risk have been classiied based on their types e.g. building, agriculture area, gardens and river stream. Result of calculation of element at risk can be presented in Table 4. In this case, the economic value of each element at risks can not be included in this anal-ysis because the buildings in risk map can not be classi-ied based on their function. herefore we present now only the number of buildings, area of agriculture region and area of garden potentially threatened by lahar lows. We classify three level of risks based on the number and density of building, with the assumption that the higher density of building cause the high level of risk. If certain areas have no building so the number of people potentially endangered by lahar lows is actually low. he high hazard level is characterized by the depth of the lahar low is more than 3 meters (46,583 Ha) which distributed along the channels. he secondary class is the medium class whose 1 – 3 meters of depth. (459.34 Ha). he lowest hazard level is considered by the lahar depth lower than 1 mater (23.271 Ha). he criterion used to classify the risk level is the density of building with the assumption that the density of building rep-resents the population of theses area. he highest risk can be found in the low hazard area because the build-ing density is 17.19 unit/Ha. he buildbuild-ing density of the medium level is 7.71 unit/ha and the lowest risk of the-ses area is characterised by the density value 1.78 units/ ha.
4.Conclusion
A part of volcanic deposit materials remain past activities 1998 still settle in Western-north of Merapi slopes area, as upper stream of Senowo, Lamat and Sat rivers. Be found lahars deposit materials in along Lamat river, that is lahar lows evident passing that river. Along as Lamat river be found small river channel capacity, es-pecially in down stream of that river. he river channel capacity becomes small in down stream area because Table 2. Elements at risk in Muntilan urban area
No Element at risk Colour of Classiication
1 high building density Red 2 low building density Yellow
3 river stream area lines
4 land/agriculture area green
Table 3. Risk level in Muntilan urban area
No Elements at risk Colour Remarks
1 high building density Red High risk
2 low building density yellow Medium risk
3 river stream area, land/agriculture area
green Low risk
Table 4. Calculation of element at risk in Muntilan Urban Area
No Hazard level Area (Ha) Lahar depth Type of ele-ment at risk
1 Low 23.271 < 1 meter building 400 17.18878 high
2 Medium 304.684 1 - 3m building 2352 7.719473 medium
3 High 46.583 > 3 m building 83 1.781766 low
4 Medium 105.415 1 - 3m rice ield - - low
type of river morphology (natural reason) and local societies construct small bride on the river (additional reason. According the analysing of river morphology in Muntilan urban area (down stream of Lamat river) that area constitute of lahar lows risk.
By using the risk map and elements at risk in Muntilan urban area can make risk assessment of la-har lows for Mitigation references. As the aim of this research was to come up with the risk map for the Mun-tilan urban area using JSAS numerical simulation and
GIS and RS , it is a good idea to predict the lahar lows occurrence which threatened Muntilan urban area and to provide the awareness to the local societies. Exceed-ingly the lahar lows occurrence in that area on more than 74 years ago, may the local societies was forgotten with the disaster and not aware. On the other hand the lahar lows occurrence is very much inluenced by the topography and geomorphology. For example the river channel capacity of Lamat river located in the Muntilan urban area, On the Ketunggeng bridge (elevation + 438 m) until the river conluence with Blongkeng river (elevation + 313m), the river wide is narrow (around 6.0 m – 16.5 m) and the river bank is low (only 2.50 m – 9.0 m). Local societies who live in Muntilan urban area constructed many bridges, were caused river chan-nel capacity is decrease.
Muntilan urban area was located in do Stream of Lamat River is dangerous area from the lahar low when the pyroclastic low materals from the activity of Merapi volcano lowing to the western lank. Accord-ing the JSAS Numerical Simulation for lahar lows in Lamat river the lahar lows threaten in Muntilan urban area will occur on 100 year return period. he sotware of JSAS would be implemented for numerical simula-tion for lahar lows movement. By using GIS dynamic modelling the digital orthophoto is able to create a risk assessment of lahar lows in Muntilan urban area.
he result of this thesis can predicts hazard and risk map of lahar lows in Muntilan urban area with the
hazard, risk levels each area and also can predicts the risk assessment of elements at risk area. he principle of Sabo facilities is controlling the sediment supplies in the river channel in order to keep the base of river channel stable. When the sediment supplies from the sediment yield is over from the capacity of sabo dam, that materials will still covered in down stream area. he sediment supplies are depending of total volcanic deposit and rainfall intense.
Recommendation
Comparing to historical data, the simulation of la-har lows results are not it properly. Weaknesses of the simulation modeling are: (1) a good idea to once again verify on the ield to check the lahar lows activity was threatened of Muntilan urban area. his is important because the hazard map and risk map of lahar lows by using JSAS numerical simulation as inluenced with many parameters are static in nature and they may not take into consideration of the dramatic change of the causative agents, which are diicult to predict with high precision. For example rainfall, certain amount of rain-fall triggers lahar lows. (2)lLocal government is better reminding to the inhabitants of Muntilan urban area for lahar lows risk. By using socialization program the government can use the result of this paper to inform to the local society about lahar lows hazard in risk area. If necessary, the result can make reference to imple-ment disaster mitigation regulation for the local society, (3) the local government necessary actualize the spatial planning policy, which to prevent local society are con-structing house in the disaster prone area, such as in the risk lahar lows area. And the government invite to the local society for together take care of the real river func-tion, (4) the government and local society must partici-pate to keep existence of lahar lows countermeasures facilities, such as sabo facilities, lahar lows forecasting equipment and Warning system equipment.
References
Burrough, P.A., (1989), Matching spatial databases and quantitative models in land resource assessment. In: Soil Use and Management, 5(1989)1, pp. 3-8. ITC Module. (2004), Risk Analisis Using RS/GIS. he
Netherlands.
Itoh, H., Miyamoto K., Takahashi M., Takahama J., (2000), Hazard Estimation of the Possible Pyro-clastic Flow Disaster Using Numerical Simulation Related to the 1994 Activity at Merapi Volcano. Journal of Volcanology and Geothermal Research. van Westen, C.J. and Daag, A.S., (2005), Analysing the
relation between rainfall characteristics and lahar activity at Mount Pinatubo, Philippines. Earth sur-face processes and landforms : the journal of the British geomorphological research group, 30(13): 1663-1674.