Transition of Regime Lubrication from Fully Flooded Lubrication to
Starved Lubrication
Dedison Gasni
1,*) 1)Laboratory of Construction and Machine Design, Tribology Divison, Department of
Mechanical Engineering Faculty of Engineering
, Andalas University
Kampus Limau Manis, Padang 25163, Indonesia
*E-mail:
[email protected]
ABSTRACT
The lubricant supply from the inlet region to the contact area is very important for machine components moved relatively each other. Film thickness of machine components operated at high speeds in the contact area will be reduced due to reduced lubricant supply at the inlet region. It causes occurred transition of regime lubrication from fully flooded lubrication to starved lubrication; this phenomenon is known as starvation. To obtain the optimum working conditions and the life of the contacted materials, the transition of regime lubrication must be known, so that protection and anticipation can be done before the failure occurred on the machine components. In this study, the effect of film thickness at the inlet region had been observed and how effect of reduced film thickness at the inlet region in the contact area was. A combination of starved lubrication and mixed lubrication models had been used to predict changed in the regime of lubrication on the point contact. In the starved model, film thickness that occurred in the contact area would be affected by film thickness at the inlet region. While, the mixed lubrication model, film thickness formed would affect load sharing due to the film thickness of elastohydrodynamic lubrication (EHL) and the interaction of surface roughness in the boundary lubrication. The results of the analysis were plotted in the Stribeck curve. The calculation was performed by varying the ratio
between the film thickness at the inlet region and surface roughness or and different loads. From the
simulation results showed that the transition between the film thickness of fully flooded and starved lubrications
was taking place at the value of smaller than 6.
Key Words: Starvation, Starved lubrication model, Fully flooded lubrication, Mixed lubrication model, Stribeck curve, Coefficient of friction
.
ABSTRAK
Suplay pelumas di daerah kontak sangat penting, agar ketersediaan pelumas dapat dipertahankan selama komponen mesin yang berkontak beroperasi. Tebal lapisan film pada beberapa komponen mesin yang beroperasi pada kecepatan tinggi akan berkurang, karena berkurangnya suplay pelumas kedaerah kontak. Sehingga terjadi perubahan regim dari pelumasan dari fully flooded lubrication ke starved lubrication, fenomena ini dikenal dengan starvation. Untuk memperoleh kondisi kerja yang optimum dan umur dari material yang saling kontak, perlu diketahui kapan terjadi perubahan regim dari pelumasan ini terjadi, sehingga proteksi dan antisipasi dapat dilakukan sebelum kegagalan terjadi pada komponen mesin tersebut. Pada penelitian ini akan diamati bagaimana pengaruh berkurangnya tebal lapisan pelumas disesi masuk terhadap tebal lapisan film di daerah kontak. Kombinasi dari starved lubrication model dan mixed lubrication model telah digunakan untuk memprediksi perubahan regim dari pelumas ini pada point contact. Pada starved model, tebal lapisan film yang terjadi di daerah kontak akan dipengaruhi oleh tebal lapisan film di sesi masuk. Sedangkan pada mixed lubrication model, tebal lapisan film yang terbentuk akan mempengaruhi pembagian antara beban akibat tebal lapisan film dari elastohydrodynamic lubrication dan beban akibat interaksi dari kekasaran permukaan di daerah boundary lubrication. Hasil dari analisis diplot dalam kurva Stribeck. Perhitungan dilakukan dengan memvariasikan rasio antara tebal lapisan film pada sesi masuk dan kekasaran permukaan atau dan pengaruh beberapa beban. Dari hasil simulasi memperlihatkan bahwa transisi tebal
lapisan film antara fully flooded dan starved lubrication mulai terjadi pada nilai kecil sama dengan 6.
TeknikA 2
1. INTRODUCTION
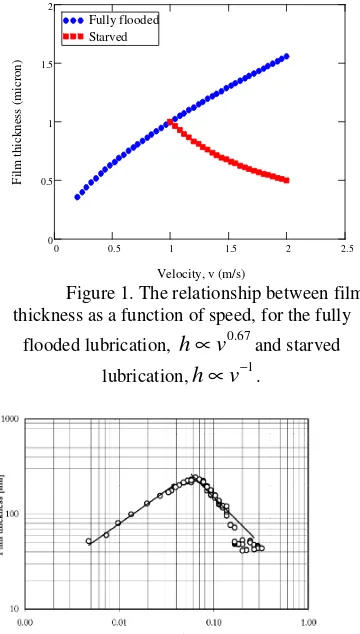
Phenomenon of fully flooded and starved lubrications on machine components is affected by film thickness of lubricant in the contact area. According to Hamrock and Dowson [1], fully flooded lubrication is characterized by increasing of film thickness in the contact area with increasing
speed. The relationship between the film
thicknesses and the speed is expressed by
h
∝
v
0.67. In contrast, the starved lubrication is reduced film thickness in the contact area with increasing speed and film thickness will be reduced at a certain speed where the film thickness after the speed will
follow the equation
h
∝
v
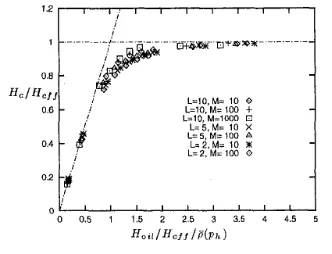
−1, as shown in Figure 1.Researches of starved lubrication have been done both numerically and experimentally by several researchers. Hamrock and Dowson [2], Damiens, et al. [3], Venner, et al. [4] and Chevalier, et al. [5] modelled starved lubrication by a numerical approach. Cann, at al. [6] measured film thickness using optical in the contact area by EHL apparatus in which the volume of lubricant at the inlet region was varied. Tests were conducted on the ball on disk apparatus and film thickness was measured by optical interferometry. Starved lubrication was occurred at a speed of 0.06 m/s with the gradient of line for fully flooded and starved lubrications 0.67 and -1.0, respectively as shown on Figure 2.
The numerical approach to determine the transition from fully flooded and starved lubrications is quite complex and the experimental approach is expensive. The measurements can only be performed on a laboratory scale, because until now, there is no method that can be used to measure the film thickness directly in situ. In this paper, a simulation has been done to investigate the transition of regime lubrication from fully flooded lubrication and starved lubrication in the point contact. Stribeck curve has been used to explain the phenomenon of starvation by mixed lubrication model approach. This curve is graphed as a function of coefficient of friction and Hersey number. Simulation to determine the coefficient of friction by using mixed lubrication model and Stribeck curve in the point contact had been made by Gasni [7]. In this paper, the simulation was done by combining the mixed lubrication and starved models in order to know when the phenomenon of starvation was occurred. There was a transition of film thickness from fully flooded and starved lubrications.
Figure 1. The relationship between film thickness as a function of speed, for the fully
flooded lubrication,
h
∝
v
0.67and starvedlubrication,
h
∝
v
−1.Figure 2. Film thickness as function of speed, starved lubrication occurred at a speed of 0.06 m/s
[6].
2. BACKGROUND
2.1 Starved Lubrication ModelThe basic assumption of the starved model is
thickness of lubricant in the contact area, h, is
determined by a film thickness on the fully flooded lubrication conditions by Hamrock and Dowson
[1]. Value of h is depended on the film thickness of
lubricant at the inlet region, which consists of hoil,
thickness of lubricant supply at the inlet region, and
h'oil, thickness of lubricant if the surface tension is
lubrication, contact radius and speed, respectively.
Figure 3. Starved lubrication model (modified from [4])
According to Crook [8], film thickness at the inlet region can be expressed by equation 1.1
∗ 1 √ ∅ / (1.1)
Where φ is a dimensionless coordinate expressed
with,
∅ /∗ / (1.2)
where R, is the reduce radius.
Comparison between the film thickness on starved
lubrication (h*) and the film thickness at inlet
region (hoil) derived by Wolveridge, et al. [9] based
on the computational solution of Orcutt and Cheng [10] as a function of length of nondimensional at
inlet region of film thickness, ψi.
∗
(1.3)
where
/
∗ / (1.4)
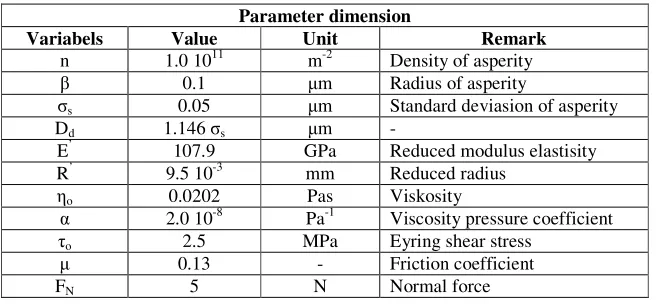
Chevalier [5] had done numerical study to investigate the effect of oil supply at the inlet region to starvation on EHL on the point contact for
a variety of loads (M) and materials (L) as shown in
Figure 4.
An approach of numerical solution had been done by Wolveridge, et al. [9] as shown in Figure 5 and obtained a curve fitting equation 1.5.
.
! ∗ "arctan 2.7 (1.5)
Figure 5. An approach of the numerical solution of Wolveridge, et al. [9].
At an EHL of mixed lubrication model, film thickness formula can be replaced by a film thickness for starved lubrication by using equation 1.5.
2.2 Starved Lubrication Model
Normal force acting on the mixed lubrication regime is sum of two components of force, namely the forces of boundary and EHL that can be expressed in equation 1.6.
F- F. F/ (1.6)
Where FA is the force carried by the asperity or
boundary lubrication component and FL is the force
carried by the fluid or EHL component.
Mixed lubrication regime is a transition between boundary lubrication and EHL. So that, the total pressure is load sharing between the asperity contact pressure and the elastohydrodynamic lifting pressure. So that equation 1.6 can be written in the form of pressure.
P- p. p/ (1.7)
Pressure distribution in the mixed lubrication regime is shown in Figure 6.
TeknikA 4
Figure 6. Pressure distribution in the mixed lubrication regime, according to Johnson, et al.
[11].
The coefficient of γ1 and γ2 is introduced on
Johnson model [11] to describe the lifting force of elastohydrodynamic and the contact force of surface asperity, and can be written in the equation below.
factor of the force due to asperity pressure.
2.2.1 Asperity Contact Component
Asperity contact model of Greenwood and Williamson [12] has been adopted in this study. Greenwood and Williamson developed a model based on the actual surface contact based on stochastic or random roughness of a surface. Based on the theory of Greenwood and Williamson model, the normal force acting on the contact surface is
F- n:βE=A?@AB s − h f s dsIH
(1.10)
Where Anom is the area of the nominal contact, E' is
the reduced elastic modulus defined as
3
summit with a flat surface and the flat surface with
of the surface asperity. So that FN can be written,
F- n:βE=A?@AF / LIMRTUSO (1.13)
It should be noted that Greenwood and Williamson use a different definition for the modulus of
then substituted into equation 1.13
45 proposed by Hamrock and Dowson [1] for the point contact in fully flooded condition as follows.
H 2.69U`.abG`.d WM`.`ab 1 − 0.6eM`.b
(1.15)
Where H, W, U, and G are the non-dimensional
parameters of film thickness, load, speed, and material respectively that are defined as follows:
H Rh, , W 2EP∗R, , U 2Eη`∗uR, ,
G 2α,E=
Where η0 is the viscosity, α' is the pressure
viscosity index. R' is the reduced radius expressed
in the equation 1.16. 3 fully flooded lubrication condition can be obtained
Substituting, rs→tvu and E′→J′
γ [16] into the
equation 1.17 is obtained
I
Total friction in the mixed lubrication regime is the summation of shear forces of asperity contacts and the lubricant layer. The total friction can be written as follows type. The magnitude of the friction coefficient is
μ~• ˆ‡ƒ„ƒ„ (1.20)
where pci is normal pressure of asperity. µci is
friction coefficient assumed constant for the entire asperity, so that the first form of the Eq. 1.20 can be written as
∑ ∬ μ-•…3 .ƒ„ Yp~•dA~• μYF. (1.21)
Where s is the coefficient of static friction.
Shear stress in the fluid layer can be determined by Eyring models where the shear stress of the lubricant depends on the rheology of the lubricant.
According to Evans [14], the model of Eyring do not behave in a linear shear stress at high shear rate, shear stress increases slowly until a maximum value. According to Bell, Kannel and Allan [15], the model of Eyring's is appropriate for the conditions in which behave as nonlinear viscous lubricant. Eyring shear stress can be determined from the following formula
γ€ ‡‹
Equations 1.22 obtained by arranging
τ• τ@ln •o9€‡‹ •Lo9€‡‹O 1‘ (1.23)
Fluid shear force per unit length of contact, FL, is
determined by integrating the shear stress along the direction of motion,
TeknikA 6
3. METODOLOGY
3.1 Solution of equation for film thickness and coefficient of friction.
Equation 1.9 describes the concept of load sharing
between the asperity contacts (1/γ2) and EHL (1/γ1).
Elastohydrodynamic contact component is
expressed with film thickness, h (Eq. 1.18) and
component asperity contact is declared with contact between asperities (Eq. 1.14). There are three
unknown variables, namely, 1/γ1, 1/γ2, and h. By
solving 3 equations simultaneously of equation 1.26 using commercial program MathCad, the value of
condition can be determined by substituting into
Eq. 1.5.
Film thickness, h, which is obtained from Eq. 1.26,
is film thickness at the condition of fully flooded lubrication where film thickness at the inlet region
is assumed to be infinite (∞). By varying the ratio
between film thickness at the inlet region and
surface roughness or , film thickness at starved
condition can be determined by substituting into
Eq. 1.5.
If film thickness on the starved condition has been known, so the magnitude of the load sharing
between the fluid force and asperity force (γ1 and
γ2) can be determined. The magnitude of the shear
force due to the contact asperity, the fluid force, and the coefficient of friction can be obtained from Eqs. 1.21, 1.24, and 1.25, respectively.
3.2 Calculation of film thickness at starvation conditionsandStribeckcurve.
Simulation data in predicting of the starvation phenomenon used Stribeck curves and film thickness on starved conditions by combining the starved lubrication and mixed lubrication models as described in the previous section. The influence of variation of ratio between film thickness at the inlet region and the surface roughness against film thickness in the contact area and the friction coefficient was investigated. As input parameters is given in the Table 1.
Table 1. Input parameters for the simulation of Stribeck curve.
Parameter dimension
Variabels Value Unit Remark
n 1.0 1011 m-2 Density of asperity
α 2.0 10-8 Pa-1 Viscosity pressure coefficient
τo 2.5 MPa Eyring shear stress
0.13 - Friction coefficient
FN 5 N Normal force
4. Results and Discussion
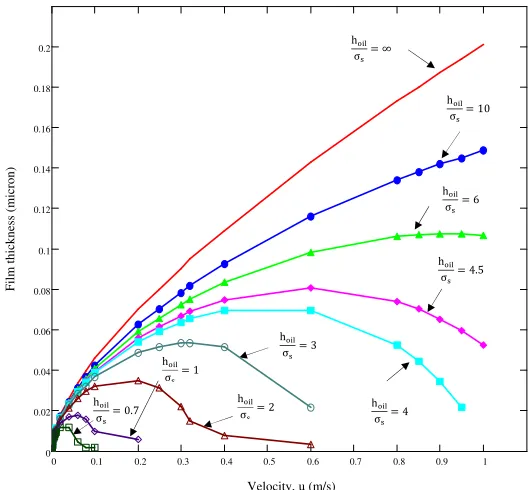
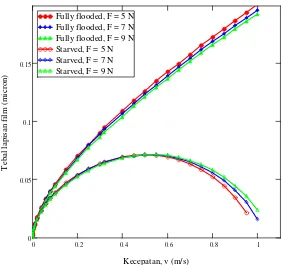
Figure 7 shows the relationship between the film thickness and the velocity by varying ratio between film thickness at the inlet region and surface roughness. Simulation was performed using a commercial program MathCAD by combining mixed lubrication and starved lubrication models. In this case, the force was kept constant at 5 N, as well as, viscosity and surface roughness. The speeds were varied from 0.0001 m/s up to 1 m/s
and the ratio between the film thickness at the inlet
region and surface roughness was varied from ∞ to
h@•z starvation phenomena was not visible. The trend of
the curve for = 10 was almost the same as the
curve for fully flooded conditions or =∞.
Starvation phenomenon appeared at = 6, where
the speed was 0.9 m/s which was characterized by reduced film thickness in the contact area. By
reducing value of , starvation phenomena was
seen clearly, and it could be seen at = 0.7 where
speed was 0.04 m/s.
Starvation phenomenon can also be observed using Stribeck curve as shown in Figure 8. Stribeck curve was plotted by determining the coefficient of friction occurred in the contact area and speed. From this curve, it can be seen that for the fully
flooded condition, it was clearly visible transition among boundary lubrication, mixed lubrication, and EHL with increasing speed and this is illustrated in Figure 9. The separation between the two surfaces was seen to rise with increasing speed at which the film thickness also increased. By rising value of
, Stribeck curve began to change, especially at
high speeds where the change began at = 6,
which was characterized by increased coefficient of
friction at high speeds. When = 0.7, the
transition between lubrication regimes seemingly unclear. This was caused by a lubricant supply was insufficient in the contact area, because it was insufficient lubrication at the inlet region. As a result, film thickness in the contact area was reduced with increasing speed and at the boundary lubrication condition, it was characterized by increasing friction coefficient close to = 0.13.
Figure 7. Film thickness function of speed for several variations of , F = 5 N.
Figure 10. Film thickness function of velocity for different loads with = 4.
Simulations were also carried out by varying the loads, F = 5, 7, and 9 N on the fully flooded
condition and the was kept constant at 4 as
shown in Figure 10. On the fully flooded condition, by increasing of load, film thickness would be elastohydrodynamic film resulting in separation so thick coating films increased.
5. Conclusion
A simulation to demonstrate the phenomenon of starvation at the point contact has been made by combining the mixed lubrication and the starved lubrication models. The results of simulation show that the film thickness at the inlet region would affect the starvation phenomenon in which there was a transition between fully flooded and starved lubrications. The changes of this transition occurred with increasing speed. This starvation phenomenon
began to occur at I‹„´
σU = 6, which was characterized
by a reduction in film thickness in the contact area.
From the Stribeck curve, on the region of elastohydrodynamic lubrication there was an
increase of friction coefficient with reduced I‹„´
σU
and the I‹„´
σU < 0.7 the curve tended to be flat with
friction coefficient close to = 0.13.
References
[1] Hamrock, B. J. and Dowson, D.
Elsotohydrodynamic Lubrication of
Elliptical Contacts for Materials of low Elastic Modulus 1: Fully Flooded Conjunction. Trans. ASME, J. Lubric. Technol., 1978, 100, 236 – 245.
[2] Hamrock, B. J. and Dowson, D.
Elsotohydrodynamic Lubrication of
Elliptical Contacts for Materials of Low Elastic Modulus II: Starved Conjunction. Trans. ASME, J. Lubric. Technol., 1979, 101, 92 – 98.
[3] Damiens B., Venner C. H., Cann P. M.
TeknikA 10
[4] Venner, C.H., Popovici G., Lugt P. M.,
and Organisciak M., Film Thickness
Modulations in Starved
Elastohydrodynamically Lubricated
Contacts Induced by Time-Varying Lubricant Supply, Trans. ASME, Journal of Tribology, 2008, Vol. 30, 041501-1-10.
[5] Chevalier F., Lubrecht A. A., Cann P. M.
E., Colin F., and Dalmaz G., Film Thickness in Starved EHL Points Contacts, Trans. ASME, Journal of Tribology, 1998, Vol. 120, 126-133.
[6] Cann P. M. E., Damiens B., and
Lubrecht A. A., The Transition between Fully Flooded and Starved Regimes in EHL, Tribology International, 2004, Vol. 37, 859-864.
[7] Gasni D, Simulasi Koeffisien Gesek
untuk Mixed Lubrication Model pada Point Contact, Jurnal TeknikA, Oktober 2012, Vol. 19, 2, 28-42.
[8] Crook A. W., The Lubrication of
Rollers-I, Trans. R. Soc. London, 1958, Ser A 250, 380.
[9] Wolveridge P. E., Baglin K. P., and
Archard J. F., The Starved Lubrication of Cylinders in Line Contacts, Proc. Inst. Mech. Eng., 1971, 181, 1159-1169.
[10] Orcutt F. K., and Cheng H.S.,
Lubrication of Rolling Contact
Instruments Bearing, Giro Spin Axis,
Hydrodynamic Bearing Symposium,
1966, vol 2 (M.I.T. Instrument Lab., Cambridge, Mass)
[11] Johnson, K.L. (1985), Contact
mechanics, Cambridge University Press.
[12] Greenwood, J. A. and J. B. P.
Williamson (1966). Contact of
Nominally Flat Surfaces. Proceedings of the Royal Society of London. Series A. Mathematical and Physical Sciences 295(1442): 300-319.
[13] Gelinck, E.R.M. (1999). Mixed
Lubrication on Line Contact. Ph.D thesis, University of Twente Enchede, The Nederlands.
[14] Evan, C.R. and Johnson, K.L., The
rheological Properties of
Elastohydrodynamic Lubricants, Proc. Instn. Mech. Engrs., 200, 303.
[15] Bell, J.C., Kannel, J.W., and Allen, C.
M. (1964), The rheological behaviour of the lubricant in the contact zone of a rolling contact system. ASME, Journal Basic Eng. 86, 423.
[16] Gelinck, E. R. M. and D. J. Schipper
(2000). Calculation of Stribeck Curves
for Line Contacts. Tribology