Enzymatically Liquefaction Sweet Potato (
Ipomea batatas
L) to
Bioethanol Production Using
Saccharomyces cerevisiae.
I Wayan Arnata, Bambang Admadi H., and Esselon Pardede Agroindustrial Technology, Udayana University
Abstract
Sweet Potato (Ipomea batatas L) were hydrolyzed by enzymatically liquefaction process and fermented by Saccharomyces cerevisiae to produce bioethanol. The objective of this research was to determine (1) the optimum conditions of enzymatically liquefaction process, (2) the optimum conditions of fermentation process using Saccharomyces cerevisiae. These studies was designed by factorial randomized block design with two factors. The liquefaction process consists of 2 factors, namely: the concentration of α -amylase enzyme and temperature. The concentration of α-amylase enzyme consists of 3 levels, namely 0.8; 1 and 1.2 ml/kg of starch. The temperature of hydrolysis consists of 3 levels, namely : 90oC, 95oC and 100oC. In the fermentation process consists of 2 factors, namely the pH of the substrate and temperature. The pH of the substrate consists of 3 level: 4.5; 5.0 and 5.5, while, the temperature consists of 3 level, namely: 30oC, 35oC, 40oC. The best results on liquefaction process was the enzyme concentration 1.2 ml/kg of starch with a temperature of 100oC. Liquefaction process was produced glucose with a concentration of 57.56 g/L. The best fermentation process carried out at a pH of 4.5 with a temperature of 35
o
C and produce bioethanol with a concentration of 5.32 %(v/v) and fermentation efficiency of 70.16 % of theoretical ethanol production.
Keywords : Liquefaction, sweet potato, bioethanol, Saccharomyces cerevisiae
INTRODUCTION
An efficient method for conversion of biomass into fuel is by bioethanol production because bioethanol is an economical as well as environmentally friendly fuel. Bioethanol has the advantages of being renewable, cleaner burning and produces no greenhouse gases
(Altıntas et al., 2002). Sweet potato is one source of starch which is widely used in industry, one of them was for the production of bioethanol. Bioethanol production from starch raw materials requires the hydrolysis process, because of yeast are unable to consume raw starch and hence, the starch must first be hydrolysis into simple sugars (Birol et al., 1998). Hydrolysis process can be carried out enzymatically or chemically (Taherzadeh and Karimi, 2007). The hydrolysis of starch to products with low molecular
weight, catalyzed by α-amylases is one of the most important commercial enzyme processes. Amylase enzyme used to break down the polymer to smaller sugar units, which is eventually converted to the individual basic glucose units (Delphine et al., 2000; Baskar et al., 2008).
repression, efficient ethanol production and a tolerance for environmental stresses, such as high ethanol concentration and low oxygen levels.
In this work, the conversion of starchy materials into bioethanol have two steps, enzymatically liquefaction of starch, and fermentation of sugar to etanol. Batch fermentation runs were performed to produce bioethanol using strains of Saccharomyces cerevisiae.
MATERIALS AND METHODS
Raw material. Sweet potato was collected from Tabanan. Saccharomyyces cerevisiae
was collected from microbiology laboratorium Bogor University. Sweet potato was analysed to determine chemical compotition before it is used in liquefaction and fermentation process.
Inoculum culture S. cerevisiae. The strain S. cerevisiae were maintained on potato dextrose agar (PDA). The medium composition for cultivation was as follow: yeast extract 5 g/L, malt 5 g/L, glocose 10 g/L and peptone 5 g/L. Cultivation was conducted in 250 ml Erlenmeyer flask for 24 hours at 30 oC and agitation 125 rpm.
Liquefaction. Sweet potato slurry was hydrolyzed enzymatically. The suspension sweet potatoes made with a concentration of 30 % (w/v), pH was adjusted to 6.5 with NaOH. Gelatinization process carried out at a temperature of 90 °C. The enzyme concentration and temperature liquefaction process was conducted in accordance with the treatment for 1 hour.
Fermentation. Batch fermentation process carried out for 4 days in 250 ml erlenmeyer with 200 ml work volume. Substrate was sterilized at 121 ° C for 15 minutes and cooled, then cultured S. cerevisiaewith a concentration of 10% (v/v) was added aseptically to the substrate. The pH and temperature of the process carried out in accordance with the treatment.
RESULTS AND DISCUSSION
Proximate analyse showed that the contents of sweet potato flour was 67,94 ± 1,07% moisture, 0,91 ± 0,03 % ash, 16,07 ± 1,15 % fat, 0,04 ± 0,03 % proteine, 2.69 ± 0.04 % crude fiber and 15,05 ± 2,25% carbohydrate. The moisture content of the substrate has a major impact on how long it can keep in the storage and still remains nutritions.
In liquefaction proses, the analysis variance of the concentration of glucose showed that the difference of treatment liquefaction enzyme concentration and temperature significantly affect the concentration of glucose. The highest concentration of glucose that is 57.56 ± 4.81 g/L generated from the process liquefaction using an enzyme concentration 1.2 ml/g with a temperature of 100 °C and this treatment was significantly different from other treatments. The lowest concentration of glucose that is 22.96 ± 11.20 g/L resulted from treatment using enzyme concentrations of 0.8 ml/g with a temperature of 100 °C and this treatment was also significantly different from other treatments. The average value of the glucose concentration in the liquefaction process showed in the Table 1.
Table1. The average value of the glucose concentration in the liquefaction process
Treatment Temperature (T
** Notation with different letters behind the averages indicate a significant difference between treatments (p<0.05)
The difference results of the concentration glucose in liquefaction process due to α -amilase is specific enzyme, namely in time, temperature, pH, concentration and specific substrates. The rate of hydrolysis can be controlled by regulating the enzyme concentration and hydrolysis time, so that the enzymatic reaction can be controlled and can be terminated if the degree of conversion has been reached. Lee et al. (1995) studied ethanol production by fermentation using tapioca starch. They reported that liquefaction and saccharification of tapioca starch resulted in a glucose-maltose mixture containing approximately 92 % glucose and 8 % maltose.
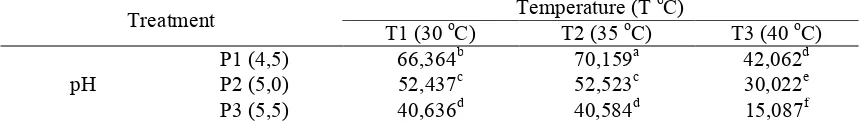
In fermentation process, analysis of variance showed that the interaction of temperature and pH in the fermentation process significantly affect for concentration ethanol (P<0.01). The highest ethanol concentration of 5.320% (v/v) produced from the fermentation process using a temperature of 35 ° C with pH 4.5 and this treatment was significantly different from other treatments. The lowest ethanol concentration of 0.030% (v/v) resulted from treatment using a temperature of 45 ° C with a pH of 5.5 and this treatment was also significantly different from other treatments. The average of ethanol concentration (% v/v) in fermentation processes showed in the Table 2.
Table 2. The average of ethanol concentration (% v/v) in fermentation processes
** notation with different letters behind the averages indicate a significant difference between treatments (p <0.05)
Table 3. The fermentation efficiency (% of theoretical ethanol) in the fermentation process
Treatment Temperature (T
** Notation with different letters behind the averages indicate a significant difference between treatments (p <0.05)
Efficiency of fermentation is the percentage concentration of ethanol produced to ethanol obtained theoretically. Ethanol is obtained from the theoretical stoichiometric ratio of the fermentation process in which one mole of glucose will produce 2 moles of ethanol and 2 moles of CO2(Caylak and Fazilet, 1998). Analysis of variance on the efficiency of
fermentation showed that the interaction of temperature with a pH significantly affect to the fermentation efficiency. Highest fermentation efficiency of 70.159% of the theoretical ethanol production and resulting from the interaction of temperature of 35 °C with a pH of 4.5. Fermentation efficiency of 70.159% indicate that the glucose is used as the substrate is not fully utilized for the formation of ethanol. The fermentation efficiency (% of theoretical ethanol) in the fermentation process showed in the Table 3.
REFERENCES
Altıntas, M., Ulgen, K. O., Kırdar, B., Onsan, Z. I. and Oliver, S. G. 2002. Improvement of
ethanol production from starch by recombinant yeast through manipulation of environmental factors. Enzyme Microb. Technol. 31, pp. 640-647.
Birol, G., Önsan, Z. I., Kirdar, B. and Oliver, S. G. (1998) Ethanol production and fermentation characteristics of recombinant Saccharomyces cerevisiae strains grown on starch. Enzyme Microb. Technol. 22, pp. 672-677.
Baskar G., C. Muthukumaran, and S. Renganathan. 2008. Optimization of Enzymatic
Hydrolysis of Manihot Esculenta Root Starch by Immobilized α-Amylase Using Response Surface Methodology. International Journal of Chemical and Biological Engineering 1:3, pp. 155-159
Caylak B. and Fazilet V.S. 1998. Comparison of Different Production Processes. Turk J Chem. 22. Pp. 351-359.
Delphine P. J., P. B. Marie, Z. Nadine, and M. R. Gilbert. 2000. Kinetics of cassava starch hydrolysis with Termamyl® enzyme. Biotechnlol. Bioeng., vol. 68, pp.71-77.
Lee, Y., Lee, W. G., Chang, Y. K. and Chang, H. N. 1995. Modelling of Ethanol Production by Saccharomyces cerevisiae from a Glucose and Maltose Mixture. Biotechnol. Lett. 17, pp. 791-796.
Miller G. L. 1959. Used of Dinitrosalicylic Acid Reagent for Determination Reducing Sugar. Analytical Chemistry. 31 pp. 428-428.