Rizky Nur Lestari, 2015
CHAPTER III
RESEARCH METHODOLOGY
A. METHODOLOGY
1. Research Method and Research Design
a. Research Method
Research method that use in this paper is quasi experiment. Quasi experiment includes assignment, but not random assignment of participants to group it is due to experimenter cannot create groups for experiment (Creswell, 2012).This method is appropriate with the purpose of the research which is investigate the impact of peer led team learning method towards students’ cognitive and leadership skills. Hence, there are 2 groups that involved in the experiment, control and experimental groups. The control group is the group which not given any treatment meanwhile the experimental group is the group which given experimental treatment (Creswell, 2012). In this research this method gives different treatment to two different classes, 7th grade students. Both of them assessed with the same questions, but given different treatment.
b. Research Design
Rizky Nur Lestari, 2015
Here are the diagram of this design is as follow:
Table 3.1 Research Design: The One Group Pretest-Posttest
Design
A : Experimental group which given project “how to reduce
greenhouse gases” by the guidance of peer leader
B : Control group which given experiment “reducing greenhouse
gases”
O1 : Pretest O2 : Posttest X : Treatment
Pretest and Posttest which as dependent variable and the treatment given is the method that Author would like to implement on this study, pretest and posttest item are the same item, which is depend on certain scale that Author measure toward groups.
B. Participants
Rizky Nur Lestari, 2015
C. Population and Sample
The location of this research is International Junior High School in Bandung which uses English as their main language, and National Curriculum 2013 and one of International curriculum.
The population in this research will be 7th grade students. The sample of this research is two classes which are Secondary 1a as experimental group and given treatment project learning, about how to decrease greenhouse gases by guidance of peer leader and Secondary 1b as control group and given treatment experiment about reducing greenhouse gases.
The technique of sampling will be Purposive Sampling. According to Fraenkel and Wallen (2007) stated that purposive sampling which researcher choose the sample based on some consideration, which compare cognitive achievement. Meanwhile, the researcher choose
sample based on leadership skills that the students’ have.
D. Assumption
The assumptions as the foundation of this study as follow:
1. Peer led team learning can convince under-represent students,
provide experience for students in leadership and enhance students’
cognitive (Horwitz and Rodger, 2009).
2. Peer led team learning is proven can increase students’ attitude
towards science, build students’ confidents, and develop some skills of students (Bramaje and Espinosa, 2013).
3. Peer led team learning is able to gain students’ critical thinking in
science course and it also able to improves students’ performance
especially in female (Quitadamo, Brahler, and Crouch, 2009) 4. The implementation of peer led team learning is proven can
Rizky Nur Lestari, 2015
5. Peer led team learning can improve retention of students and motivate students to learn better, students are more responsible, and gain more retention (Lewis, 2011).
E. Hypothesis
Null Hypothesis that is tested in this study are as follow:
Ho : There is no difference of students’ cognitive and leadership skill in learning global warming through Peer-Led Team Learning method H1-1: There is difference of students’ cognitive in learning global warming
through Peer-Led Team Learning method.
H1-2: There is difference of students’ leadership skill in learning global warming through Peer-Led Team Learning method.
F. Operational Definition
In order to avoid misunderstanding in this research, therefore the operational definition that needs to be explaining as follow:
1. Peer-Led Team Learning is one of learning method which involves students working in small groups which facilitate by a trained leader. Learning process is conducted by using group project in order to create a product which is in line with global warming concept. there are two things that will be measured after conducting this learning method, there are leadership skills which can be measured by observing how peer leader manage the team and cognitive level of students which is measured before and after the treatment given by giving 20 multiple choice questions which covers C1-C5. The syntax of this approach are: a. Teacher tells students about what peer led team learning is,
including the rules to implement peer led team learning
b. Teacher observe students in order to choose peer leaders for the team
Rizky Nur Lestari, 2015
d. Teacher trains the team leader about the concept and leadership skills that they should have like responsibility, the urge of domination, consistency and perseverance, physical energy, success-oriented, articulate and persuasiveness, planning skills, determination and courage, self-confidence, empathy with the group, and emotional balance and control. Those several aspect of leadership skills measured by using observational sheet which is done by the teacher in order to assess the quality of peer leader e. Teacher implement the peer led team learning by using group
project the team should create a product which is in line with the concept by guidance of peer leader.
f. Teacher then observe the classes, the teams and peer leader, teacher still guide them but not as much as the peer leader
2. Cognitive that is measured in this research involves from Bloom’s taxonomy revision level cognitive of C1 (remember), C2 (understand), C3 (apply), C4 (analysis), and C5 (evaluate) based on Bloom’s Taxonomy Revision. This competence is measured by using multiple choice questions (pre-test and post-test), where consist of 20 items. Pretest done when students have not given any treatment meanwhile posttest done after students given the treatment. These test items will cover validity, reliability, difficulty level and discriminating power. 3. Leadership skill is the skills to influence other people, the indicators of
leadership skills is needed in order to be more focus in measuring
Rizky Nur Lestari, 2015
G. Research Instrument
Instrument is necessary to be used for gaining data; there are two instruments that are used in this research. Those instruments are described below:
1. Objective Test
Objective test that is use in this research is multiple choice questions which covers some cognitive level; C1 (remembering), C2 (understanding), C3 (applying), C4 (analyzing), and C5 (evaluating)
that can be measure students’ cognitive in learning global warming in
both experiment class which use peer led team learning as learning model and control class. By conducting objective test, it can indicates how effective the implementation of peer led team learning is for
students’ cognitive. Here are the Objective Test Specification before
validity test that has been judged and revised by expert and ready to be tested to students that have learnt global warming concept to check the validity of the questions
Table 3.2 Objective Test (pretest and posttest question) before
Rizky Nur Lestari, 2015
Here are the table shown the distribution of cognitive level in some subchapter of global warming concept after being tested by using ANATES
Table 3.3 Objective Test (pretest and posttest question) after
Rizky Nur Lestari, 2015
No Concept Cognitive Domain ∑ %
C1 C2 C3 C4 C5
Percentage (%) 5 15 25 30 25 - 100
The multiple choice questions were analyzed by using ANATES. Here are the requirements that analyzed in order to get the validity results are:
a. Validity
A test that can be said it is valid when it can measure what it purposes to measure (Arikunto, 2011). It provides the information to the researcher about how is the object that is measure. The validity of the test is influenced by the item of the test (Arikunto, 2011). The equation to measure the validity of test items as follow:
∑ [ ∑ ∑ ]
√[ ∑ ∑ ][ ∑ ∑ ]
Where,
rxy = items correlation coefficient.
X = items scores N = amount of subject
(Arikunto, 2011)
Rizky Nur Lestari, 2015
r11 = ( )(1-∑ )
Table 3.4 Validity Interpretation
Correlation Coeficient Validity Criteria
0,80 < r ≤ 1,00 Very high
0,60 < r ≤ 0,80 High
0,40 < r ≤ 0,60 Enough
0,20 < r ≤ 0,40 Low
0,00 ≤ r ≤ 0,20 Very low
(Minium et al., 1993)
b. Reliability
A reliable test is the test that is able to provides the stability and consistency of the result of a certain character (Arikunto, 2011). The equation that is use to measure the reliability is shown in the next page:
Where,
r11= Instrument reliability n =Amount of question
∑ = Amount of Varian score in each item = Varian total
Rizky Nur Lestari, 2015
Table 3.5 Reliability Interpretation
Correlation
Coefficient
Reliability
Criteria
0,80 < r ≤ 1,00 Very high
0,60 < r ≤ 0,80 High
0,40 < r ≤ 0,60 Enough
0,20 < r ≤ 0,40 Low
0,00 ≤ r ≤ 0,20 Very low
(Minium et al., 1993)
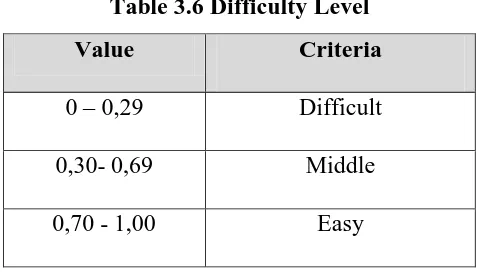
c. Difficulty level
A good test item is the test item which has balance the difficulty level of each problem that stated in the test item, the categories of difficulty level are: easy, difficult, and medium, those categories should balanced in the test item. The equation to measure difficulty level is shown below (Arikunto, 2012):
P =
P = Difficulty level
B = Number of students who answer correctly N= Total number of students
Rizky Nur Lestari, 2015
Table 3.6 Difficulty Level
Value Criteria
0 – 0,29 Difficult
0,30- 0,69 Middle
0,70 - 1,00 Easy
(Arikunto, 2012)
d. Discriminating power
Discriminating power is use to determine students in higher achiever or lower achiever. Test item which has a good discriminating power can differ students in higher achiever and lower achiever
(Arikunto, 2010). A good question is a question that can’t be answered by higher achiever is also can’t be answer by lower achiever. The
equation to analyze discriminating power is shown below.
Dp = - =PA-PB
D = Discriminating power JA = Amount of high achiever JB = Amount of low achiever
BA= Amount of high achiever who answers question with the right answer
BB= Amount of low achiever who answers question with the right answer
PA = Proportion of high achiever who answers question with the right answer
Rizky Nur Lestari, 2015
The discriminating power of test item can be calculated by using ANATES software the value of it can be interpret in the table of discriminating power interpretation as shown below.
Table 3.7 Classification of Discriminating Power
D Classification
0,00 – 0,20 Poor
0,21 – 0,40 Satisfactory
0,41 – 0,70 Good
0,71 – 1,00 Excellent
(Arikunto, 2010)
2. Observation Sheet
Observational sheet that used in this research is used to observed how team leader dominating the group and guides the team. Observational sheet that is used by the teacher to check how the quality of peer leader in each team . Observational sheet is arranged based on eleven of indicator of leadership like responsibility, the urge of domination, consistency and perseverance, physical energy, success-oriented, articulate and persuasiveness, planning skills, determination and courage, self-confidence, empathy with the group, and emotional balance and control, then those indicators adjusted with the activities that they do during project making.
Rizky Nur Lestari, 2015
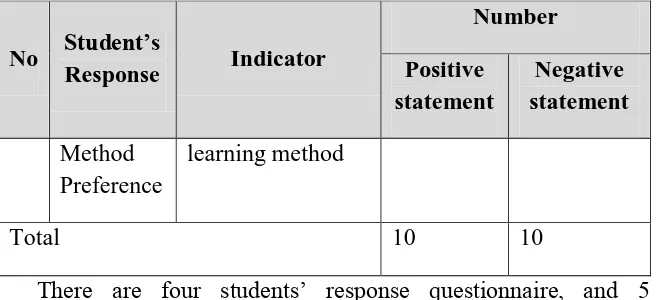
3. Questionnaire
Questionnaire in this research is used to investigate
students’ impression after learning global warming through peer
led team learning. This questionnaire is based on Likert Scale. This is used to investigate the weakness of teaching learning activity. This questionnaire is given in the end of the lesson. Here is the blueprint of questionnaire that is used in this research
Table 3.8 Blueprint Students’ impression Questionnaire
Rizky Nur Lestari, 2015 given four choices, there are strongly disagree, slightly disagree, slightly agree, and strongly agree. Data that obtained will be interpreted into some categories the categories based on Arikunto (2013) are
Table 3.9 Scoring Guideline of Students’ Response
Strongly
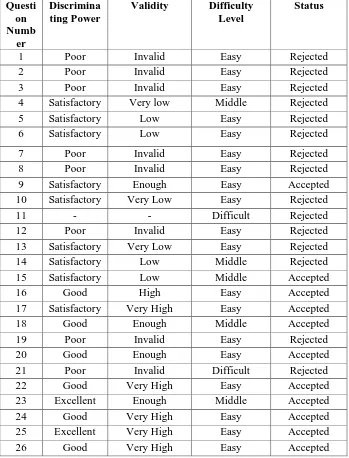
1. Recapitulation of validation result of objective test
Objective test that used to measure students’ cognitive is 20
Rizky Nur Lestari, 2015
eight grader students who have learnt global warming concept before. The result of validation test would be displayed on the table below. Test item Result
Reliability of these test item result: 0.97 (Very High)
Table 3.10 Recapitulation of Validation Test Result by using
ANATES
4 Satisfactory Very low Middle Rejected
5 Satisfactory Low Easy Rejected
6 Satisfactory Low Easy Rejected
7 Poor Invalid Easy Rejected
8 Poor Invalid Easy Rejected
9 Satisfactory Enough Easy Accepted
10 Satisfactory Very Low Easy Rejected
11 - - Difficult Rejected
12 Poor Invalid Easy Rejected
13 Satisfactory Very Low Easy Rejected
14 Satisfactory Low Middle Rejected
15 Satisfactory Low Middle Accepted
16 Good High Easy Accepted
17 Satisfactory Very High Easy Accepted
Rizky Nur Lestari, 2015
I. Instrument Non Test Requirements
1. Observational Sheet
Observational sheet that used in this research is use to know how peer leader guides their team in making project. The criteria for leadership skills is based on Landau and Weissler (1991); John (2007). Observational Sheet filled by observer that observed how the team works, and how team leader guides the team in making project. Observer gives checklist on the observational sheet when team leader did during the project making.
2. Questionnaire
Questionnaire is used to investigate students’ response in
learning global warming through peer led team learning. In some questionnaire, attached some questions that is used to investigate the quality of peer leader that can’t be observed directly by using observational sheet.
Rizky Nur Lestari, 2015
a. Peer Leader Selection and Training
A qualified team leader is the one who has good cognitive understanding in the concept, and good leadership skills. Researcher first observed the condition of the class and each student in order to investigate which students that have good cognitive understanding yet good responsibility during teaching learning process in class. This observation was done 1
– 3 meetings before conducting the research. The team leader that chosen and the team are giving training on leadership skills. Since the character of the students is very active, researcher choose game of leadership to trained them in leadership skills by attaching some concept of global warming in the games. The leadership training implementation will be attached on the appendix.
J. Data Processing
In this research, there are two kinds of data that processed differently. Objective test processed by using SPSS software quantitatively; meanwhile observational sheet processed qualitatively. The explanation of processing data quantitatively will be shown below
1. Quantitative Data Processing
Rizky Nur Lestari, 2015
a. Score of Test Item
Test item consist of 20 multiple choice questions about global warming and subchapter of global warming. This test items that used for both control and experimental class is the questions that already tested by using ANATES, and validation process. Each correct answer will be given 5 score, and incorrect answer will be given 0 score. So that the final score for those who can answer all the questions correctly will be 100.
b. Gain Score and Normalized Gain
After processing the data and get the score from test item, data then processed through gain score and normalized gain score these score determined from pretest and posttest score. Based on Hake (1999) define that gain score comes from different result between pretest and posttest. This different result indicates the
students’ improvement after giving treatment. Meanwhile, normalized gain is able to determine students’ achievement improvement. When gain is increase, so does normalized gain <g>
Here are the formula to calculate Gain score based on Hake (1999)
G = Sf - Si
Where:
G = Gain score Sf = Post-test score Si = Pre-test score
(Hake, 1999)
The effect of implementing Peer Led Team learning can be seen in the result of Gain score that calculated by using Microsoft excel. These Gain score indicates how effective peer led team
Rizky Nur Lestari, 2015
normalized gain is use to see students’ improvement, in both lower
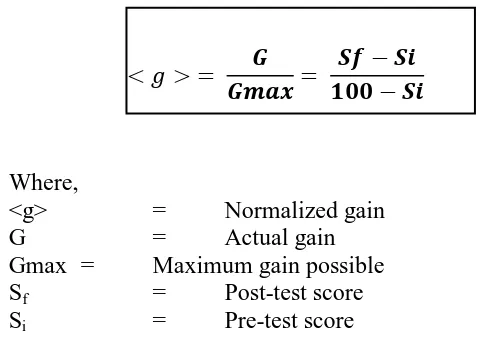
achiever and higher achiever. The formula of normalized gain based on Hake (1999) will be shown below
Where,
<g> = Normalized gain
G = Actual gain
Gmax = Maximum gain possible Sf = Post-test score
Si = Pre-test score
(Hake, 1999)
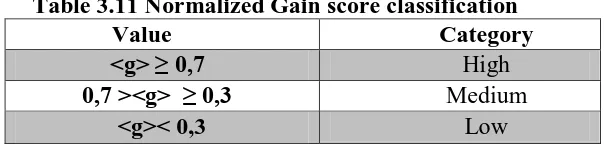
The normalized gain which already obtained can be interpreted by using these criteria based on Hake (1999)
Table 3.11 Normalized Gain score classification
Value Category
<g> ≥ 0,7 High
0,7 ><g> ≥ 0,3 Medium
<g>< 0,3 Low
c. Normality Test
Rizky Nur Lestari, 2015
homogeneity and hypothesis test. The criteria of this parametric statistic are when significance value > 0.05. Hence, Ho will be accepted and H0 will be rejected or denied if significance value < 0.05 (Sudjana, 2005). The hypotheses are:
H0: Sample comes from population that has normal distribution. H1: Sample comes from population that has not normal
distribution.
d. Homogeneity Test
Homogeneity test is used in order to investigate whether the sample of population comes from the same variance or not. In this research, homogeneity test that used is Levene’s test by using significance level 5%, which analyzed by using SPSS 20.0. if two sample is homogenous, the next test that will used is
t test, if both test is not homogenous, then it will used t’ test. The data will be considered as homogeny as if it’s significance value
has higher or equal with 0.05 so that t test can be used to analyzed the data for the next step.
e. Independent T test
T test is used to analyzed whether the students who given treatment peer led team learning get some improvement or not. This improvement can be seen by analyzing the posttest score after implementing peer led team learning method. Here are the criteria of significance level of t test:
i. As if significance level (sig.) is higher or equal with 0.05 so that Ho is accepted
Rizky Nur Lestari, 2015
In this research, there are two kinds of data that processed differently. Objective test processed by using SPSS software quantitatively; meanwhile observational sheet processed qualitatively. The explanation of processing data quantitatively will be shown below
2. Score of Test Item
Test item consist of 20 multiple choice questions about global warming and subchapter of global warming. This test items that used for both control and experimental class is the questions that already tested by using ANATES, and validation process. Each correct answer will be given 5 score, and incorrect answer will be given 0 score. So that the final score for those who can answer all the questions correctly will be 100.
3. Gain Score and Normalized Gain
After processing the data and get the score from test item, data then processed through gain score and normalized gain score these score determined from pretest and posttest score. Based on Hake (1999) define that gain score comes from different result between pretest and posttest. This different result indicates the
students’ improvement after giving treatment. Meanwhile, normalized gain is able to determine students’ achievement
improvement. When gain is increase, so does normalized gain <g> Here are the formula to calculate Gain score based on Hake (1999)
G = Sf - Si
Where:
Rizky Nur Lestari, 2015
(Hake, 1999)
The effect of implementing Peer Led Team learning can be seen in the result of Gain score that calculated by using Microsoft excel. These Gain score indicates how effective peer led team
learning is towards students’ conceptual understanding. Furthermore, normalized gain is use to see students’ improvement, in both lower
achiever and higher achiever. The formula of normalized gain based on Hake (1999) will be shown below
Where,
<g> = Normalized gain
G = Actual gain
Gmax = Maximum gain possible Sf = Post-test score
Si = Pre-test score
(Hake, 1999)
The normalized gain which already obtained can be interpreted by using these criteria based on Hake (1999)
Table 3.12 Normalized Gain score classification
Value Category
<g> ≥ 0,7 High
0,7 ><g> ≥ 0,3 Medium
<g>< 0,3 Low
K. Qualitative Data Processing
1. Descriptive Analysis of Students’ Cognitive Improvement
Descriptive analysis of students’ answer improvement is used to
Rizky Nur Lestari, 2015
required to use statistical procedure, so that the data processed
descriptively by analyzing the changing of each students’ answer from pretest to posttest in order to see the improvement of the students’ cognitive. Thus there are three criteria of students’ answer analyzing.
Criteria:
+ : There’s improvement in student answer, student change the answer from pretest to posttest into the correct answer
* : Students keep on answering the correct answer from pretest to posttest
- : There’s no improvement at all, student answer the wrong answer
Students that experienced the improvement (students change the answer from wrong answer to correct one) in answering pretest to posttest will given plus sign (+), students that keeping the correct answer from pretest to posttest will be given star sign (*) and students that experienced no improvement which means students keep answer the wrong answer from pretest to posttest will be given minus sign (-). The way to calculate
those criteria is that the amount of those signs in each student’s answer
analysis divided by the total amount of the questions. The formula to calculate the sign will be given below.
+% =
x 100%
Another formula to calculate the percentage of students’ that keeping the
correct answer from pretest to posttest will be explain below
*% =
Rizky Nur Lestari, 2015
The last formula to calculate the percentage of students’ that no
improvement from pretest to posttest will be explain below
-% =
x 100%
2. Students’ Questionnaire
The questionnaire interpreted to know how students’ response
toward learning global warming by using peer led team learning method. The data was processed from the raw score to the percentage. It calculated based on each response and indicator of students. The formula that used to processed the data as follow:
P = x 100%
Where:
P : Percentage
f : score from frequency of the answer n : score from total response
(Sugiyono, 2008)
The questionnaire result was obtained based on the real situation that respond by the students right after learning through peer led team learning method in order to know the weakness of this learning method.
L. Research Procedure
Rizky Nur Lestari, 2015
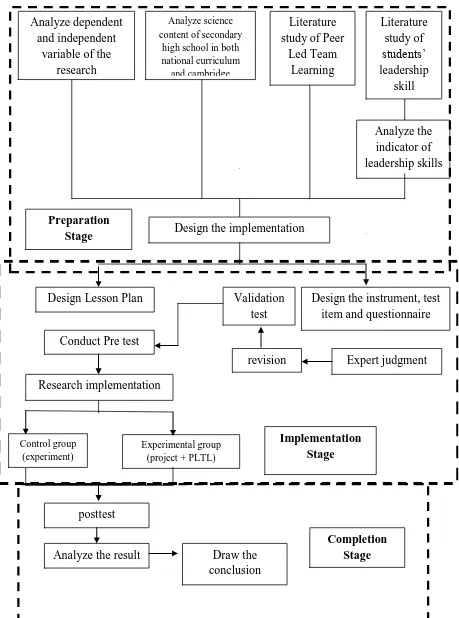
1. Preparation Stage
In this step, researcher focus on determining the variable that will be use to conduct the research, prepare the information in order to support the research, the steps in preparation stage are:
a. Determine the independent and dependent variable of research b. Analyze the science content of secondary school
c. Literature study of peer led team learning d. Literature study of students’ leadership skills e. Analyze the indicators of students’ leadership skills f. Design the implementation
g. Designing the lesson plan, including teaching sequences and method to teach
h. Designing the instruments as tools to collect data (pretest-post test
in form of test item, and questionnaire of students’ impression and students’ leadership skills
i. Revise the instrument after having suggestion by the experts
2. Implementation Stage
This stage is the stage where researcher implement the peer led team learning then collect the data of the research. Here are the steps of implementation stage:
a. Determine the experimental class
b. Give pretest to the experimental class in order to know students’ prior knowledge
c. Collect pre test result
d. Implement peer led team learning in learning global warming e. Give post test to the class to see the changing of the result
Rizky Nur Lestari, 2015
3. Completion Stage
Completion stage is the final stage of this research the steps that should be done in this research are:
a. Collect the data based on the result of objective test and questionnaire
b. Analyze and discuss the result
c. Conclude the result based on result analysis
M.Research Scheme
Rizky Nur Lestari, 2015