International Review of Economics and Finance 8 (1999) 165–182
DEA efficiency profiles of U.S. banks
operating internationally
John A. Haslem
a,*, Carl A. Scheraga
b, James P. Bedingfield
c aDepartment of Finance, College of Business and Management, University of Maryland,College Park, MD 20742, USA
bSchool of Business, Fairfield University, Fairfield, CT 06430, USA
cDepartment of Accounting, College of Business and Management, University of Maryland,
College Park, MD 20742, USA
Received 28 January 1997; accepted 30 December 1997
Abstract
Data envelopment analysis (DEA) was used to analyze the 1987 and 1992 input/output efficiency of U.S. banks operating internationally. In 1987, banks belatedly began to acknowl-edge with huge writeoffs the crisis in lending to less-developed countries (LDCs). Some 20% of the banks were identified as inefficient in each year, and approximately 50-60% of the total inputs/outputs of inefficient banks were excessive/deficient, with inputs proportionately more so than outputs. In 1987, the herd instinct that had led to the LDC loan crisis caused DEA’s empirical “best practice” production frontier to identify as efficient banks that were financial “bad practice” banks. However, by 1992, normalcy had returned and DEA best practice banks were also financial good practice banks. Overall, it was found that management should focus on overall efficiency, but with particular attention to inputs, especially cash and real capital, and to foreign loans among the outputs. 1999 Elsevier Science Inc. All rights reserved.
Keywords:DEA; U.S. banks; Efficiency; International; Input/output
1. Introduction
This study investigates the input/output efficiency of large U.S. banks that engaged in both domestic and foreign operations during a particularly dynamic and difficult period. Since 1980, banks have been subjected to various forces that have significantly changed the nature of the industry and its competitive environment. These include legislative and regulatory changes, institutional changes, increased globalization and macro/local/regional economic events.1
* Corresponding author. Tel.: 301-405-2236; fax: 301-405-0359.
E-mail address: [email protected] (J.A. Haslem)
In addition to these exogenous factors, management behaviors were also extremely important. For example, Park (1994) found that some managers contributed to in-creased bank risk by adopting high variance strategies.2These actions, especially in banks with inadequate cost controls and poor investment choices, had adverse results that contributed to bank inefficiency.
Graham and Horner (1988) also detailed the importance of management to bank performance. They found that internal factors greatly influenced the degree to which adverse external conditions harmed banks, with management and the board of direc-tors the ultimate determinants of bank success or failure.3 The Economist (1990) surveyed the world of international banking and noted that the 1980s “did not add up to the best of times for America’s commercial banks.” Further, “efficiency and profitability, not size, became the holy grail; but for many banks it remained elusive.”4 In particular, 1987 was terrible year for large U.S. banks. This was due to the increasingly severe problems with LDC loans, especially in Latin America, that banks belatedly began to acknowledge in a significant way on their financial statements. The year was characterized by huge increases in loan-loss provisions, which, of course, greatly impacted reported financial performance.5
The elusiveness of bank efficiency during the 1980s and its implications for profitabil-ity performance provided the motivation for this study.6 Specifically, the objective was to analyze the 1987 and 1992 efficiency of large U.S. banks for purposes of: (1) identifying inefficient banks; (2) determining and profiling the input/output variables associated with inefficiency; and (3) profiling and summarizing the financial perfor-mance of efficient and inefficient banks.
As reviewed in Evanoff and Israilevich (1991), earlier production theory recognized two basic types of bank inefficiency: output inefficiency, which represents suboptimal and/or deficient output production; and input inefficiency, which represents excess inputs and/or suboptimal input mixes for a given levels of output.7
The story that emerged from the study was that efficiency was a major problem. First, some 20% of the sample of large U.S. banks were identified as inefficient in 1987 and in 1992. Second, some 50–60% of the total inputs/outputs of inefficient banks were excessive/deficient, with inputs proportionately more inefficient than outputs. Third, management should focus on overall efficiency, but with particular attention to inputs, especially excess cash and real capital, and foreign loans among the outputs. Fourth, in 1987, the herd instinct that had led to the LDC loan crisis caused the methodology to find foreign loans as positive contributors to efficiency and incorrectly identified efficient and inefficient banks, when measured by financial performance. Fifth, by 1992, banking had normalized and foreign activities were again profitable, and inefficient banks were deficient in foreign loans. Sixth, in 1992, efficient banks were more profitable than inefficient banks across all measures—overall, foreign and domestic.
2. Methodology and model
sector organizations, such as schools, hospitals, prisons and military operations, but more recently it has been applied to banks.8
The theory, development and applications of DEA, as well as its strengths and weaknesses, have been detailed elsewhere and are beyond this paper’s empirical scope.9 Nonetheless, a brief review may be helpful. DEA was originally developed for use in service organizations, where the form of the production function is unknown or perhaps not even considered. DEA has the advantage of being a flexible, nonpara-metric technique that makes no assumptions about the form of the production function. Instead, it estimates an empirical “best practice production frontier” from the observed inputs/outputs of individual decision-making units (DMUs), which replicates their individual behavior rather than the average sample estimate of conventional produc-tion funcproduc-tions. A DMU is found to be “efficient” when comparisons with other units indicate no inefficiency in the utilization of inputs/outputs, as measured by its position relative to the efficient frontier. The DEA best practice frontier is generally piecewise linear and approximates the true production function. DEA is so-named because the data from the best practice DMUs generate the production frontier and thereby “envelop” the data from the other DMUs.10Since its origins, the term DEA has been broadened as additional models for enhancing its advantages in measuring input/ output efficiency have been developed.11
The Integrated Data Envelopment System (IDEAS) was used to analyze bank efficiency.12The model selected was specified as: (1) variable returns to scale (VRS), rather than constant returns to scale (CRS); (2) “base” (“nonoriented,” equal) treat-ment of inputs/outputs in the determination of any output “slack” and/or input excess inefficiency, rather than input or output orientation; and (3) “units invariant” measure-ment of efficiency/inefficiency (i.e., efficiency scores are independent of units of mea-surement), rather than “standard” measurement of DMU variables.13Consistent with the base assumption, the input/output variables were treated as under management’s simultaneous and discretionary control. In sum, choice of model specifications was guided by the scale economies, managerial/institutional characteristics, and environ-ment of the sample banks (e.g., the input/output correspondence in asset/liability management).
The distance measure delta was the primary criterion used to measure bank total efficiency. Delta was optimized to minimize each bank’s total input/output waste, as measured by the weighted aggregation of the differences between each bank’s observed input/output points and those projected on the envelopment surface. If the delta score was zero, the bank was identified as efficient, and its observed and the projected points were the same. If the score was greater than zero, the bank was identified as inefficient, and its observed and the projected points differed.
Thus, using the base model specified in Ali and Seiford (1993), consider the case ofnbanks, each utilizing, in varying amounts,mdistinct balance sheet inputs in order to produce s different balance sheet outputs. This model is specified to minimize “total waste” and is represented mathematically as Eq. (1):
The variablesris the amount of slack (foregone) balance sheet outputr, while the
variable eiis the amount of excess balance sheet input iutilized. The values mrl and
nilare shadow prices, or the marginal value of a unit of output or input. The analysis
specifies bank specific bounds on the values ofmrland nildefined by Eq. (2):
mrl 5
1 yrl
, r5 1, . . . ,s with nil 5
1 xil
, i 51, . . . ,m (2)
This procedure allows the projections and efficiency scores derived to be indepen-dent (units invariant) of the units of measurement for the data. This is a linear programming problem with associated resource constraints and convexity conditions (as discussed in Ali & Seiford [1993]).
The solution to the above problem identifies, for each bank,l, a projected point on the efficient frontier, (xˆl,yˆl) where the itemsxand yare the vectors of inputs and
outputs. The particular form of the model allows for variable returns to scale. The essence of the efficiency evaluation of a particular bank (with an actual achieved combination ofxlandyl) is the identification of excesses in input utilization (xl2xˆl)
and deficiencies in output (yˆl2yl). A particular bank is deemed efficient if (xl,yl)5
(xˆl, yˆl), the bank thus lying on the efficient frontier. Thus, one possible measure of
inefficiency, delta or Dl, can be defined by Eq. (3):
Dl 5 ml(yˆ
l2 yl) 1 nl(xl2xˆl) (3)
Notice, that for efficient banksDl5 0.
As noted above, the base model was derived. This model embodies an approach consistent with the “systems-oriented” philosophy in banking where input and output variables are simultaneously managed and determined.
Two other oriented efficiency measures were used in the IDEAS model to provide supplemental information on bank efficiency: iota and omicron. Any one of the three noted criteria could have been used to identify inefficient banks, but the interpretation of inefficiency appropriately followed the primary criterion, delta. Iota and omicron measured bank efficiency in terms of proportional variable change.14
3. Input/Output variables
The intermediation approach to defining bank output was used to specify the input/ output variables, where banks are considered intermediators of financial services rather than producers of service accounts and transactions.15
The variables that were used are defined in Appendix A, where they are classified as: (1) outputs, including domestic loans, foreign loans, total investments and noninterest bearing deposits; and (2) inputs, including cash, labor expense, real capital, materials expense and total borrowed funds. The variables reflected the need to include foreign and domestic loans independently and to minimize the number of variables in the analysis (see Note11).
4. Sample construction
The data and definitions of the defined input/output variables (Appendix A) were obtained from Federal Reserve (1987, 1992), specifically the Federal Financial Institu-tions Examination Council Form 031 reports of condition and income.16 Form 031 was filed by all banks approved to operate both foreign and domestic offices. Further, each sample bank was required to satisfy criteria that ensured it was substantively engaged in foreign banking.17
These criteria generated a first 1987 sample of 62 banks (from 256) and a first 1992 sample of 53 banks (from 218). The banks had total assets that ranged from $45.8– $163.8 billion, and were thus much larger than those in the usual study of bank scale economies.
Fortunately, Shaffer and David (1991) had earlier estimated cost functions for the 100 largest banks. They found their efficient scale continued well into the multibillion-dollar range of total assets, rather than the typical small bank sample estimate of less than $100 million. They used hedonic cost functions to adjust for the differences in these large, complex organizations.18 The model that included the variable business loans to total loans indicated that scale economies existed up to total assets of $37.2 billion. This model specification was most consistent with that used in the current study, which included both domestic and foreign loans. Thus, to ensure that all sample banks had variable returns to scale, those with total assets greater than $37.2 billion were deleted from the 1987 and 1992 samples. This upper bound generated a second 1987 sample of 54 banks (from 62) and a second 1992 sample of 47 banks (from 53). The second samples were also reduced in order to profile and summarize the input/ output efficiency of the banks that were efficient in 1987 and 1992 and inefficient in 1987, 1992, or both years. This required that each sample bank had operated in both years as the same legal entity, as identified by its charter number. These further reductions resulted in final 1987 and 1992 samples of the same 33 banks.
This sample size was large enough to obtain reliable DEA results. This methodology differs from regression where the significance of the estimated equation’s explanatory power is related to its degrees of freedom. More importantly, the sample size satisfied the heuristic set down by Charnes et al. [cited in Charnes, Cooper, Lewin & Seiford (1994)] that the number of DMUs should exceed the number of inputs/outputs by a ratio of at least three to one, respectively.
here because the sample was truncated to ensure the banks shared the same form of production function. This resulted in a sample where, if anything, it was more difficult to be incorrectly identified as efficient. This was not to say, for example, that the mix of activities represented by bank inputs/outputs did not differ. After all, it was these input/output differences that were identified by DEA and provided the basis for normative guides to improved bank efficiency.
Another issue concerned the nonhomogeneity of the sample as measured by foreign/ domestic ownership of the banks (Table 1). There was no a priori reason to believe that this implied a difference in their underlying production function. Nonetheless, this issue was examined empirically and the findings are discussed below.
The year 1987 was selected because, as discussed above, this was the first year the unfolding LDC loan crisis was significantly recognized on bank financial statements. And 1992 was selected as the “current” situation for purposes of analyzing bank efficiency. It was the latest year for which computer-ready data were available at the time of the analysis.
5. Results of analysis
The application of DEA to each year’s final sample of 33 banks identified six (18.2%) banks as inefficient in 1987 and seven (21.2%) such banks in 1992. These and the identified efficient sample banks are presented in Table 1. The thirteen total observations of inefficient banks included ten individual banks, of which seven were inefficient in one year or the other and three were inefficient in both years.
Table 2 profiles the input/output variables of each of the six banks that were inefficient in 1987. The data were analyzed separately for each of the years 1987 and 1992 because the time frame of the study was inappropriate for pooling the data.19 All six banks were identified as inefficient by delta, iota, and omicron. For example, Bank Leumi (Bank 1) would somehow have had to decrease proportionately its inputs by 16% (1.0–0.84) to have been input efficient, and similarly increase its outputs by 19% (1.19 21.0) to have been output efficient.20
Overall, 64.8% of the total number of inputs/outputs (54) were inefficient, including 54.2% of the outputs and 73.3% of the inputs. It was found that management should have focused on overall efficiency, but with particular attention to input variables, especially cash and real capital, and to foreign loans among the outputs.
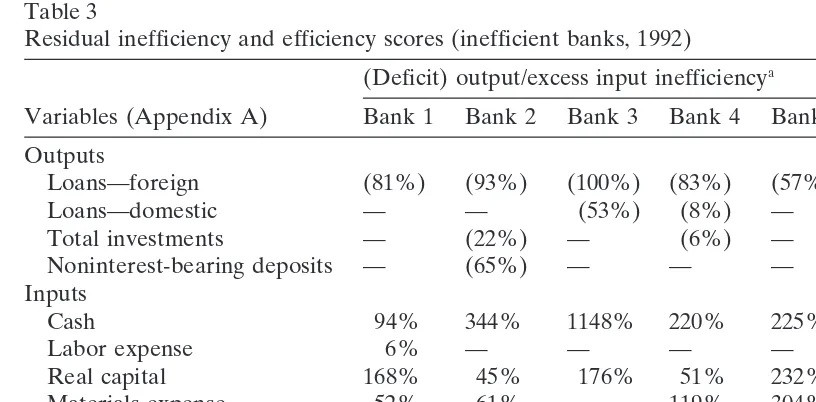
Table 3 profiles the input/output variables of each of the seven banks that were inefficient in 1992. All seven banks were identified as inefficient by delta, iota, and omicron. For example, Bank Leumi (Bank 1) would somehow have had to decrease proportionately its inputs by 38% (1.0 2 0.62) to have been input efficient, and similarly increased its outputs by 48% (1.482 1.0) to have been output efficient.21
Overall, 54.0% of the total inputs/outputs (63) were inefficient, including 46.4% of the outputs and 60.0% of the inputs. Again, it was found that management should have focused on overall efficiency, but here with particular attention to input variables (especially cash and real capital) and foreign loans among the outputs.
Table 1
Efficient and inefficient banks (1987 and 1992 samples)
Inefficient in Efficient in
Institution 1987 and 1992 1987 1992
Bank of New York X
Banco Central Hispano-USAa X
Bank of Canton of Californiaa X
Bank of Hawaii X
Bank of Tokyo Trust Companya X
Banco de Bogota Trust Companya X
Bank of California NAa X
Continental Bank NA X
Corestates Bank NA X
Daiwa Bank Trust Companya X
First National Bank of Boston X
First National Bank of Chicago X
FUJI Bank & Trust Companya X
Habib American Banka X
Harris Trust & Savings Banka X
IBJ Schroder Bank & Trust Companya X
Morgan Bank Delaware X
Oceanic Banka X
Pacific National Banka X
Republic National Bank of NYa X
State Street Bank & Trust Company X
UBAF Arab American Banka X
Yasuda Bank & Trust Company USAa X
Bank Audi USAa X
Bankers Trust Delaware X
Bank Leumi Trust Company of NYa X X
California American Banka X
Chinese American Banka X X
Industrial Bank of Japan Trust Companya X
Israel Discount Bank of New Yorka X
Northern Trust Companya X
Riggs National Bank of Washingtona X X
UMB Bank & Trust Companya X
aminimum of 50% foreign ownership.
1992: Bank Leumi Trust, Chinese American Bank, and Riggs National Bank. For example, in both years Bank Leumi was deficient in foreign loans and had excess cash, labor expense and real capital. Over the period, it became efficient in total investments, but developed excess materials expense.
Table 2
Residual inefficiency and efficiency scores (inefficient banks, 1987)
(Deficit) output/excess input inefficiencya
Variables (Appendix A) Bank 1 Bank 2 Bank 3 Bank 4 Bank 5 Bank 6 Outputs
Loans—foreign (63%) (23%) (66%) (49%) (72%) (92%)
Loans—domestic — — (17%) (91%) (5%) —
Total investments (23%) (56%) — — — —
Noninterest-bearing deposits — (24%) — — — (30%)
Inputs
Cash 96% 29% 565% 152% 72% 108%
Labor expense 12% 22% 204% 51% — 26%
Real capital 46% 7% 88% 197% 44% 17%
Materials expense — 4% 3% — 2% 22%
Total borrowed funds — — 83% — — —
Efficiency scores
Iota (1.05efficient) 0.84 0.24 0.08 0.44 0.34 0.65
Omicron (1.05efficient) 1.19 2.65 3.32 2.41 2.15 1.55
Delta (0.05efficient) 2.91 2.42 4.58 12.42 3.32 12.26
Bank 15Bank Leumi Trust Co. of NY; Bank 25Industrial Bank of Japan Trust Co.; Bank 35 Israel Discount Bank of NY; Bank 45 Chinese American Bank; Bank 55 Riggs National Bank of Washington; Bank 65California Commerce Bank.
aOutput inefficiency represents deficit outputs and input efficiency represents excess inputs; none of
the inefficiency is proportional. To calculate residual inefficiency: (1) subtract actual data value for each variable from its efficient frontier value, which equals “amounts of residual inefficiency” (stated in absolute terms); and (2) divide this amount by the efficient value, which equals “residual inefficiency” (stated as percentage). These percentages are provided to enrich each bank’s presentation. They are not standardized for interyear comparisons and are, therefore, not discussed in the text.
focused on overall efficiency, but here with particular attention to input variables, especially real capital, and to foreign loans among the outputs.
Also as derived from Tables 2 and 3, three banks were inefficient in 1987 only (efficient in 1992): Industrial Bank of Japan, Israel Discount Bank, and California Commerce Bank. For example, in 1987 Industrial Bank of Japan was deficient in foreign loans, total investments and noninterest-bearing deposits, and had excess cash, labor expense, real capital and materials expense. Between 1987 and 1992, it went from being inefficient in seven of nine inputs/outputs to efficient in all variables.
These three banks had some pattern of change in their input/output variables and, overall, thirteen of the twenty changes were inputs and seven were outputs.23In 1992, newly efficient management correctly focused on overall efficiency, but also gave particular attention to input variables, especially cash, labor expense, real capital and materials expense, and to foreign loans among the outputs.
Table 3
Residual inefficiency and efficiency scores (inefficient banks, 1992) (Deficit) output/excess input inefficiencya
Variables (Appendix A) Bank 1 Bank 2 Bank 3 Bank 4 Bank 5 Bank 6 Bank 7 Outputs
Loans—foreign (81%) (93%) (100%) (83%) (57%) (66%) (84%)
Loans—domestic — — (53%) (8%) — — —
Total investments — (22%) — (6%) — — (3%)
Noninterest-bearing deposits — (65%) — — — — —
Inputs
Cash 94% 344% 1148% 220% 225% — 9%
Labor expense 6% — — — — 15% 19%
Real capital 168% 45% 176% 51% 232% 251% —
Materials expense 52% 61% — 119% 304% 142% —
Total borrowed funds — — 174% — — — —
Efficiency scores
Iota (1.05efficient) 0.62 0.40 0.93 0.55 0.88 0.81 0.65
Omicron (1.05efficient) 1.48 2.79 1.08 1.97 1.13 1.22 1.49
Delta (0.05efficient) 5.90 16.72 .99.00 6.61 3.49 3.34 5.38 Bank 15Bank Leumi Trust Co. of NY; Bank 25Bank Audi USA; Bank 35Chinese American Bank; Bank 45UMB Bank & Trust Co.; Bank 55Bankers Trust Delaware; Bank 65Riggs National Bank of Washington; Bank 75Northern Trust Co.
aSee Table 2 notes for calculations and comments.
cash, real capital and materials expense. Between 1987 and 1992, it went from being efficient in all variables to inefficient in six of nine inputs/outputs.
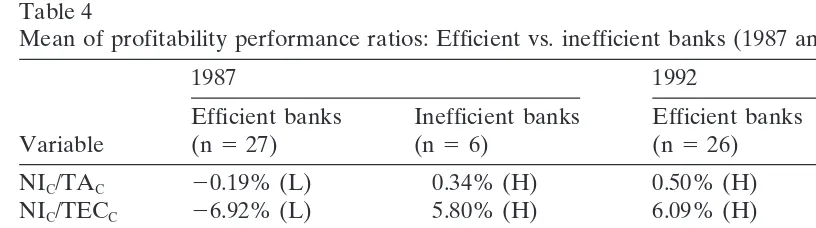
These four banks had some pattern of change in their input/output variables and, overall, eleven of the twenty changes were inputs and nine were outputs.24 In 1992, newly inefficient management should have focused on overall efficiency, with particu-lar attention to input variables, especially cash, and to foreign loans among the outputs. As noted in Table 2 and above, 1987 DEA-identified inefficient banks were deficient in foreign loans, which was inconsistent with the huge LDC loan losses in that year. Further, as seen in Table 4, identified inefficient banks had higher returns than efficient banks in five of six profitability measures: consolidated net income to consolidated total assets, consolidated net income to total equity capital, foreign net income to consolidated total assets, foreign net income to foreign total assets, domestic net income to domestic total assets, but not domestic net income to consolidated total assets. With the exception of foreign net income to foreign total assets, all of their returns were positive. Further, the returns on domestic activities were higher than on foreign activities.
Table 4
Mean of profitability performance ratios: Efficient vs. inefficient banks (1987 and 1992 samples)
1987 1992
Efficient banks Inefficient banks Efficient banks Inefficient banks
Variable (n527) (n56) (n526) (n57)
NIC/TAC 20.19% (L) 0.34% (H) 0.50% (H) 0.11% (L)
NIC/TECC 26.92% (L) 5.80% (H) 6.09% (H) 20.26% (L)
NIF/TAC 20.53% (L) 0.04% (H) 0.30% (H) 0.10% (L)
NID/TAC 0.34% (H) 0.30% (L) 0.21% (H) 0.01% (L)
NIF/TAF 22.21% (L) 20.13% (H) 1.13% (H) 0.21% (L)
NID/TAD 0.44% (L) 0.52% (H) 0.25% (H) 0.08% (L)
Variables are defined in Appendix A. H5highest variable value: efficient vs. inefficient banks, same year; L5lowest variable value: efficient vs. inefficient banks, same year.
as three of the other four profitability measures, contradicted the positive focus on foreign loans in DEA-efficient banks.
A related issue, mentioned above, concerned whether there was a difference in efficiency of foreign versus domestic-owned banks. As seen in Table 1, fifteen of the twenty-three banks that were efficient in both 1987 and 1992 were at least 50% foreign owned, as were seven of the ten banks that were inefficient in either or both 1987 and 1992. Chi-square was used to test this question empirically.25 The results were most consistent and found no significant difference in the input/output efficiency of these foreign and domestic-owned banks. These results were also consistent with Haslem, Scheraga and Bedingfield (1993), where no differences were found in the the balance sheet strategies of foreign and domestic-owned U.S. banks.
6. Interpretation of findings
The contradiction in 1987 between indentified efficient banks and their low profit-ability performance was due to the methodology. Because of the pervasiveness of LDC loans, the empirically-based DEA recognized this overriding emphasis as “best practice.” What led to this, of course, was something akin to herd behavior—where one bank after another had entered the LDC loan market in a significant way. As discussed above, DEA’s best practice production frontier was estimated from the observed inputs/outputs of the sample banks. The inputs/outputs of identified efficient banks defined the efficient frontier and enveloped those of inefficient banks. That is, in 1987, DEA identified the LDC herd mentality as a positive contributor to bank efficiency and defined the efficient frontier based on the inputs/outputs of these problem-loan banks.
identified by measuring DMU performance to validate results and by knowledge of the managerial/institutional characteristics of the DMUs and the exogenous factors impacting them. In this way, DEA results can be adjusted as needed to provide the correct interpretation of DMU efficiency.
By 1992, banking had normalized and DEA-identified best practice banks were also financial good practice banks. These results were consistent with the endogenous and exdogenous aspects of banking at that time. Efficient banks had higher returns on all six profitability measures than inefficient banks, and all of their returns were positive. Also, their returns on foreign activities were higher than on domestic activities. On the other hand, inefficient banks had positive returns on five of six measures, excluding consolidated net income to total equity capital. Also, their returns on foreign activities were higher than on domestic activities. Thus, in 1992 both efficient and inefficient banks had positive returns on foreign activities, although they were higher for efficient banks. The fact that efficient banks had higher returns on all measures was, with one exception, a complete reversal from 1987.
In conclusion, the prescription for the improved input/output efficiency of banks may be summarized as follows: Management should always focus on overall efficiency, but with particular attention to input variables—especially cash and real capital—and to foreign loans among the outputs. Further, when efficiency is in a state of flux, for better or worse, management should be alert to both foreign loan outputs and cash inputs.
Appendix A: Variable definitions
Input variables
Cash
This item is RCFD 0010 (“Cash and balances due from depository institutions”).
Labor expense
This item is RIAD 4135 (“Salaries and employee benefits”).
Real capital.
This item is the total of RCFD 2145 (“Premises and fixed assets [including capitalized leases]”) and RCFD 2150 (“Other real estate owned”).
Materials expense
This item is RIAD 4092 (“Other noninterest expense”).
Total borrowed funds.
Output variables
Loans to foreign borrowers
This item is the total of RCFD 1516 (“Loans to other banks in foreign countries”), RCFD 1764 (“Commercial and industrial loans to non-U.S. addressees”), RCFD 1757 (“Acceptances of foreign banks”), RCFD 2081 (“Loans to foreign governments and official institutions”), and RCFD 2183 (“Lease financing receivables [net of unearned income] of non-U.S. addressees”).
Loans to domestic borrowers
This item is RCFD 2122 (“Total loans and leases, net of unearned income”) less “Loans to Foreign Borrowers” (defined immediately above).
Total investments
This item is the total of RCFD 0390 (“Total investment securities”), RCFD 2146 (“Assets held in trading accounts”), RCFD 1350 (“Federal funds sold and securities purchased under agreements to resell”) and RCFD 2130 (“Investments in unconsoli-dated subsidiaries and associated companies”).
Noninterest-bearing deposits
This item is RCFD 6631 (“Deposits—noninterest bearing”).
Performance variables
Return on assets for the consolidated bank (NIC/TAC)
NIC(RIAD 4340, “Net income”) is divided by TAC(RCFD 2170, “Total assets”).
Return on capital for the consolidated bank (NIC/TECC)
NIC(RIAD 4340, “Net income”) is divided by TECC (RCFD 3210, “Total equity capital”).
Total equity capital ratio for the consolidated bank (TECC/TAC)
TECC(RCFD 3210, “Total equity capital”) is divided by TAC(RCFD 2170, “Total assets”).
Mean and standard deviation for TAC
(RCFD 2170, “Total assets”).
Return on total assets for foreign operations (NIF/TAC)
NIF(RIAD 4341, “Net income attributable to international business”) is divided by TAC(RCFD 2170, “Total assets”).
Return on total assets for domestic operations (NID/TAC)
NIC(RIAD 4340, “Net income”) less NIF(RIAD 4341, “Net income attributable to international business”) is divided by TAC(RCFD 2170, “Total assets”).
Return on foreign assets for foreign operations (NIF/TAF)
Return on domestic assets for domestic operations (NID/TAD)
NIC(RIAD 4340, “Net income”), less NIF(RIAD 4341, “Net income attributable to international business”) is divided by TAD(RCON 2170, “Total assets” for domestic offices).
Acknowledgments
The assistance at the University of Maryland of Katherine Lewis and support of the Computer Science Center and College of Business and Management Office of Technology Resources is acknowledged.
Notes
1. Legislative and regulatory changes have eased these constraints and intensified competition among banks as well as between banks and other financial institu-tions. Institutional changes, primarily in the growth of substitutes for banking services, have placed additional competitive burdens on banks. Increased global-ization of commerce and financial markets has provided greater opportunities for banks, but at the cost of a more competitive and risky environment. The LDC loan crisis was a costly example of this risk.
2. The adoption of these strategies could have been caused by errors in judgment and/or incentives for increased risk taking motivated by shareholder limited liability and deposit insurance. In other cases, managers faced with increased competition and deteriorating earnings took additional risks in hope that fortu-itous events would improve earnings and save their jobs.
3. Banks that remained healthy had strong internal policies, systems, and controls that ameliorated the impact of depressed economic conditions. The authors also detailed the characteristics of banks that were (1) deficient in knowledge, information or attentiveness, (2) overly aggressive or growth minded, and (3) lacked strong CEOs with experience, capability and integrity.
4. Annual net profits were only slightly higher at the end of the decade than the be-ginning. Even worse, by 1987, bank return on equity had fallen to a nominal 2%. 5. Net loan and lease charge-offs losses increased each year beginning in 1979 for all insured commercial banks. The 1991 net charge-offs were nearly thirteen times those in 1979. Thus, the 1980s were challenging years for large banks. 6. The motivation for this study in the search for efficiency follows Haslem,
Scheraga, and Bedingfield (1996). These papers differ in their research objec-tives, but they do share a common literature, input/output variables and defini-tions, methodology and model choices, and preliminary (but not final) sample selections.
7. For reviews of the traditional literature on bank costs and outputs, see Clark (1984); Mester (1987); and Gilbert (1984).
Pa-surka, and Rangan (1990); Elyasiani and Mehdian (1990); Evanhoff and Israile-vich (1991); Charnes, Cooper, Huang, and Sun (1990); Parkan (1987); Rangan, Grabowski, Aly, and Pasurka (1988); Sherman and Gold (1985); Yue (1992); and Ferrier and Lovell (1990). Mester (1987) discusses its disadvantages in this regard.
9. See Ganley and Cubbin (1992) for an extensive DEA bibliography and thorough introduction, including the mathematics, detailed applications with interpreta-tion of results, and appraisals of the technique. Also, see Norman and Stoker (1991) for a thorough treatment and application of DEA, and Seiford and Thrall (1990) for developments in DEA. Further, see Charnes, Cooper, Lewin, and Seiford (1994) for a particularly useful treatment and extensive bibliography of DEA. Chapter 1 presents an excellent, concise discussion of DEA and its development. DEA and its applications are also treated usefully and extensively in Fried, Lovell, and Schmidt (1993).
10. These models were developed further in such papers as Charnes, Cooper, and Schinnar (1982); Fare, Grosskopf and Lovell (1983, 1985); Banker (1984); Banker, Charnes, and Cooper (1984); and Banker and Thrall (1989).
11. The use of DEA should not be interpreted to imply that it is without shortcom-ings. As discussed in Ganley and Cubbin (1992), and elsewhere, these include: (1) no allowance for noise in the data; (2) no inclusion of variable selection criteria; (3) limited to static, one-period evaluation (panel data provide contin-uum of static results); and (4) unit efficiency scores follow an upward trend as the number of variables increase.
12. IDEAS is a flexible DEA applications model that allows specification of model appropriate for the task at hand. The technical discussion of IDEAS in One Consulting (1995) has been reviewed and interpreted in Scheraga (1995), which includes references to related working papers by A.I. Ali. These ideas are also usefully presented in Ali and Seiford (1993) and Lovell (1993). These sources guide the discussion of DEA that follows.
13. A VRS envelopment surface was specified because it was determined that the sample banks had increasing returns to scale (discussed in the text that follows). The VRS surface results from the convexity constraint on the envelopment surface of the additive model, which treats inputs/outputs as additive rather than multiplicative combinations. The VRS model derives from Banker, Charnes, and Cooper (1984); see also Charnes, Cooper, Golaney, Seiford, and Stutz (1985). A nonoriented (base) model was specified because its overall focus is consis-tent with banks, which are complex systems where efficiency is affected by interactive/simultaneous input/output decisions. In this model, the slack output and excess input variables account for total inefficiency. On the other hand, oriented models give priority either to input or output variables and focus primar-ily on proportional input/output changes to achieve efficiency. Input models focus primarily on proportional input reduction, while output models focus primarily on proportional output augmentation to achieve DMU efficiency.
addi-tional flexibility to select an evaluation base determined by it own unique input/ output mix. This is desirable because each bank has some unique dimension within the general bank construct. The optimal objective function values for inefficient DMUs in the additive model are dependent on the measurement units. A condition of this model’s convexity constraint is translation invariance of the envelopment surface. As a result, the classification of DMUs as efficient/ inefficient is invariate with respect to an affine translation of the data. The model produces dimensionless DMU efficiency scores and projections to the efficient frontier that are invariant to the data’s expressed units. It assumes the marginal values on nonzero output slack and excess input variables differ, where the value of each is measured with respect to its level. This model thus distinguishes the relative value of inputs/outputs for each DMU, as well as across DMUs. This contrasts with the standard model where the marginal value of each output slack and excess input is constrained as zero. The units-invariant model derives from the extended additive model in Charnes, Cooper, Rousseau, and Semple (1987). See Ali and Seiford (1993) and (1990) for treatment of translation invariance of the envelopment surface.
14. In oriented-model terms, the discrepancy between observed and projected input/ output points of inefficient DMUs can be caused either by the need for propor-tional input reduction or output augmentation, and either by the need for residual (nonproportional) input reduction or output augmentation. This con-trasts with nonoriented models where delta measures inefficiency in total resid-ual terms, with inefficiency explained by output slack or excess input variables (see Note 13).
In the IDEAS model, an input efficient bank was identified by an iota score of one, while an input inefficient bank had a score less than one. This latter score indicated by what proportion inputs would have had to been reduced to achieve input efficiency. An output efficient bank was identified by an omicron score of one, while an output inefficient bank had a score greater than one. This latter score indicated by what proportion outputs would have had to been increased to achieve output efficiency.
15. As described in Mester (1987), “financial intermediation” involves the “bor-rowing” and subsequent “lending” of funds. Bank outputs were measured by the dollar value of various earning assets, and inputs by the dollar value of borrowed funds, capital, labor and materials.
16. Form 031 reports of condition as of December 31, 1987 and December 31, 1992, and the reports of income for the years then ended were used.
17. The criteria required that for each bank: (1) domestic office assets were less than or equal to 90% of total assets; (2) foreign office loans were equal to or greater than 10% of total loans, and/or (3) foreign office deposits were equal to or greater than 10% of total deposits.
asset mix, and average loan size. The hedonic terms were estimated individually and simultaneously.
19. DEA frequently uses pooled samples ofn-years of consecutive data (“panel” analysis) to determine whether DMUs are becoming more/less efficient relative to an “averaged” frontier. This approach implicitly assumes that the data, and therefore the efficient frontier, have not been subjected to significant external/ internal change factors, for example, technology advances. This assumption is not tenable in this study due to the large number of years between samples in what was a very volatile period for banks.
20. As discussed in the text below, all six banks had deficient foreign loans, and excess cash and real capital. Five of these banks had excess labor expense. 21. All seven banks had deficient foreign loans, and six of them had excess cash
and real capital. Also, four of these banks had excess materials expense. 22. There were three incidences of deficient foreign loans, one of deficient domestic
loans, three of excess real capital, two of excess cash, and one of each of excess labor expense and materials expense.
23. Of the seven incidences of output variables that became efficient, three were foreign loans, two were noninterest-bearing deposits, and one each were domes-tic loans and total investments. Of the thirteen incidences of input variables that became efficient, there were three each of cash, labor expense, real capital and materials expense, and one of total borrowed funds.
24. Of the nine incidences of outputs that became deficient, four were foreign loans, three were total investments, and one each were domestic loans and noninterest-bearing deposits. Of the eleven incidences of inputs that became excess, four were cash, three each were real capital and materials expense, and one was labor expense.
25. The analysis was conducted on three groups of sample banks—those that were efficient/inefficient in 1987, 1992 and 1987 and 1992.
References
Ali, A. I., & Seiford, L. M. (1993). The mathematical programming approach to efficiency analysis. In H. O. Fried, C. A. K. Lovell, & S. S. Schmidt (Eds.),The Measurement of Productive Efficiency:
Theory and Applications(pp. 120–160). New York: Oxford University Press.
Ali, A. I., & Seiford, L. M. (1990). Translation invariance in data envelopment analysis.Operations Research Letters 9, 403–405.
Aly, Y., Grabowski, R., Pasurka, C., & Rangan, N. (1990). Technical, scale, and allocative efficiencies in U.S. banking: An empirical investigation.Review of Economics and Statistics 72, 211–218. A survey of international banking. (1990).The Economist, April 7.
Banker, R. (1984). Estimating most productive scale size using data envelopment analysis.European Journal of Operational Research 17, 35–44.
Banker, R., Charnes, A., & Cooper, W. W. (1984). Some models for estimating technical and scale inefficiencies in data envelopment analysis.Management Science 30, 1078–1092.
Banker, R., & Thrall, R. (1989). Estimation of returns to scale using data envelopment analysis. Unpub-lished paper. Carnegie Mellon University, School of Urban and Public Affairs.
economies in banking. Finance and Economics Discussion Series No. 107. Washington, DC: Board of Governors of the Federal Reserve System.
Board of Governors of the Federal System (1987).Report of condition and income for commercial banks.
Washington, DC: Department of Commerce, National Technical Service, Office of Technology. Board of Governors of the Federal System (1992).Report of condition and income for commercial banks.
Washington, DC: Department of Commerce, National Technical Service, Office of Technology. Charnes, A., Cooper, W. W., Golany, B., Seiford, L. M., & Stutz, J. (1985). Foundations of data
envelop-ment analysis for Pareto-Koopmans efficient empirical production functions.Journal of Econometrics 30, 91–107.
Charnes, A., Cooper, W. W., Huang, Z. M., & Sun, D. B. (1990). Polyhedral cone-ratio DEA models with an illustrative application to large commercial banks.Journal of Econometrics 46, 73–91. Charnes, A., Cooper, W. W., Lewin, A. Y., & Seiford, L. M. (Eds.). (1994).Data Envelopment Analysis:
Theory, Methodology and Applications.Boston: Kluwer.
Charnes, A., Cooper, W. W., & Rhodes, E. (1978). Measuring the efficiency of decision making units
European Journal of Operational Research 2, 429–444.
Charnes, A., Cooper, W. W., & Rhodes, E. (1979). Short communication: Measuring the efficiency of decision-making units.European Journal of Operational Research 3, 339.
Charnes, A., Cooper, W. W., & Rhodes, E. (1981). Evaluating program and managerial efficiency: An application of data envelopment analysis to program follow through.Management Science 27, 668–697. Charnes, A., Cooper, W. W., Rousseau, J., & Semple, J. (1987).Data envelopment analysis and axiomatic
notions of efficiency and reference sets. Research Report CCS 558. Austin: Center for Cybernetic
Studies, University of Texas.
Charnes, A., Cooper, W. W., & Schinnar, A. P. (1982). Transforms and approximations in cost and production function relations.Omega 10, 207–211 (also Prologue).
Clark, J. A. (1984). Economies of scale and scope at depository institutions: A review of the literature.
Economic Review, September/October, 6–33. Federal Reserve Bank of Kansas City.
Elyasiani, E., & Mehdian, S. M. (1990). A nonparametric approach to measurement of efficiency and technological change: the case of large U.S. commercial banksJournal of Financial Services Research 4, 157–168.
Evanhoff, D. D., & Israilevich, R. (1991). Productive efficiency in banking,Economic Perspectives July/
August, 11–32. Federal Reserve Bank of Chicago.
Fare, R., Grosskopf, S., & Lovell, C. (1983). The structure of technical efficiency.Scandanavian Journal of Economics 85, 181–190.
Fare, R., Grosskopf, S. & Lovell, C. (1985). The Measurement of Efficiency of Production.Boston: Kluwer-Nijhoff.
Farrell, M. J. (1957). The measurement of productive efficiency,Journal at the Royal Statistical Society 120(Series A), 253–281.
Ferrier, G. D., & Lovell, C. A. K. (1990). Measuring cost efficiency in banking: Econometric and linear programming evidence.Journal of Econometrics 46, 229–245.
Fried, H. O., Lovell, C. A. K., & Schmidt, S. S. (Eds.). (1993).The Measurement of Productive Efficiency:
Techniques and Applications.New York: Oxford University Press.
Ganley, J. A., & Cubbin, J. S. (1992). Public Sector Efficiency Measurement: Applications of Data
Envelopment Analysis.Amsterdam: North Holland.
Gilbert, R. A. (1984). Bank market structure and competition: a survey.Journal of Money, Credit and Banking 14, 617–645.
Graham, F. C., & Horner, J. E. (1988). Bank failure: an evaluation of the factors contributing to the failure of national banks.Proceedings of a conference on bank structure and competition(pp. 405–435). Chicago, IL: Federal Reserve Bank of Chicago.
Hancock, D. (1986). A model of the financial firm with imperfect asset and deposit elasticities.Journal of Banking and Finance 10, 37–54.
of foreign-owned and domestic-owned U.S. banks.International Review of Economics and Finance 2, 293–316.
Haslem, J. A., Scheraga, C. A., & Bedingfield, J. P. (1996). A DEA analysis of the financial efficiency of large U.S. banks.Global Business and Finance Review 1, 1–12.
Lovell, C. A. (1993). Production frontiers and productive efficiency. In H. O. Fried, C. A. K. Lovell, & S. S. Schmidt (Eds.),The Measurement of Productive Efficiency: Techniques and Applications(pp. 3–67). New York: Oxford University Press.
Mester, L. J. (1987). Efficient production of financial services: Scale and scope economies,Business
Review January/February, 15–25: Federal Reserve Bank of Philadelphia.
Mester, L. J. (1993). Efficiency of banks in the third federal reserve district. Working paper No. 94-1, Federal Reserve Bank of Philadelphia.
Norman, M., & Stoker, B. (1991).Data Envelopment Analysis: The Assessment of Performance. Chiches-ter, UK: John Wiley.
One Consulting (1995).IDEAS: Integrated Data Envelopment Analysis System, Version 5.1. Amherst, MA: One Consulting.
Park, S. (1994). Explanations for the increased riskiness of banks in the 1980s.Review July/August, 3–23: Federal Reserve Bank of St. Louis.
Parkan, C. (1987). Measuring the efficiency of service operation: An application to bank branches,
Engineering Costs and Production Economics 12, 237–242.
Rangan, N., Grabowski, R. Aly, H. & Pasurka, C. (1988). The technical efficiency of U.S. banks.Economic Letters 28,169–175.
Scheraga, C. (1995). Efficiency evaluation via data envelopment analysis: A primer. Working paper, School of Business, Fairfield University, Fairfield, CT.
Seiford, L. M., & Thrall, R. M. (1990). Recent developments in DEA: The mathematical programming approach to frontier analysis.Journal of Econometrics 46, 7–38.
Shaffer, S. & David, E. (1991). Economies of superscale in commercial banking.Applied Economics 23, 283–293.
Sherman, H. D., & Gold, F. (1985). Bank branch operating efficiency: Evaluation with data envelopment analysis,Journal of Banking and Finance 9, 297–315.