126
Aceh International Journal of Science and Technology ISSN: 2088-9860
Journal homepage: http://jurnal.unsyiah.ac.id/aijst
Estimation of Carbon Stock Stands using EVI and NDVI vegetation index
in production forest of lembah Seulawah sub-district, Aceh Indonesia
Jhon Pandapotan Situmorang1. Sugianto Sugianto2. and Darusman 2 1Postgraduate Program of Syiah Kuala University. Darussalam. Banda Aceh
2 Lecturer. Faculty of Agriculture. Syiah Kuala University. Darussalam. Banda Aceh. Indonesia
Corresponding Author: [email protected]
Received : October, 2016 Accepted : December 25, 2016 Online : December 31, 2016
Abstract - This study aims to determine the distribution of the vegetation indexes to estimate
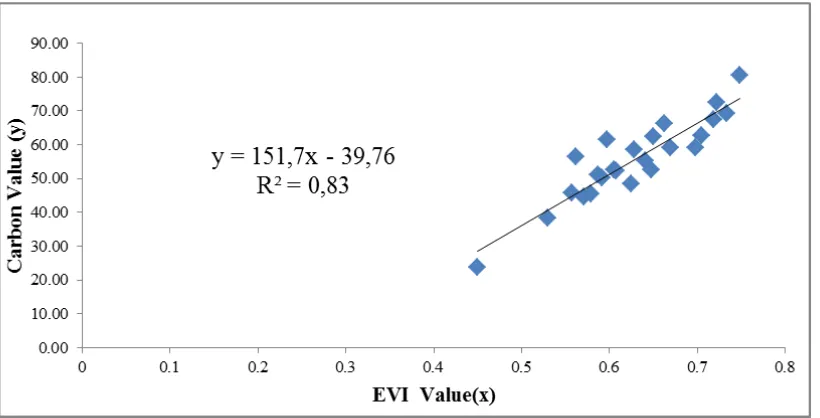
the carbon stocks of forest stands in the Production Forest of Lembah Seulawah sub-district. Aceh Province, Indonesia. A non-destructive method using allometric equations and landscape scale method were applied, where in carbon stocks at the points of samples are correlated with the index values of each transformation of the vegetation indexes; EVI and NDVI. Results show that EVI values of study area from 0.05 to 0.90 and NDVI values from 0.17 to 0.85. The regression analysis between EVI with carbon stock value of sample locations equation is Y = 151.7X-39.76. with the coefficient of determination (R2) is 0.83. From this calculation, the total carbon stocks in the Production Forest area of Lembah Seulawah sub-district using EVI is estimated 790.344.41 tonnes, and the average value of carbon stocks in average is 51.48 tons per hectare. Regression analysis between NDVI values at the research locations for the carbon stack measured samples is Y = 204.Xx-102.1 with coefficient of determination (R2) is 0.728. Total carbon stocks in production forest of Lembah Seulawah sub-district using NDVI is estimated 711.061.81 tones. and the average value of carbon stocks is 46.32 tons per hectare. From the above results it can be concluded that the vegetation indexes: EVI and NDVI are vegetation indexed that have a very close correlation with carbon stocks stands estimation. The correlation between EVI with carbon stock and the correlation between NDVI with carbon stock is not significantly different.
Keywords: Vegetation index. Production Forest, Carbon stock, EVI and NDVI
Introduction
Nowadays, global warming is an environmental problem commonly discussed both in academic and nonacademic situations. Global warming is defined as the recent and ongoing rise in the global average temperature near Earth’s surface (Environmental Protection Agency. 2007). Intergovernmental Panel on Climate Change (2007) has indicated that most of the observed areas in the world have shown that an increasing of global average temperatures since the mid-20th century is most likely due to the increase in anthropogenic greenhouse gas concentrations. The greenhouse effect is a result of rising concentrations of carbon dioxide (CO2) and other
gases in the atmosphere. The increase concentration of CO2 is caused by the combustion of
127
warming and associated with climate change has provided useful information for the complex coupling of the biosphere and the atmosphere (Piao et al, 2014).
Tropical forest vegetation has a strong role in local and global climate change. and plays a prominent role in the global C cycle (IPCC. 1996; Dixon et al.. 1994). Vegetation absorbs CO2 in
the atmosphere (carbon sink) through photosynthesis and stores the carbon in plant structures (Dixon et al.. 1994). The flow of carbon from the atmosphere and vegetation is a two-way flow with fixation of carbon into biomass through photosynthesis and carbon is released to the atmosphere through decomposition and combustion processes (Lasco. 2002).
However deforestation in tropical regions is considered as the second largest source of greenhouse gas emissions (IPCC. 2007) and it is believed to remain the main source of emissions in the future (Millennium Ecosystem Assessment. 2005). Deforestation and forest degradation can result in more carbon emissions expelled to the atmosphere, thus affecting the global climate and environmental changes (Achard et al.. 2004; Frolking et al.. 2009; Hansen et al.. 2013). On the other hand, the possibility of expanding carbon sequestration in forests has been identified as a potential way to mitigate climate change (FAO. 2001; DeFries et al.. 2000).
Aceh Besar district has an extensive production forest area about 68.506.97 Ha. Aceh province is currently in a period of moratorium logging. As a result, the main function of forest product production is as a producer of timber and non-timber forests cannot run optimally. Under these conditions, the production forest can be used as a carbon sink as part of to reduce global warming.
Currently a concern of global changes and ecosystem functions requires accurate estimates of biomass and the monitoring of the dynamics of amendments (Le Toan et al.. 2011). Methods of field measurements at plot level are considered to give a fairly accurate value. However, when applied to a large area it becomes less efficient. The technique based on field measurements is the most accurate but difficult to do over large areas and has proven to be very expensive, labor-intensive and time-consuming (De Gier. 2003). Thus there is a need for a developed method of estimation and monitoring changes in carbon stocks in a more efficient way. One of these methods is by using remote sensing technology. Retrieval of vegetation properties such as leaf area index and indices using remotely sensed data is an efficient method compared to ground measurement (Fernandes et al. 2002; Mayr and Samimi, 2015)
Remote sensing technology is a technology that has been utilized in various fields of science and one of them is the forestry field. Currently, remote sensing has been widely used for gathering information about forest biomass (Drake et al. 2003. Le Toan et al.. 2004. 2011. Maynard et al., 2007; Lu. 2006). Parameter of satellite imagery used in the process of estimating the biomass is vegetation index. Vegetation index is an index obtained through mathematical operations such as subtraction, addition and the ratio between the near infrared band with a red band of satellite imagery. The use of vegetation indices commonly used to estimate the biomass of which is normalized difference vegetation Index (NDVI) (Rouse et al. 1973) and enhanced vegetation index (EVI) (Huete et al. 1999).
Material and Methods
The research was conducted in the production forest in Lembah Seulawah sub-district, Aceh Province Indonesia for collecting field data. Ground checks and field data collection was conducted from April to July, 2016.
128
height (DBH) approximately 130 cm above the ground were used to calculate the carbon stock for selected stands of the Production Forest, Lembah Seulawah, Aceh.
A non-destructive method using allometric equations and NDVI and EVI indexes was performed. Non-destructive method is the method of calculation of the biomass measuring the diameter and height without the damaging of trees. Calculation of biomass with this method was carried out by using the allometric formula. Landscape scale method (NDVI) is a method of estimation of carbon stocks which utilizes satellite imagery. Image analysis can produce EVI and NDVI values for each selected study sites. The value of the EVI and NDVI were correlated with the calculated of the biomass measured in the fields. Spatial distribution maps of carbon stock and index value were performed. Selection of the sample areas based on the value of vegetation index distribution was carried out. Based on the index value, we selected 19 plots of the sample area.
Image Processing
Cropping and radiometric corrections were carried out for the Landsat image of the location. The following equation was used to convert DN values to TOA reflectance for OLI data:
ρλ' = MρQcal + Aρ ...(1) where:
ρλ' = TOA planetary reflectance, without correction for solar angle. Note that ρλ' does not contain a correction for the sun angle
Mρ = Band-specific multiplicative rescaling factor from the metadata
(REFLECTANCE_MULT_BAND_x. where x is the band number)
Aρ = Band-specific additive rescaling factor from the metadata
(REFLECTANCE_ADD_BAND_x. where x is the band number)
Qcal = Quantized and calibrated standard product pixel values (DN)
Furthermore, the image of the sun's angle was corrected to eliminate the difference in the DN values caused by the position of the sun. The position of the sun to the earth changes depending on the recording time and location of the object to be recorded. The equation for correction with the angle of the sun, as follows:
ρλ = ρλ'/(cos (θSZ)) = ρλ'/(sin (θSE)) where:
ρλ' = ToA reflectance
θSE = Local sun elevation
angle. The scene center sun elevation angle in degrees is provided in the metadata (SUN_ELEVATION)
θSZ = sun zenith angle. θSZ = 90 °- θSE
A WGS 1984 datum of Universal Transverse Mercator (UTM) projection in Zone 46 N was selection to geo-referenced of the image of the location samples.
Vegetation Index
Normalized Difference Vegetation Index (NDVI)
129
NDVI : Normalized Difference Vegetation Index NIR : Near Infrared Band
Red : Red Band
Enhanced Vegetation Index (EVI)
To compare the indexes distribution values for the research area, the EVI index equation was utilized (Huete et al. 1999):
EVI : Ehnanced Vegetation Index
NIR : Near Infrared Band
Red : Red Band
Blue : Blue Band
C1 : values as coefficients for atmospheric resistance Value 6
C2 : values as coefficients for atmospheric resistance Value 7
L : value to adjust for canopy background
Both NDVI and EVI indices are correlated with the calculation of carbon stock of the production forest of Lembah Seulawah sub-district. A determined coordinates of the sample plots were created to the image sample plots according to the field check. After the vegetation index image data was obtained then correlation was calculated with the results of the field data measurement.
Field Data Collection
Random plots of the area were made to collect the field data in the production forest. The number of plots in this study was 24 plots each with a size of 30 X 30 m, a similiar plot with the image used.
Biomass of stands’ calculation.
Calculation of tree biomass using allometric equations is as follows. (Chave et al. 2005):
W = 0.0509 x ρ x DBH2 x T
W = the total biomass (kg)
DBH = diameter at above the ground (aproximately 130 cm) ρ = wood density (gr / cm3)
T = height (m)
In this allometric equation components or dimensions of the trees required is the diameter and height, and the weight information of each type of the wood. For the measurement of the diameter, the phi-band and the diameter were utilized to measure the tree diameter at above the ground height ( ± 130 cm) (D/DBH) and the measurement of tree height used a hagameter, while for calculating biomass in this study used a specific density of average wood 0.68 gr/cm3.
130
the research area where the precipitation in this area is 1500-2000 millimeter per year and it is classified as a humid climate (rainfall of 1500-4000 millimeter per year). This is consistent with the finding of Rahayu et al. (2006) and Samsoedin et al. (2009), both researchers used similar calculation for natural forest biomass with the average wood density of 0.68 gram per cm3.
Based on the results of measurements of the diameter and height of stands on each plot sample, calculations of biomass were carried out, and then the entire calculation of biomass stands per hectare use following equation:
W : Total Biomass (ton/ha) equation as follows (Brown et al.. 1 996):
Y = W * 0.5
Y = above the ground carbon (t / ha) W = Total of biomass per hectare (t / ha)
The biomass stands were calculated using allometric equations developed by Chave et al. (2005).
Correlation Model Between Carbon Stock Value with NDVI dan EVI Value.
Based on calculations of the carbon stocks estimation of the modeled correlation between carbon stocks and the value of NDVI and EVI was carried out. The correlations were calculated by the linear regression equation; y = a + bx. the values of a and b can be calculated using the following formula (Walpole. 1992):
b
And then, the correlation analysis is calculated using the following Pearson correlation test equation:
n ∑ Wpi
131 and EVI were calculated to estimate the total carbon stock in the Production Forest of lembah Seulawah, Aceh.
Result and Discussion
Carbon Stock of the Plot Samples
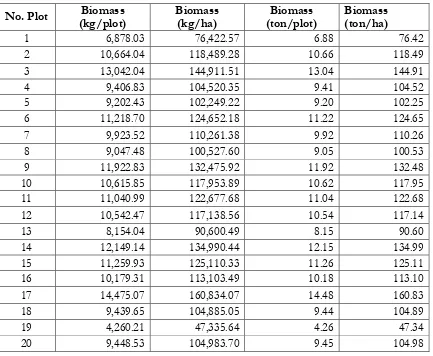
The average of biomass and carbon stocks for each plot is presented in Table 1 below:
132
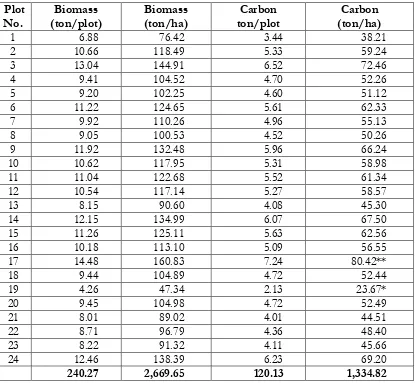
240,268.32 2,669,648.02 240.27 2.669.65
The amount of forest biomass of the forest stand is shown in Table 2. Table 2 shows that the value of the smallest total carbon is in plot 19 with a value of 2.13 tons, equal to 23.67 tonnes/ha, while the highest biomass is obtained at plot number 17 with the value of 7.24 tons or equal to 80.42 ton per hectare.
Table 2: Carbon stock total for each sample plot of study area
133
Vegetation Index Transformation
Vegetation index is a value obtained from a specific combination of several spectral bands from remote sensing imagery. Vegetation indices used in this study is Enhanced Vegetation Index (EVI) and Normalized Difference Vegetation Index (NDVI).
Enhanced Vegetation Index (EVI)
Image processing algorithms of EVI result in the vegetation index values of the study area between 0.05 and 0.93. The distribution of EVI value in the area is as presented in Table 3:
Table 3. The Distribution of EVI Values of the study area
EVI Value
Area (ha)
Percentage (%)
0 – 0.20 7.83 0.05
0.21 – 0.40 497.17 3.24
0.41 – 0.60 6.893.15 44.90
0.61 – 0.80 7.912.16 51.54
0.81 – 1.00 41.07 0.27
Total 15,351.38 100.00
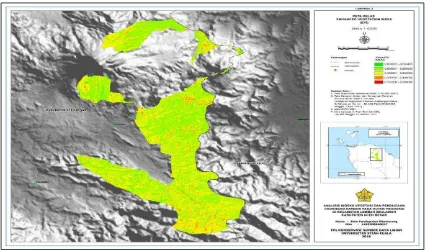
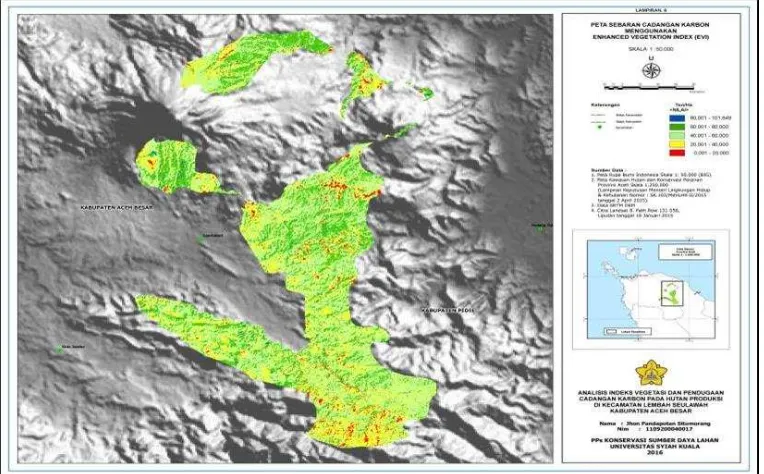
Spatial distribution of EVI values of Production Forest, Lembah Seulawah, Aceh is shown in Figure 1.
Figure 1. Spatial Distribution of EVI Values of Production Forest. Lembah Seulawah, Aceh.
Normalized Difference Vegetation Index (NDVI)
134
almost all the research areas were covered with vegetation. Distribution of NDVI value of the research area is presented in table 4:
Table 4. Total area based on the distribution of NDVI value in the study area
NDVI value Area (Ha) Percentage (%)
0 – 0.20 0.27 0.002
0.21 – 0.40 13.82 0.090
0.41 – 0.60 422.44 2.752
0.61 – 0.80 1,.764.49 83.149
0.81 – 1.00 2,150.36 14.008
Total 15,351.38 100.000
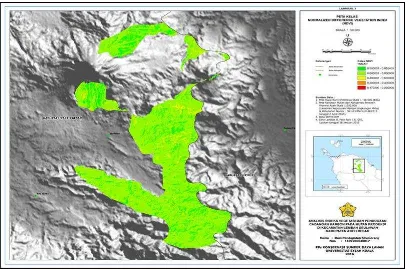
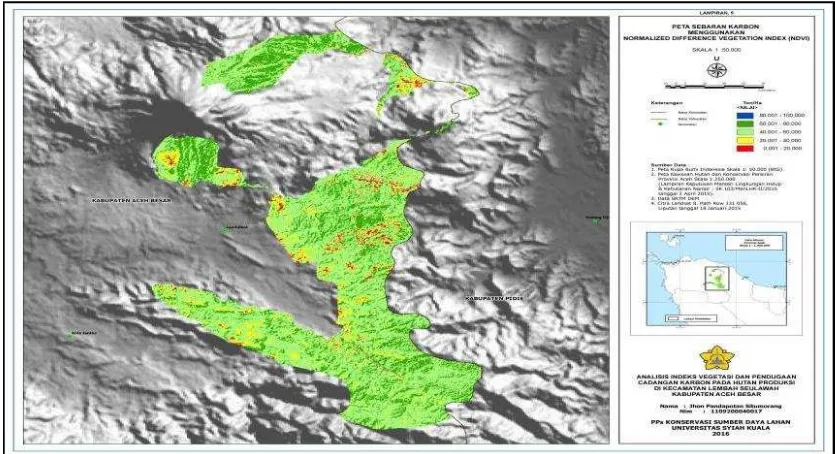
Spatial distribution of NDVI value in the Production Forest of Lembah Seulawah Sub-district, Aceh is shown in Figure 2.
Figure 2. Spatial distribution of NDVI values of production forest, Lembah Seulawah, Aceh.
Vegetation Index Relationship With Value Content of Carbon Stock
Correlation between EVI and Carbon Stock of Stands
Regression analysis between EVI and the carbon value to determine the correlation between EVI and carbon stocks was obtained by using each value, represented by X (EVI index) and Y (carbon stock) values respectively. The regression analysis between EVI values and carbon obtained a model equation of Y = 151.7X-39.76 with the coefficient of determination (R2) =
135
Figure 3. Linier correlation of EVI with the carbon stands total in Lembah Seulawah, Aceh
Correlation between NDVI and Carbon Stock of Stand Forest
Regression analysis was conducted to correlate the NDVI value with the carbon stock value at the research sample plots. Estimation of carbon stock (Y value) and NDVI value (X variable for each plot were then used as input data to calculate the regression analysis of NDVI and carbon stock. The regression analysis between NDVI values and carbon stock using the linear regression equation of y = a + bx obtained a model equation of Y = 204.3X-102.1 with the coefficient of determination (R2) = 0.728.
The value of coefficient of determination (R2) = 0.728 indicates that 72.8% of the carbon value can be explained by the NDVI through a linear regression obtained. The relationship between NDVI and carbon values is shown in figure 4.
136
Estimation of l Carbon Stock Total
Through the results of linear regression analysis the relationship between carbon stocks by value of Vegetation Index was obtained. Through these equations, carbon stocks of the research area can be estimated.
Estimation of Total Carbon Stock based on EVI value
Carbon Stock using EVI in the production forest of Lembah Seulawah district was calculated using the regression analysis equation y = 151.7x-39.76, with a coefficient of determination (R2)
that is equal to 0.83. From the calculation results obtained, the total carbon stocks in production forest of Lembah Seulawah, Aceh was 790.344.41 tonnes, and the average of carbon stocks is 51.48 tonnes per hectare. The distribution of carbon stocks using EVI vegetation index is presented in figure 5.
Figure 5: Spatial distribution of Carbon Stocks Stand in Lembah Seulawah. Aceh based on EVI value
Estimates of Total Carbon Stock based on NDVI value
Carbon Stock Value using NDVI in production forest in lembah seulawah district was calculated using the regression analysis equation 204.3x-102.1 with the coefficient of determination (R2) that is equal to 0.728.
137
Figure 6: Spatial distribution of carbon stock in the Production Forest, Lembah Seulawah. Aceh based on NDVI value
Conclusions
Estimation of carbon stock using vegetation indices (EVI and NDVI) in the production forest area of Lembah Seulawah, Aceh Indonesia has been proposed in this research. The EVI value in the production forest of Lembah Seulawah was from 0.05 to 0.93 and NDVI value from 0.16 to 0.85. These findings indicate that the vegetation cover in the area varies, from sparse to very dense vegetation.
The linier regression of carbon stock with EVI value can be estimated using linier correlation of Y = 151.7X-39.76; where Y as carbon stock total and X is the EVI value. Using this finding, the total carbon stocks in the production forest of Lembah Seulawah Aceh is approximately 790.344.41 tonnes, and the average of carbon stocks is 51.48 tonnes per hectare.
Estimation of carbon stock using NDVI value of the area can be approached using linear regression of Y =204.3X-102.1. Through this equation, the total carbon estimation in the production forest of Lembah Seulawah is 711.061,81 tonnes, with the average of 46.32 tonnes per hectare.
The EVI and NDVI vegetation indices have shown a close correlation with stands of carbon stocks estimation. Both indices approaches show a correlation coefficient of NDVI and EVI are 0.85 and 0.91 respectively, and the coefficient of determination of NDVI and EVI is 0.72 and 0.82. Both EVI and NDVI show no significant difference in term of correlation with the total of carbon stock stands.
References:
138
Brown. S., J. Sathaye., M. Canel and P. Kauppi. 1996. Mitigation of Carbon Emission to the Atmosphere by Forest Management. Commonwealth Forestry Review 75, pp. 80-91. Chave . J.. C. Andalo. S. Brown. M. A. Cairns. J. Q. Chambers. D. Eamus. H. Folster. F. Fromard
N. Higuchi. T. Kira. J. P. Lescure. B. W. Nelson. H. Ogawa. H. Puig. B. Riera. and T. Yakamura. 2005. Tree Alometry at Improve Estimation of Carbon Stocks and Balance in Tropical Forest. Oecologia 145, pp.87-99.
De Gier, A., 2003. A new approach to woody biomass assessment in woodlands and shrublands. Geoinformatics for Tropical Ecosystems, pp.161-198.
Departemen Kehutanan. 1999. Undang-Undang Republik Indonesia Nomor 41 Tahun 1999 tentang Kehutanan. Jakarta.
Dixon, R. K. Brown, S. Houghton, R. A. Solomon, A. M. Trexler, M. C. and Wisniewski, J. 1994. Carbon pools and flux of global forest ecosystems. Science 263, pp.185-190.
Drake, J B et al 2003 Above-ground biomass estimation in closed-canopy neotropical forests using lidar remote sensing: factors affecting the generality of relationships Glob. Ecol. Biogeogr. 12 147–59
Fernandes. R.; Miller. J.R.; Hu. B.; Rubinstein. I.G. 2002. A multi-scale approach to mapping effective leaf area index in boreal picea mariana stands using high spatial resolution CASI imagery. Int. J.Remote Sens. 23, pp.3547–3568.
Frolking. S., M. W. Palace. D. B. Clark. J. Q. Chambers. H. H. Shugart. and G. C. Hurtt 2009. Forest disturbance and recovery: A general review in the context of spaceborne remote sensing of impacts on aboveground biomass and canopy structure. J. Geophys. Res., 114. G00E02. doi:10.1029/2008JG000911.
Hairiah. K dan Rahayu S. 2007. Pengukuran Karbon Tersimpan di Berbagai macam Penggunaan Lahan. Bogor. World Agroforestry Centre –ICRAF. SEA Regional Office. University of Brawijaya. Indonesia. 77p.
Hairiah. K. 2011. Pengukuran Cadangan Karbon Dari Tingkat Lahan Ke Bentang Lahan. Word Agroforestry Centre ICRAF SEA Regional Office; Malang.
Huete. A.. C. Justice dan W. Van Leeuwen 1999. Modis Vegetation Index Algoritma Theorical Basic Document.
IPCC, 2007 Climate Change 2007: Synthesis Report. Contribution of Working Groups I, II and III to the Fourth Assessment Report of the Intergovernmental Panel on Climate Change [Core Writing Team, Pachauri, R.K and Reisinger, A. (eds.)]. IPCC, Geneva, Switzerland, 104 pp.
IPCC, 2007 Climate Change: Synthesis Report (Cambridge Univ Press, Cambridge, UK).
IPCC. 2001 Climate Change 2001: Working Group I: The Scientific Basis. Cambridge University Press. New York.
IPCC. 2007 Climate Change 2007: Synthesis Report. Contribution of Working Groups I. II and III to the Fourth Assessment Report of the Intergovernmental Panel on Climate Change [Core Writing Team. Pachauri. R.K and Reisinger. A. (eds.)]. IPCC. Geneva. Switzerland. 104 pp.
Lasco R.D. 2002. Forest Carbon Budget in Southeast Asia Following Harvesting and Land Cover Change. In : Impacts of Land use Change on the Terrestrial Carbon Cycle in the Asian Pasific Region. Sciencein Chine Vol. 45, pp.75-86
Le Toan T. Quegan S. Woodward I. Lomas M. Delbart N and Picard C 2004 Relating radar remote sensing of biomass to modeling of forest carbon budgets Clim. Change 76, pp 379–402.
139
Lillesand dan Kiefer. 1990. Penginderaan Jauh dan Interpretasi Citra. Gadjah Mada University Press. Yogjakarta.
Lu, D. 2006. The potential and challenge of remote sensing-based biomass estimation. Int. J. Remote Sens., 27, pp.1297–1328
Maynard, C.L.; Lawrence, R.L.; Nielsen, G.A.; Decker, G. 2007. Modeling vegetation amount using bandwise regression and ecological site descriptions as an alternative to vegetation indices. GISci. Remote Sens, 44, pp.68–81.
Mayr. M and Samimi. C. 2015. Comparing the Dry Season In-Situ Leaf Area Index (LAI) Derived from High-Resolution RapidEye Imagery with MODIS LAI in a Namibian Savanna. Remote Sens.Vol. 7. Pp. 4834-4857
Millennium Ecosystem Assessment. 2005. Ecosystems and Human Well-Being: Scenarios (Island Press. Washington. DC).
Nabuurs. G.J, O. Masera. K. Andrasko. P. Benitez-Ponce. R. Boer. M. Dutschke. E. Elsiddig. J. Ford-Robertson. P. Frumhoff. T. Karjalainen. O. Krankina. W.A. Kurz. M. Matsumoto. W. Oyhantcabal. N.H. Ravindranath. M.J. Sanz Sanchez. X. Zhang. 2007: Forestry. In Climate Change 2007: Mitigation. Contribution of Working Group III to the Fourth Assessment Report of the Intergovernmental Panel on Climate Change [B. Metz. O.R. Davidson. P.R. Bosch. R. Dave. L.A. Meyer (eds)]. Cambridge University Press. Cambridge. United Kingdom and New York. NY. USA.
Piao, S.; Nan, H.; Huntingford, C.; Ciais, P.; Friedlingstein, P.; Sitch, S.; Peng, S.; Ahlstrom, A.; Canadell, J.G.; Cong, N, 2014. Evidence for a weakening relationship between interannual temperature variability and northern vegetation activity. National Communication.
United State Geological Survey (USGS). 2015. Using the USGS Landsat 8 Product. Cited at : Landsat.usgs.gov/Landsat8_Using_Product.php.