DIGITAL IMAGE AND REMOTE SENSING IMAGE AS A DATA
FOR AN IDENTIFICATION OF A QUALITY OF A NON-POINT
SOURCE POLLUTANT IN CILIWUNG RIVER, INDONESIA
Riki Mukhaiyar1
1Faculty of Engineering, Universitas Negeri Padang, Indonesia
*Corresponding Author, Received: 17 Nov. 2016, Revised: 12 Dec. 2016, Accepted: 13 Jan 2017 ABSTRACT: The fact that the quality of water in the river is getting worse, especially for Ciliwung River which is contaminated with non-point source pollutant from household wastes, particularly on the downstream of Ciliwung River cannot be lied. But, by using technology of remote sensing, integrated with information from the data of digital image and modeling technology for the simulation of water quality will provide easiness during the observation on the quality of water changes on the river surface. One example of it is that the use of land for settlements and housing ranges between 62.84% - 81.26% on the downstream of Ciliwung River, give a significant picture in seeing factors that affected the water quality of Ciliwung River.
Keywords: Digital Image, Land Use, Non-Point Source Pollutant, Qual2e Simulation
1. INTRODUCTION
River is one of the environmental components that have important role in human life and livelihood, including supporting community economic development. Because of that river pollution and forest destruction need to be controlled along with the rate implementation of development so that the function preservations of rivers can be maintained to fulfill the lives of many people and to support the sustainable of development [1].
Ciliwung River comes from the foot of Mount Pangrago, West Java, flows to DKI Jakarta through Bogor District, the city of Bogor, the city of Depok, and empties in Jakarta bay. Ciliwung River length from the upstream and empties in the gulf coast of Jakarta in North Jakarta. The total length of this river is + 76 km with the large area of watershed is approximately 322 km2, bordered
by Cisadane watershed on the west side and Citarum watershed on the east.
The potency of Ciliwung River is very big and strategic. But its current quality is likely continuing to decline every year. The declining quality of Ciliwung River is caused by the increasing load of pollutant in the river. It also caused by the smaller the flow rate in dry season while in rainy season flooding often occurs [2].
Evaluation of the load carried toward the monitoring results of Ciliwung River using capacity calculating approach, based on its standard quality and in accordance with the allotment of river, that is for the allotment of raw drinking water, with the quality standard of BOD are 10mg/L and the load of river water.
The rivers accept load of pollutant that come from various sources. Big part of the pollutant load is exceeded the permitted threshold so that the entry o pollutant sources cause the declining quality of Ciliwung River. In general, the pollutant sources are classified into three groups; instantional pollutant source, non-instantional pollutant source, and pollutant source from outside Jakarta [2].
The river can naturally able to rid them from the pollutants that enter the river [3]. However, as other natural resources, the carrying capacity of pollutant is limited. Because of that if the load of pollutant in the river is exceeded the carrying capacity, then water pollution will occur. With the growth of population, industries, agriculture intensification, then the pollution load in Ciliwung flows has increased significantly.
This prediction is made by taking three parameters assumed as factors that have roles in the occurrence of pollution. These parameters are the number of population, industries, and agriculture.
The following are the sources of pollutant that are potentially affected the decreasing water quality of Ciliwung River.
1.1. Sources of Household Wastes
1. Limitation of household waste is considered to be polluting the river is the wastewater from washing, toilet, and faeces (MCK).
The way people live in the river usually commensurate offhand dispose of household garbage, water containing foam, and defecating along the rivers. They still do not realize that their lives are like that have a major influence on river pollution. In addition to the lack of awareness of protecting the environment, there are psychological factors that still need to be addressed. Although the government has built several public toilet facilities sufficient, but residents prefer to do the activity, MCK, along the river. 1.2. Source of Industrial Wastes
1. Industrial waste water pollution is a factor that is more unique Ciliwung River. Its uniqueness is caused by the diversity of processes and products. Because the major factors affecting river water quality parameters of BOD (Biological Oxygen Demand), DO (Dissolved Oxygen), and COD (Chemical Oxygen Demand, hence in this study, only four main parameters of this alone is processed.
2. Effluent or waste discarded by most of the industries located in the region Ciliwung River, the pollution load will not operate if each industrial waste water treatment plant or WWTP (Wastewater Treatment Plant) with promptly and effectively. The government has been requiring for each potentially polluting industries shall build and operate the WWTP. But the reality proves that not all comply with industry regulations.
1.3. Source of Agricultural Wastes
Pollutants generated from the agricultural activities are mainly come from fertilizing and the use of pesticide. Wastes from fertilizer can be measured by the compounds of nitrogen and phosphorus, while for pesticide, the identification of elements that give the pollutant parameter of the use of pesticide have not yet been found [3].
The land use for agricultural which is useful for estimating the debit of pollutant are as follows [3]:
a. Wetland: the suitable land for rice cultivating is the irrigated land, which is divided into a small individual rice field area.
b. Rain fed lowland: the cultivated land for secondary plants such as, cassava, soya beans, and peanuts. Irrigation is done by using the rainwater. But if there is no rainwater, these lands are flowed with irrigation water.
c. Wetland Mixed: The cultivated lands for unspecific plants. These lands are planted with many kinds of vegetables and other food crops simultaneously or in stages.
d. Plantation: The area that are planted with plantation crops such as, coffee, tea and chocolate, which are generally located in mountain areas.
e. Forests: Including wildwoods or artificial forests for timber production (teak, pine) The agricultural activities in the watershed of Ciliwung consist of wetland only once a year (rain fed lowland), wetland two times a year (wetland), plantation, moor, and forest. In accordance with the purpose of the research that is to obtain quantitative description of pollutant entering the river from NPS pollutant source and to predict the possibilities of pollution occur in one point that the data has not yet obtained. Then, by using spatial analysis of digital image of maps and remote sensing images data, that problem can be solved.
2. METHODS USED
2.1 Digital Image of the Theme Maps
In this research, digital maps were originated from several conventional maps (an analog form). Thus, it must be converted into a digital form using three steps: digitizing, editing, and entering attribute data. This all activities can be categorized as Geographic Information System techniques.
2.1.1 Digitizing
Before conducting digitizing process, the coordinate system that used, was set. In this study, all digital maps were in UTM coordinate system (Universal Transverse Mercator).
Stages of digitizing using MapInfo 5.5 software are as follows:
Place the sheets of map on digitizer table. Set the projection into UTM (WGS 84) zone
48 south, because the study area using this projection.
Enter the four map points control (TIC). Digitized process of the existing feature on
the map.
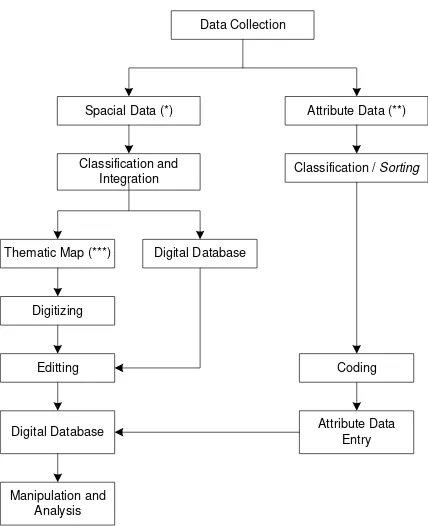
Data Collection
Spacial Data (*)
Classification and Integration
Thematic Map (***) Digital Database
Digitizing
Editting
Digital Database
Attribute Data (**)
Classification / Sorting
Coding
Attribute Data Entry
Manipulation and Analysis
Diagram 1: General Data Processing Note:
(*) = 1:50.000 scale maps that have not been
digitized
(**) = Table data such as total population, the
concentration of pollutants, etc
(***) = 1:50,000 scale maps such as land use
maps, maps, river flow patterns, etc., that have not been digitized
2.1.2 Editing
Editing was done by using MapInfo 5.5 software. There are three ways in editing data digitations results, namely:
a) Combining object with the following stages:
Select one object from the layer that will be edited.
Select target setting to define the target as the only one that will be edited.
Select another object which will be combined.
Combining these two objects with the existing combine command on the menu bar Objects.
b) Separating the objects:
Select one object from the layer that will be edited.
Select target setting.
Select another object that will be used as a reference for the separation.
Select split from the menu bar Objects. c) Removing Objects:
Select one object from the layer that will be edited.
Select target setting.
Select another object that will be used as a reference for the separation.
Select erase from the menu bar.
2.1.3. Entering Attribute Data
Attribute data (non-graphical data) is tabular data file that can be added for analysis and manipulation purposes and have a role in giving information about graphical data.
The types of attribute data adjusted with the research purposes. In this research, the types of attribute data needs are as follows:
a) Attribute data of land use.
b) Attribute data of district administration. c) Attribute data of watershed (DAS).
d) Attribute data of pollutant measurements points. e) Attribute data of simulation points.
f) Attribute data of river.
g) Attribute data of General Spatial Plan (Rencana Umum Tata Ruang / RUTR) of Ciliwung watershed [4].
Fig. 1. Example of Digital Maps
Each classification of attribute data above is adjusted with the classification of its graphical data. Entry process of attribute data was done interactively via the keyboard.
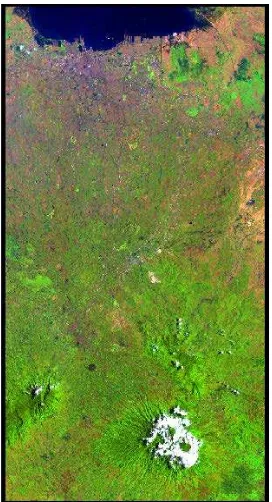
2.2 Remote Sensing Data
Fig. 2: Landsat TM 541 Geometric Correction Results
Geometric Correction of Image Results
RoI Ciliwung Watershed
Image Ratioing
Stretching and the Enlightenment
RoI of Downstream Ciliwung
A
Determination of Training Site
i = training site; i=1,...n
Image with the Training Site
Calculations Statistic Value of Training Regions
i = class; i=1,...n
Determining the Formula-Histograms equalization
Image Classification Maximum Likelihood
Image Classification Results
A
Diagram 2: Classification of Landsat TM Process
3. ANALYSIS OF POLLUTANT OF NON-POINT SOURCE (NPS) OF A RIVER
3.1 Input Data for a Simulation of Ciliwung River’s Water Quality using QUAL2E
In general, the detecting process of water quality using simulation method can be seen in diagram 3.
3.1.1 Simulation Initialization QUAL2E
In simulation initialization, there are several things that have to be considered:
In this research, the type of simulation used is dynamic type for simulating water quality in spatial based on measurement data, and not temporally based on climatic data and algae.
The standard unit used is metric, because the data used in this study are in metric units. Calibration analysis of simulation result is not used
because the simulation result will be observed firstly. If the simulation result is adequate, then the
calibration is not done.
Oxygen Measurement Data
Temperature Correction Factor
Hydraulic Data
i=reach; i=1,...,14 Hydraulic Data Entry
i-th
Reaction rate constant of BOD and DO
River Hydraulic Data
River Water Quality Initial conditions i-th
A
i=reach; i=1,...,14
Head of Water Quality in River Water
Global Climate Data
Simulation of River Water Quality
i=reach; i=1,...,14
Simulation Results
Diagram 3: Detection Process Of Water Quality With Dynamic Simulation Method Using Qual2e Software
Moreover, the additional debit parameter to increase the quality of DO is also unnecessary.
Sectional shape/ profile of the river do not affect the result of spatial simulation of dynamic type, so that this river profile can be ignored.
The simulation is conducted for one hour. This is based on the reason that this parameter does not affect the result of spatial simulation of dynamic type when the simulation length is 0 (t=0).
Days in a year when simulation of dynamic type begun is using default, which is 180. By considering that this parameter does not affect the result of spatial simulation of dynamic type.
The length of simulation is 0. It is because on dynamic type, when t=0, the Qual2E spatially simulating based on the measurement data.
The total reach is 14. This total number of reach is adjusted with the number of measurement location.
Simulation Initialization
Begin and End of River
ke-i i=reach; i=1,...,14 Watershed Systems
Object River In the i-th Element
Water Quality Parameters
Geography and Climate Data
Depictions of the i-th Simulation Results
A i=reach; i=1,...,14
3.1.2 Watershed Systems
In defining the watershed, there are things that have to be considered:
The distance upstream (initial) of reach, calculated from the position of the estuary (outlet) of the river (0 km), while the distance downstream (end) of the river calculated from the position of the estuary (outlet) of the river (0 km).
The length of reach element, where each of maximum reach is divided into 20 parts/ elements of the same lengths.
The total reach is 15, where the upstream and the outlet of every reach is the location of water quality measurement. The total length of the river is 125 km and with only one headwater. The length of reach element is short enough, that is 1 km with the purpose is to multiply the location of simulation.
3.1.3. River Object on Element Reach
In determining the river object, there are things to be considered:
Number of element reach, ordered from upstream to downstream.
Consists of six types of object, namely; upstream, river outlet and river, river dams, waste disposal sites to the river, the river water sampling location, and measurement location or simulation location.
Objects of all element reach, except the upstream (headwater) and outlet (end), are standard (S) because spatial simulation are done only based on measurement data.
3.1.4 Parameter of Water Quality Simulation
In this research, the simulated parameters are: (1) BOD
(2) Phosphorus (3) Nitrogen
(4) Dissolved Oxygen (DO)
(5) Chemical Oxygen Demand (COD)
3.1.5 Geographical and Climate Data
Geographical data is only affected on temporal simulation, so that in this research this data can be ignored or by using default rate since it does not affect the result of spatial simulation of dynamic type. The geographical data are Basin Latitude, Basin Longitude, Standard Meridian, Basin Elevation, and Dust Attenuation Coeff.
In determining the geographical and climate data, things to be considered are:
Global climate data (in the area that is wider than river) that can affect the temperature around the river from time to time. This data is used for dynamic simulation. The simulation of water quality in this research is spatial simulation based on the measurement done by using QUAL2E in dynamic type of simulation when t=0. Thus, in this case, temperature measurement is used. And the choice of climate data on this screen is supposed to be Reach Variable Temp. However, since this choice is not active when the selected type of simulation on the first screen is dynamic, so Global Values is chosen as the way out without inserting the file name. Meanwhile, temperature measurement data can be inserted on the screen of Initial Condition of System.
Temperature Correction Factor data affecting the level of the decay elements of water quality and the level of DO reaerasi either in spatial or in temporal so that the existence of this data is highly recommended. However, in this research, the rate default is still used for a while.
River system in this research only has one headwater so that the result of simulation is described only on one flow.
The number of watershed to describe the simulation results depicted where in every watershed the water flow from headwater to outlet.
File that contains lower limit data, upper limit data, and oxygen average measured in every reach of the river. In this research, the data are not stored in a form of file, but they are directly inputted to the next screen.
3.1.6 Initial Condition of Water Quality of the River
In dynamic type simulation, this data is the initial condition (when t=0) of water quality at downstream (outlet) of each reach. Then, QUAL2E spatially simulating (when t=0) to get the water quality at other locations along the river based on the data. After that, QUAL2E perform temporal simulation to get the water quality from time to time (t>0).
In this study, the initial condition of this water quality is filled with measurement data at several locations. The water quality at other locations obtained by performing spatial simulation in dynamic type with simulation length of time is 0. 3.2 Pollution Load
3.2.1Households Wastes Sources
In this research, the variable of pollutant load of household sources are determining based on the assumption that every resident has the same contribution in causing pollution [7].
The number of residents in year –i located in the watershed of Ciliwung will be known by the following equation:
r = population growth rate t = time period calculations
f = percentage of population in one area included in the area of Ciliwung watershed
The every year wastes load is the function of the number of population, Pi, the waste load in each parameter and the habit percentage in every watershed of Ciliwung.
3.2.2 Industrial Wastes Sources
The calculation of pollutant load contribution percentage is differentiated for every type of industrial sector, because every sector has different characteristic of waste. However, by changing the variable of pollutant concentration and the debit resulted for every type of industry which is then called as pollutant load, then the pollutant load from different sector can be counted as the total pollutant load from industrial sources, generally in watershed of Ciliwung.
Besides, the parameters taken only involve BOD and COD, since these two parameters represent all types of industries in Ciliwung watershed and also as the dominant factor.
3.2.3 Agricultural Wastes Sources
The variable of pollutant load from agricultural sources is the function of the amount of fertilizer used is the results of wetland constant multiplication in Ciliwung watershed and the rate of fertilizer use for each type of fertilizer.
3.3 Riverine
To actualize the protection and control of water resources where river is more efficient, the riverine line is set. The riverine trace is the outside security boundary of the river. In this term, the area that
bounded by two lines of riverine that can be used for public interest and development, are set as the potential area of water source.
The riverine trace of Ciliwung has been set based on the considerations and the calculations of the highest rainfall, annually (R100) so that it can accommodate the debit of water for about 370m3/second. The riverine trace of Ciliwung is specified ranges from 60-85 meters including the segment of the river. However, along with the times and the uncontrolled development from the upstream to the downstream, based on the 1994 study (JICA-Public Cleansing Department), the water debit of Ciliwung River has increased to 570 m3/ second, which is coupled with the high level of erosion so that the potential for flooding becomes higher. The water of the Ciliwung River has the designation as raw drinking water based on the provision of Governor of Jakarta Decree No. 582 of 1995, and in accordance with local regulation No. 6 of 1999 on Jakarta Spatial Planning 2010 [4] that the allocation of body of river, canal, and artificial lake cannot be changed. The allotment shows that the protection of the quality of body water of the river have to be strived. Jakarta Spatial Planning 2010 article 21 stipulates that the development of flood control and drainage infrastructure is directed to organize the watershed area or the 13 conditions of major river (including Ciliwung) as the important part of the city by making them as the orientation region and river restructuring based on its function as flood control, flushing, and drainage through restructuring the riverine areas free from buildings and making the river as part of the river yard (front yard).
4. RESULTS
In the previous section, it has been explained that simulation is performed to obtain quantity data of non-point source pollutant in the estuary area of sub-watershed. By using the measurement data available and using the facilities available in Qual2e software, we will obtain these quantity data of pollutant. However, the measurement data that will be used as waste parameter in this research will be adjusted with the major parameter that strongly affected the water quality in a river. They are BOD (Biological Oxygen Demand), DO (Dissolved Oxygen), COD (Chemical Oxygen Demand), and NH4 (Ammonia).
The data need for the simulations are as follow: (Data of measurement result obtained from Geotek LIPI Sangkuriang Bandung, 2002-2003).
a. Simulation Type : dynamic.
b. Units : standard metric
units.
d. Watershed System
From Table 1, it can be seen that the number of reach that can be used in this research is 15, where the upstream and the outlet of each reach is the water quality measurement location. The total length of the river is 124 km with only one headwater. The length of reach element is made short enough, which is 1 km with the purpose is to multiply the location of simulation.
Table 1. Watershed Systems
The parameters of water quality simulated are: a. BOD (Biochemical Oxygen Demand) b. DO (Dissolved Oxygen)
c. COD (Chemical Oxygen Demand) d. NH4 (Ammonia)
In simulation using dynamic type, this data is the initial condition of water quality (when t=0) in the downstream (outlet) of each reach. Then, the Qual2e software will perform spatial simulation (when t=0) to obtain water quality in other locations along the river based on the data. After that, Qual2e software will perform temporal simulation to obtain water quality for the next time (which is when t>0).
In this research, the initial condition of water quality is filled with measurement data of several locations. The water qualities of the other locations are obtained by performing spatial simulation of dynamic type.
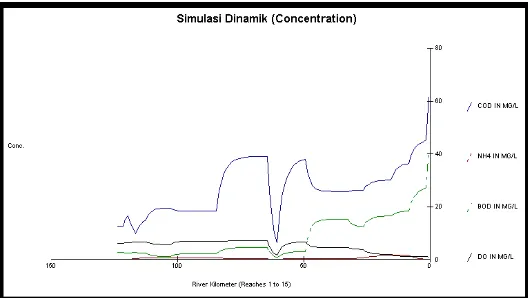
After processing the data, then we will get simulation graph depicting the relationship between pollutant concentrations for every parameter along the watershed simulation.
Figure 4 shows the concentration level of pollutant parameter of COD, NH4, DO, and BOD, along the river simulation. Thus, based on the graph, we can determine the concentration of pollutant in the estuary of each sub-watershed for the same parameters. The amount of pollutant concentration in the estuary of each sub-watershed can be seen in Table 4.
Fig. 4 The result of Pollutant Parameter Simulation along the River Simulation
5. DISCUSSION
5.1. Analysis of the Effect of Land-use on Pollutant Concentration
In this research, the effect of land use for each sub-watershed will be analyzed, which in general, is a source of pollutant that potentially affecting the decreasing quality of water in Ciliwung River. The pollutant source is differentiated into three, pollutant source from population wastes, industrial wastes, and agricultural wastes.
The agricultural parameter of each sub-watershed consists of:
1 : Moor, mixed garden, rice field with two times of crops in a year, and rice field with once crop in a year.
2 : Mixed garden, plantation, rice field with once crop in a year, and moor.
3 : Mixed garden, plantation, rice field with two times of crops in a year, rice field with once crop in a year, and moor. 4 : Rice field with two times of crops in a
year, rice field with once crop in a year, plantation, and mixed garden.
5 : Rice field with two times of crops in a year and plantation.
6 : Field with two times of crops in a year, mixed garden, plantation, and moor. 7 : Moor, mixed garden, and rice field with
two times of crops in a year.
8 : Mixed garden, moor, rice field with two times of crops in a year, and artificial forest.
9 : Rice field with once crop in a year, rice field with two times of crops in a year, moor, and mixed garden.
10 : Mixed garden.
1 : Settlement.
2 : Housing and Settlement. 3 : Settlement.
From the description table above, it can be seen that for sub-watershed located in the upstream of Ciliwung watershed, the parameter of land use that dominantly affecting the pollutant is the agriculture which is ranges from 44.72%-95.13%, contrasted with the population parameter that ranges from 0.04%-8.26%. While the industrial parameter that dominantly affecting the pollutant is 0%. It can be understood because the land in the upstream of Ciliwung watershed is still dominantly used for agricultural and population. Then, entering the body section and the downstream of Ciliwung watershed, the number of population is increasing, while the land use for agriculture is decreasing caused by the diversion of land use from agricultural use to population and industrial use.
5.2. Analysis of Pollutant Level
5.2.1 Analysis of Household Waste
As mentioned in the previous chapter that the pollutant load caused by household is influenced by the number of population that are in the watershed area. Then, the analysis is conducted by assuming that all population (100%) are in the area/ population parameter. The table below shows the number of population in each sub-watershed.
The potency of wastes load from household activities are as follows:
a) Potency of household wastes load in the area of Ciliwung watershed calculated based on the number of organic per person per day is 17.4 grams [9]. So, the potency of BOD wastes load per ton can be seen in the table below. b) Potency of number of trash calculated based
on the assumption that every person produces trash of 2.5 liter/person/day [9], then in Ciliwung watershed of 6.009.84 m3 trash generated per day. Based on the data from environmental impact control agency of Jakarta Province (Bappedalda DKI, [4]) shows that the trash which is transported by the Sanitation Department reach 85% and based on the data, then everyday in Ciliwung watershed will accumulate a number of 901.48 m3 trash that are discharge into the environment, including the river, everyday. By ignoring the assumption of the great potential of each resident in producing BOD pollutant, we can calculate the load of BOD wastes in year 2003 for each point of calculation simulation result that is by calculating the growth
rate and BOD measurement data available. The result can be seen in the following table.
5.2.2 Analysis of Industrial Waste
Since the industrial waste theoretically is categorized as point source pollutant source, thus in this research the analysis of load waste caused by industrial parameter will not be done.
5.2.3 Analysis of Agricultural Wastes
Because there is no definitive data of types of fertilizer used, either the data released by the government of DKI Jakarta, the government of Bogor Regency, or the data released by Bogor Municipality, then the determining toward the type of pollutant occur cannot be done. So, in this research, the analysis of agricultural wastes will not be conducted.
5.2.4 Analysis of Riverine
As described in the previous chapter that the function of riverine is to protect the water quality of the river from pollutant that caused by the inappropriate use of land, both on left side and right side of the watershed.
In this research, the size of riverine is adjusted with the order of the river, because the large amount of the river affecting the river potential in the environmental damage on either side. The amount of the riverine are:
Orde 1 = 100m ; Orde 5 = 6-6.5m Orde 2 = 50m ; Orde 6 = 3-3.5m Orde 3 = 25m ; Orde 7 = 2m Orde 4 = 12,5m ; Orde 8 = 1-2m
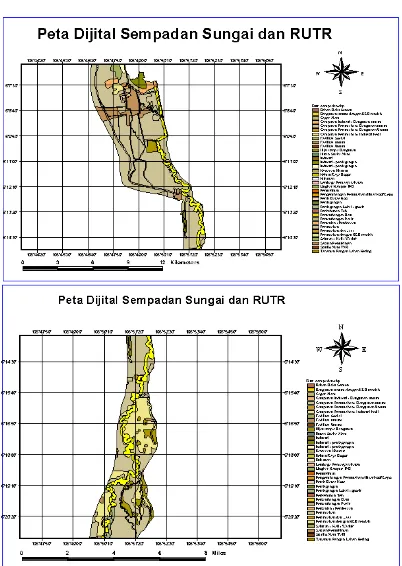
In Fig. 5, it can be seen the relationship between riverine area (long polygon/ yellow river) with RUTR (Spatial General Plan) for the upstream area and the body of Ciliwung watershed, where the use of land along the riverine area is the sources of household load.
6. CONCLUSION
classification. For further research, other classification techniques need to be done so that the results can be compared with the result from the techniques that have been done.
Fig. 5 Digital Map of Riverine and Spatial General Plan
While for the upstream along the riverine area, the use of area for household is not too dominant. The use of area in the upstream of Ciliwung watershed is dominated by agricultural activities (Fig. 6).
Fig. 6 Digital Map of Riverine and Spatial General Plan in the Upstream
2. If we compare digital map of land use in the upstream of Ciliwung watershed issued by National Agency of Surveys and Mapping
Coordination (Bakosurtanal) and Geo-technological of Indonesian Institute of Science (LIPI) Sangkuriang, Bandung (fig. 26), with TM landsat image 30 meters of resolution, taken in 1997 using RoI (Region of Interest) in the upstream of Ciliwung watershed classification results (fig. 25), there is a difference referring.
The difference can be understood with several reasons:
a. Digital map obtained from filed review results and the data obtained from the qualified authorities ( local government of DKI Jakarta, Bogor Regency, and the city of Bogor), while image capturing concrete information on the earth surface. So, the information for classification has its own patterns.
b. As the example for settlement classification, the information detected by the satellite is the appearance from above. We will also get this information from industrial classification so that image classification for industrial cannot be obtained because it is considered as settlement classification. In contrast with information from digital map because the information depicted by the institutions are in the form of area, so that the classifications of land use shown.
7. REFERENCES
[1]Riki Mukhaiyar, “Pengklasifikasian citra remote sensing untuk memaksimalkan penggunaan lahan ”, in Proceeding of Seminar Nasional Rekayasa Sains dan Teknologi, Agustus 2010, pp. 27-41.
[2]Riki Mukhaiyar, “Pengembangan Fungsi Sistem Klasifikasi Citra Satelit untuk Aplikasi Sistem Informasi Geografis”, Tesis - ITB, Februari 2003.
[3]Dyah Marganingrum, “Studi Perilaku Dinamis Ketersediaan Air Sungai Brantas dalam Memenuhi Kebutuhan Air Baku dan Menanggung Beban Pencemaran dengan Pendekatan Metodologi Sistem Dinamis”, Tesis – ITB, 2000.
[4]Bappedalda DKI Jakarta, “Regional Action Plan Prokasih Vision of Ciliwung River 2005”, 2001.