EXTERNALITIES INCLUSION INTO PRODUCTION COST OF SYSTEM OF RICE INTENSIFICATION
Memperhitungkan Eksternalitas ke Biaya Produksi Usaha Tani
System of Rice Intensification
Mohamad Maulana*
Indonesian Center for Agricultural Socio Economic and Policy Studies Jln. A. Yani No. 70, Bogor 16161, Jawa Barat, Indonesia
*Corresponding author. Email: [email protected]
Diterima: 6 Januari 2016 Direvisi: 29 Januari 2016 Disetujui terbit: 7 Maret 2016
ABSTRAK
Usaha tani padi menghasilkan eksternalitas lingkungan yang bersifat negatif. Eksternalitas tersebut merupakan biaya dan tidak dihitung dengan harga pasar sehingga nilai ekonominya tidak diketahui. Tujuan penelitian ini adalah untuk menghitung dan memasukkan biaya eksternalitas negatif tersebut ke dalam biaya produksi usaha tani System of Rice Intensification (SRI) yang berbasis penerapan usaha tani padi organik. Jenis-jenis eksternalitas negatif yang diukur dalam riset ini meliputi CH4, N2O, SO2, NOx, dan PM10. Dalam riset ini
digunakan metode Life Cycle Analysis (LCA) dan pendekatan biaya kerusakan yang ditimbulkan oleh polutan serta konsep biaya sosial. Riset dilakukan di Desa Dlingo, Kabupaten Boyolali, Jawa Tengah. Hasil riset menunjukkan bahwa biaya produksi 1 kg GKP adalah Rp1.529/kg. Dengan biaya kerusakan yang dihitung dan dimasukkan ke dalam biaya produksi mencapai Rp9/kg, maka biaya sosial memproduksi 1 kg GKP adalah Rp1.539/kg atau Rp9,60 juta/ha/musim. Keuntungan bersih setelah memasukkan biaya eksternalitas yang diperoleh petani SRI mencapai Rp18,04 juta/ha/musim. Dengan menggunakan target perluasan wilayah SRI pada tahun 2015 sebesar 200.000 ha, maka pemerintah dapat memperoleh keuntungan Rp44,51 miliar.
Kata kunci: System of Rice Intensification, Life Cycle Analysis, penggabungan, nilai eksternalitas, biaya sosial
ABSTRACT
Rice production process generates negative environmental externalities. These externalities are considered as a cost and not accounted by market price such that its economic externalities value is unknown. This study aims to calculate and to internalize negative externalities costs into production costs of the System of Rice Intensification as a rice production process based on organic practices. The quantities of externalities measured in this research are CH4, N2O, SO2, NOx, and PM10. This research uses a Life Cycle Analysis (LCA), a damage
cost approach, and a social costs concept. This research was conducted in Dlingo Village, Boyolali Regency, Central Java Province. The results show that the private cost per kg of unhulled rice was Rp1,529 and damage cost was Rp9/kg. Social costs of producing 1 kg of unhulled rice was Rp1,539 or Rp9.60 million/ha/season. SRI‟s farmers received net social benefit of Rp18.04 million/ha/season. Considering that the target of extended area for SRI in 2015 was 200,000 ha, government could receive environmental benefits of Rp44.51 billion.
Keywords: System of Rice Intensification, Life Cycle Analysis, inclusion, externalities, social costs
INTRODUCTION
One of the programs in agricultural farming policy that has been disseminated by the Ministry of Agriculture is the System of Rice Intensification (SRI) (Ministry of Agriculture 2014). The System of Rice Intensification is considered to be a more environmentally friendly agricultural practice compared to the conventional rice farming system since SRI is based on organic practices. Further, the organic agriculture concept is based on methods used that respectful environment in all production phases and distributing system to the
consumers. Practically, the organic agriculture is referred to minimize external inputs use and avoid chemical or synthetic fertilizer and pesticides. Even though, organic agricultural product is considered not to entirely free of residues related to the general environment pollution. The organic rice production is not only distressed with the product, but also concerned with whole agribusiness rice system (Scialabb and Hattam 2002).
Agriculture produces environmental externalities. The environmental externality is an
people. There are positive and negative environmental externalities, but in this research, our focus is only for negative externalities. The negative environmental externalities are a cost. It is paid but not by farmers in the case of rice production system, or by consumers (DeWitt 1990). Most of the negative environmental externalities are not accounted by market price and the economic value of externalities is unknown (FAO 2001; Lv et al. 2009).
Green House Gases (GHGs), non-GHGs, and other substrates that have environmental impact categories resulted by both conventional rice production systems and SRI, are some examples of negative externalities (Craighill and Powell 1996; de Boer 2003; Lv et al. 2009; Blengini and Busto 2009). The negative environmental impacts are categorized into global warming impact, acidification, and nitrification or eutrophication. Acidification is the discharging of emission of gasses into the air and when mixed with other molecules in the atmosphere resulting in acidification of ecosystems (Craighill and Powell 1996; de Boer 2003). The higher the emissions of acidification pollutants meant the increase of aluminum concentration in ground water and it affected the growth of root of crops, and at the end increased the potential of crop damage because of diseases and drought. The increasing concentration of aluminum in ground water will
be toxic to human and animal‟s life. Nitrogen
nitrification will agitate the balance of nutrient composition in soil that can lead to the increase in vegetation composition into abundant nitrogen loving species. Enhancing the level of nitrogen in nitrate form into the groundwater consumed by human will cause oxygen deficiency in human blood particularly for children. Higher phosphorus eutrophication increases the growth of algae and plants and when they die, the microbial degradation will decrease the amount of oxygen in the water that decreasing the capacity of water to maintain life (de Boer 2003).
In economics, negative environmental externalities are real costs. They are considered to be very important and should not be ignored (DeWitt 1990). Therefore, government must have some policies or plans to anticipate the environmental damage impacting on the
society‟s daily life. Hence, raising society„s
awareness on reducing the impact of negative environmental externalities by monetizing the quantity of externalities is important. There are plentiful studies related to the measurement of greenhouse gas emissions from rice fields. Most of these studies calculated the magnitude of methane (CH4) and nitrous oxides (N0x) (Wang
1993; Lindau 1994; Neue 1997; Dan et al. 2001; Kruger and Frenzel 2003; Sahrawat 2004; Huang et al. 2009; Johnson-Beebout et al. 2009; Setyanto and Kartikawati 2011; Setyanto et al. 2012).
Related to economic value, the concept of social costs that take into consideration externalities cost and internalize into production cost, needs to be performed. Rice farmers are easier to understand the benefits of implementing SRI if environmental impact assessments of SRI should be presented in economic value (Chernick and Caverhill 1990). Economic benefits of practicing SRI should be delivered as policy advices to the Ministry of Agriculture in order to start to deeply consider the negative environment externalities in the conventional rice production system instead of focusing only on skyrocketing rice production with neglecting negative environmental impacts.
The objective of the study was to calculate the inclusion of the externalities costs into production costs of the SRI for producing 1 kg unhulled rice. Within the context of the research objective, the following main research question was formulated: How much are the social costs of producing 1 kg unhulled rice using SRI compared with conventional practice? Specifically, this research was carried out to answer the following sub research questions. (1) How much are the private production costs for producing 1 kg unhulled rice using SRI and conventional rice farming system? (2) How high are the level and the damage cost of Green House Gases (GHGs) and non-GHGs emissions for producing 1 kg unhulled rice using SRI? (3) environment, but also associated from environment to economy. This two-sided interaction between economic and environment has a prime benefit that it could exhibit the optimal environmental policy calculation which shows the equal of marginal cost and marginal benefit of pollution abatement (Zhu 2014).
systems also create pollution in the form of air or water pollution and other liquid and solid wastes. These pollutions may have an impact on production and also the availability of inputs that can be used in production process. Furthermore, it can affect on human health. Productivity will decrease, and economic cost will increase, due to higher health care allowance and decrease the amount of labor supply and labor productivity (Haites 1990; Rennings and Wiggering 1997; Farber et al. 2002).
Related to the connection of environment and economy or production, Ministry of Agriculture of Indonesia has been implementing agricultural farming policies and has launched System of Rice Intensification (SRI) program to boost rice production and to bridge agriculture and environment. The main differences between the SRI and conventional rice production system that farmers commonly practiced are SRI use less amount of water, no chemical fertilizers used in the entire system, no chemical pesticide, insecticide and herbicide. In general, it can be said that SRI is an organic rice farming system.
Although the SRI is declared by the Ministry of Agriculture as an organic system, it should be assessed that this system has less negative environmental externalities compared to conventional one because the negative externalities could harm the environment and impact on human and animal health. Social costs were calculated in order to know the weaknesses and benefit of a system while considering externalities in production cost calculation.
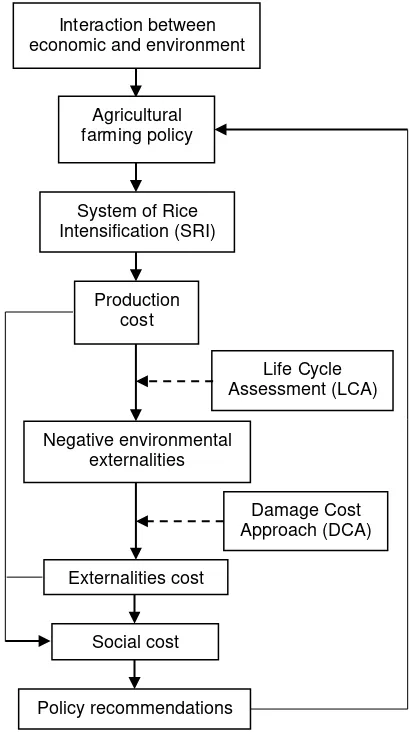
The first step in this study was to calculate the production cost per functional unit of measurement for SRI. By using Life Cycle Assessment (LCA) approach, this study, then examines fossil fuel and inputs use in the SRI, and externalities resulted (Figure 1). Because the unit of measurement of each pollutant was different, the damage cost approach was used to monetize the environmental externalities in order to generate externalities cost. This means, the different units of the quantity of externalities are calculated in the same unit of measurement because in LCA, there is an essential problem that environment impacts are measured in different units, or in non-comparable units (Craighill and Powell 1996).
Finally, the social costs of SRI that includes production cost and damage cost, were calculated. Then, policy recommendations were proposed to the Ministry of Agriculture in order to
accelerate the dissemination of rice farming system which is more environmentally friendly practice.
Life Cycle Assessment
Life cycle assessment is an approach that examines the environmental performance of a product, begins from assembling raw material from the earth to generate products and ends with returning all materials to the earth. LCA assesses throughout a product life cycle and accumulates environmental impacts creating from each stage of product life cycle. Technically, this technique can evaluate environmental aspects and impacts of gathering energy and material inputs released by a product life cycle, assessing potential environmental impacts from material inputs and discharges, interpreting the results to assist policy-makers in making decisions (SAIC 2006).
Interaction between economic and environment
Agricultural farming policy
System of Rice Intensification (SRI)
Life Cycle Assessment (LCA) Production
cost
Negative environmental externalities
Damage Cost Approach (DCA)
Externalities cost
Social cost
Policy recommendations
In its development and usage, LCA is used not only for collecting raw materials and inputs, and improving the environmental impacts of a product, but also for comparing the environmental impact of different products or systems (Craighill and Powell 1996; de Boer 2003). Life Cycle Assessment is a systematic approach and encompasses four main stages, namely the goal definition and scoping, life cycle inventory (LCI), life cycle impact assessment (LCIA) and interpreting the results (SAIC 2006). The goal definition and scoping phase explains the objectives, scope, and boundaries of two rice production systems, the functional unit, assump-tions, and limitations in this research. The purpose of performing an LCA is to calculate the production of 1 kg unhulled rice by implementing SRI. The results of this LCA are used to support the expansion of the SRI dissemination that the Ministry of Agriculture of Republic of Indonesia has been carrying out to the date. The data used in this study are obtained by performing a case study for LCI and also the published data related to the production process.
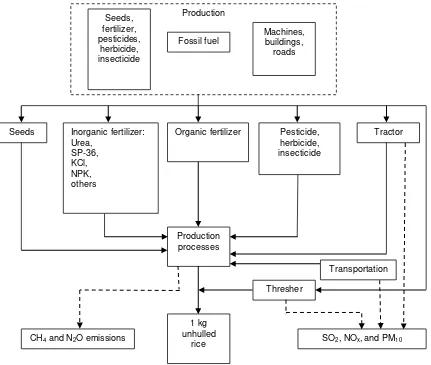
The life cycle of SRI is exhibited in Figure 2. Preferably, an LCA examined the environmental impacts in all stages of the life cycle of a product. However, related to the study that calculated the social costs of SRI, this LCA only assessed environmental externalities from production machines and transportation use, driving energy such as gasoline (mentioned as energy use), and production processes relevant to produce 1 kg of unhulled rice.
This „cradle to farm gate‟ flowchart (Harjanto
et al. 2012), excluded the production process of seeds, insecticide, pesticide, herbicide, fertilizer, machines and buildings. Functional unit represents a unit of environmental impact measurement on rice production system. The functional unit is defined in terms of impact category and the objectives of the study. The functional unit is one kg of unhulled rice.
Life Cycle Inventory (LCI) is a process that produces a list of quantities of pollutants discharged to environment, material, and energy use. Life cycle inventory is performed as a basis
Seeds Inorganic fertilizer: Urea,
SP-36, KCl, NPK, others
Pesticide, herbicide, insecticide
Tractor Organic fertilizer
Production Seeds,
fertilizer, pesticides,
herbicide, insecticide
Fossil fuel
Machines, buildings,
roads
Production processes
Transportation
Thresher
1 kg unhulled
rice SO2, NOx,and PM10
emissions CH4 and N2O emissions
to assess comparative environmental impacts or potential improvement. There are four steps in conducting a life cycle inventory, namely building a flowchart of production system, setting a data collection plan, compiling data, and evaluating reporting results (SAIC 2006). A flowchart of rice production system (Figure 2) is developed to show inputs use and output resulted in SRI. Material and energy use, and also category of environmental discharge from both systems are explained. In both systems, this study assumes that there are no co-products.
In calculating the quantity of externalities in SRI, gaseous emissions from production practices, transport stages of bringing inputs and distributing output, the use of gasoline and diesel for operating tractors, cars, motorcycles and threshers are calculated because it has a contribution to environmental impacts. Life Cycle Impact Assessment (LCIA) is not performed in this research.
Damage Cost Approach
There are two approaches that can be performed to estimate the social costs from environmental impacts. Firstly, an approach based on prevention costs and secondly, approach based on estimated damages (Haites 1990). Haites (1990) added that the first approach is based on the proxy of prevention
measures for the amount of society‟s willingness
to pay not to have the environmental impacts. The second approach is using the damage estimation, in this research, implementing rice farming systems and social costs should reflect this damage. This study used the damage cost approach by internalizing external cost into the whole production cost of SRI in order to analyze how much the net social benefit farmers could receive.
Damage cost approach is about to monetize environmental externalities, which presents an estimation of external cost. The environmental externalities is then stated as a cost per unit of externality, for instance, as Rp/kg of emissions or Rp/MJ or Rp/kWh of energy consumed (Rp = Indonesian Rupiah) (Chernick and Caverhill 1990).
Damage cost approach is carried out to monetize the damages resulted by discharging gaseous and non-gaseous emissions. This study drives an approximation of externalities costs of producing 1 kg unhulled rice. The damage cost of each externality was multiplied by the physical parameter to generate externalities value from each type of pollutants. In this research,
pollutants scrutinized are CH4 and N2O for GHGs due to its highest emission released from paddy field (Khalil et al. 1991; Wang et al. 1992; Lindau 1994; Neue 1994; Dan et al. 2001; Kruger and Frenzel 2003; Setyanto 2004; Setyanto and Kartikawati 2008; Johnson-Beebout et al. 2009; Wihardjaka et al. 2010; Wihardjaka 2010; Ariani et al. 2011; Setyanto et al. 2012), and SO2, NOx, and PM10 for non-GHGs (Sahrawat 2004; Lv et al. 2010; Husnain et al. 2014). The social cost was calculated by summing up the production cost and the damage cost of various externalities.
Data Collection
To answer sub research question 1, interview with 50 SRI farmers that selected randomly on the study site, were carried out in order to collect input data and fuel use, and also unhulled rice production. Meanwhile, for conventional practice as a comparison, this research used study of literature. After Dlingo Village in Boyolali Regency, Central Java Province was determined, an area in Dlingo Village was chosen for GHGs and non-GHGs analysis. SRI area was selected to be very close to two-neared springs and its location has terracing land contours, in order to avoid chemical matter contamination from conventional area.
In the area, one hectare plot was selected for sample taking. In each plot, three points were chosen based on the same age of paddy and paddy variety. However, three plots consisted of paddy field, and planted by the same paddy variety, i.e. IR64. The sample of GHGs and non-GHGs were then taken from these three plots for each area by a researcher and assisted by two technicians.
For collecting input-output data, from five farmer groups existed in Dlingo Village, one Researcher, accompanied by one research assistant, visited farmers one by one to be interviewed by using a questionnaire in terms of gathering input-output inventory.
samples were taken by using the closed chamber method (Setyanto and Kartikawati, 2011; Ariani et al. 2011; Husnain et al. 2014) and analyzed in the laboratory by using the gas chromatography device. The GHGs samples were taken three times: firstly, when the age of paddy was 35 days after planting; secondly was 65 days after planting; and thirdly was 95 days chromatography. Field observations were carried out during October–March 2014/2015 paddy season.
For non-GHGs, its emissions are calculated by using the quantity of inputs and gasoline data taken from interview with farmers, multiplied by emission factors. In addition, this study used published data about the coefficient that were used to transform the quantity of GHGs and non-GHGs emission into homogenous unit. This study did not measure the damage costs directly from the field observation in order to determine externalities cost, but using the published damage cost. question 2, were summed up to exhibit the social costs. Finally, policy advices were performed in order to accelerate SRI dissemination.
This study, then, selected Boyolali Regency, because paddy farmers in some locations in Boyolali have followed SRI training, implemented SRI techniques, and in 2012–2013, Boyolali Farmers Association has received the International Market Ecology Organization (IMO) certificate and their organic rice production has been exported to Belgium.
Data Analysis
After the number of inputs and gasoline use were obtained, as part of the LCI, the quantity of pollutants discharged to the environment was
calculated. The information of CH4 and N2O concentration taken from the study site were provided, and subsequently calculated flux and emissions of each pollutant. Furthermore, SO2, concentration were obtained from field observation by using the closed chamber method and analyzed by gas chromatography device. Secondly, flux for each pollutant was calculated by using a formula explained in Eq. 1. Thirdly, emission of CH4 and N2O are estimated by using emission estimated formula explained in Eq. 2.
The CH4 and N2O‟s flux mean the estimated numbers on how much gas flowing out from paddy plants or land to air (Setyanto et al. 1999; Setyanto 2014). The concentration rates of CH4 and N2O for C0-35, C36-65, and C66-95 categories are used in calculating flux. Subsequently, CH4 and N2O flux are calculated by using a formula (IAEA 1993; Setyanto et al. 1999; Setyanto 2004; Setyanto 2014) as follows (Eq. 1):
... (1)
Notations in the formula are explained below: F = flux of CH4 and N2O gas (mg/m2/day)
= average temperature during sampling (°C)
Egas = estimated gas emission (kg/ha/season) F0-35, F36-65, F66-95 = cumulative flux of 0-35,
35-65 and 66-95 days after planting
N = age of seed (days after planting)
Ls = last day sampling (days after planting)
H = age of paddy until harvesting
By using Global Warming Potential (GWP) concept supported by the Intergovernmental Panel on Climate Change (IPCC), the quantity of gaseous emission is transformed into carbon dioxide (CO2) equivalent. The GWP is a concept that accounts the effect of gaseous emissions over the whole sphere and the changes of gaseous concentration over time. This study used a 100 year basis of the GWP concept to determine the carbon dioxide equivalent value of CO2 for CH4 and N20 gases resulted from SRI Powell 1996). Due to the lack of coefficient data for PM10, the quantity of PM10 did not transfer into hydrogen ion mass equivalent. The sum of hydrogen ion mass equivalent is considered as the total environmental impact of acidification.
Economic evaluation to estimate the value of each GHGs and non-GHGs emission in each rice production system was calculated by multiplying the quantity of each gas emission with the damage values for calculating the external costs. The damage costs estimation was obtained from study literature and it was based on the condition in the UK. The damage cost for each pollutant were CO2 = £0.004/kg, CH4 = £0.072/kg and N20 = £0.614/kg (Craighill and Powell 1996); SO2 = £2.58/kg, NOx = £1.27/kg, PM10 (particulates less than 10 µm on diameter) = £8.98/kg (CEC 1994). determined from implementing SRI. The results from LCA and economic evaluations were combined with information obtained from interview results descriptively to produce policy recommendation on how to deliver the economic benefits to the farmers implementing the SRI.
RESULTS AND DISCUSSION
Input–Output Inventory
In this part, the explanations are delivered by comparing the technical instruction book of SRI implementation released by Ministry of Agriculture of Indonesia, and training of trainer book issued by VECO Indonesia, with the results of field observation in Dlingo Village. VECO Indonesia is an NGO that dedicated its activities to develop organic rice farming, especially in Boyolali Regency. There are five types of input group explained in this part, i.e. seeds, organic fertilizers, chemical fertilizers, chemicals, and gasoline. The use of diesel for operating tractors was obtained from Simatupang et al. (2009). Inputs use per ha are shown in Table 1.
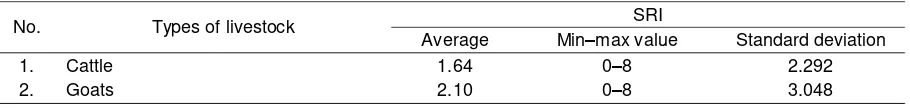
Some farmers who did not have cattle or goats, but wanted to use cattle and goat manure, must bought cattle or goat manure from their neighbors who had cattle or goats manure surplus (Table 2). The average cattle manure price was Rp753/kg. Farmers also could buy organic fertilizer produced by a fertilizer factory in agricultural kiosks in the village, but they did not do it and preferred to use animal waste in order to minimize production cost.
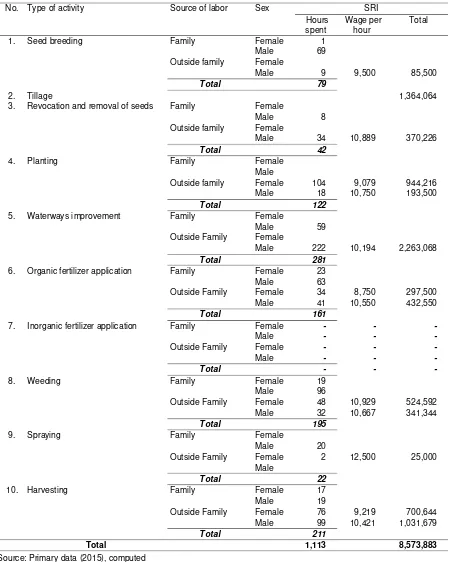
The information about labor use was shown in 10 farming activities, namely seed breeding, tillage, revocation and removal of seeds, planting, waterways improvement, organic fertilizer application, inorganic fertilizer application, weeding, spraying, and harvesting. The use of labors was provided in working hours. Maximum working hour per day was 8 hours. This information was divided by source of labor (family labor or outside family labor) and sex (male or female). This study assumed that family labors were not paid by farmers. The wage was the average wage for each farming activity per hour, and including meals and cigarettes given by farmers for each labor.
Other Costs
Other costs were defined as the costs that were not included in input or labor costs such as land tax, bag for packing unhulled rice, needle and thread for tailoring bag, pump because a few farmers used pump for watering their paddy field, and others, to cover small amount costs during the farming process (Table 4). Land tax was imposed to each land that used for growing paddy. The amount of land tax was different for each land depends on its location. If the land is fertile according to the village officials‟ survey and close to the village‟s main road, the land tax is more expensive and vice versa.
The costs of bag, needle, and thread for conventional system were high because farmers bought new bags for each season. Meanwhile, pump cost was spent by SRI farmers because a few farmers‟ land locations needed to use a pump to siphon water due to their land location in terracing area. The spread of other costs data was high, especially for pumping cost and other production costs. Table 4 showed each item of the other costs data.
Production and Benefit
The production of unhulled rice per ha for SRI was 6.24 tonnes/ha, while for the common rice production system, or conventional rice production system, was 6.57 tonnes/ha (for
conventional system, data taken from Maulana [2015]). Minor difference of production between SRI system and a conventional system ensued because most of SRI farmers have implemented SRI system since 2006. The paddy production will decrease in the first 2–3 years after farmers decided to alter their farming system from conventional to SRI or organic system. After 3 years of implementing SRI, the paddy production will increase until it is close to conventional production (Scialabb and Hattam 2002; Setyanto 2004; Ministry of Public Works of Republic of Indonesia 2009; Mayrowani 2013). Although SRI farmers in this study informed that SRI paddy production has not ever surpassed the conventional paddy production, some research results showed different information revealing that paddy production increased while farmers implement SRI method compared to conventional system (Uphoff 2005; Kabir and Uphoff 2007; Sharif 2011; Cornell Chronicle 2013; Uphoff 2015).
The average price of unhulled rice per ha was also different between SRI and conventional system. The price of SRI‟s unhulled rice was Rp4,433/kg, higher than conventional unhulled rice production (Rp4,333/kg, Maulana [2015]). The higher price received by SRI farmers took place because SRI farmers have already had a
„promise‟ from buyers (in this case, the buyer is Boyolali Organic Farmers Alliance or APPOLI). Table 1. The use of inputs per ha on wetland paddy in Dlingo Village, 2015
No. Type of input SRI
Unit Volume Price/unit Value
1. Seeds kg 34 8,333 283,322
2. Organic Fertilizers kg 3,980
3. Chemical Fertilizers:
N (Urea) kg
P2O5 (SP-36) kg 1 2,200 2,200
K2O (ZA) kg
NPK kg
Others kg 1 3,000 3,000
4. Chemicals Rp
5. Gasoline liter 15 7,500 109,500
Total 398,022
Source: Primary data (2015), computed.
Table 2. The average number of cattle and goats nurtured by each farmer in Dlingo Village, 2014 (head)
No. Types of livestock SRI
Average Min–max value Standard deviation
1. Cattle 1.64 0–8 2.292
2. Goats 2.10 0–8 3.048
The „promise‟ did not mean a written contract, but a deal between farmers and buyer that if farmers planted paddy with the same variety as the buyers wanted to buy in harvesting season, farmers will receive higher price than the price implemented at the time farmers harvested. However, if SRI farmers did not sell their unhulled rice to APPOLI but to other buyers or to
open market, they will receive the same price as conventional product or the price that applied at the time farmers sold their product.
Farmers private revenue was calculated by multiplying the average of price per kg with the average of total unhulled rice per ha. Farmer‟s private revenue was Rp27.64 million/ha/season, Table 3. Labor cost per ha on wetland paddy in Dlingo Village, 2015
No. Type of activity Source of labor Sex SRI
Hours spent
Wage per hour
Total
1. Seed breeding Family Female 1
Male 69
Outside family Female
Male 9 9,500 85,500
Total 79
2. Tillage 1,364,064
3. Revocation and removal of seeds Family Female
Male 8
Outside family Female
Male 34 10,889 370,226
Total 42
4. Planting Family Female
Male
Outside family Female 104 9,079 944,216
Male 18 10,750 193,500
Total 122
5. Waterways improvement Family Female
Male 59
Outside Family Female
Male 222 10,194 2,263,068
Total 281
6. Organic fertilizer application Family Female 23
Male 63
Outside Family Female 34 8,750 297,500
Male 41 10,550 432,550
Total 161
7. Inorganic fertilizer application Family Female - - -
Male - - -
Outside Family Female - - -
Male - - -
Total - - -
8. Weeding Family Female 19
Male 96
Outside Family Female 48 10,929 524,592
Male 32 10,667 341,344
Total 195
9. Spraying Family Female
Male 20
Outside Family Female 2 12,500 25,000 Male
Total 22
10. Harvesting Family Female 17
Male 19
Outside Family Female 76 9,219 700,644 Male 99 10,421 1,031,679
Total 211
Total 1,113 8,573,883
while farmers‟ benefit was Rp18.1 million/ha/season.
GHGs and non-GHGs Emission Concentration of CH4 and N2O
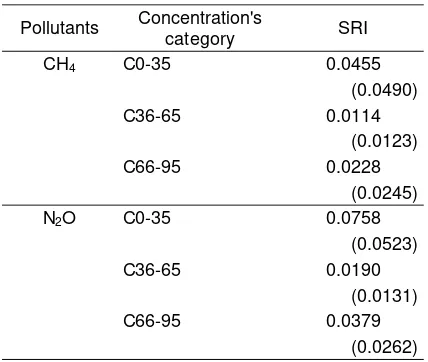
To calculate CH4 and N2O fluxes, the rate of CH4 and N2O concentration were accounted first. The concentration of CH4 was obtained from three points (three sample locations) in a 1 ha plot. The concentration of N2O was also gained from the same points. By taking gas samples for every 5 minutes until 25 minutes, the concentration of CH4 was taken from each point. Meanwhile, for N2O, gas sample was taken for every 10 minutes until 50 minutes. The measurement of GHGs concentration is calculated in three categories, i.e. firstly, when the age of paddy was 35 days after planting (namely C0-35); secondly, the age of paddy was 65 days after planting (namely C36-65); and thirdly, when paddy was 95 days after planting (namely C66-95).The concentration rate of CH4 and N2O can be seen in Table 5.
Properties for Calculating Flux
There are some properties that should be measured to calculate flux, i.e. the height of CH4 and N2O chamber used in taking sample process, the weight of CH4 and N2O molecules, constant volume of CH4 and N2O's molecule, and average temperature during sampling. These properties are measured in order to determine all parameters needed in flux‟s formula in Eq 1.
The height of CH4 and N2O chambers were taken from the field. CH4 chamber was 103 cm or 1.03 m. Meanwhile, the height of N2O chamber was 20 cm or 0.2 m. The weight of CH4 and N2O molecules were obtained from the literature (Khalil et al. 1991; IAEA 1993; Setyanto 2004). Constant volume of CH4 and N2O's molecules was obtained from Avogadro‟s
Law stating that “the principle that equal volumes
of all gases at the same time temperature and pressure contain the same number of
molecules.” Thus, the molar volume of all ideal gases at 0 °C and a pressure of 1 atm is 22.4
liters” or 22.41 × 10⁻³ m3 according to IAEA (1993). Average temperatures were obtained from field observation, and measured in the
degree of Celsius. In the GHGs‟ flux calculation,
the average temperature was converted to the degree of Kelvin. Table 6 showed all properties for calculating CH4 and N2O flux for SRI.
CH4 and N2O Flux
The flux of CH4 and N2O for each growing phase was shown in Table 7. The „F‟ notation in the table means flux and F0-35 refers to flux at the age of 0–35 days after planting, F36-65 is in flux at the age of 36–65 days after planting, and F66-95 means flux at the age of 66–95 days after planting.
Table 4. Other costs per ha on wetland paddy in Dlingo Village, 2015
No. Type of other costs Unit SRI Conventional
1. Land tax Rp 78,047 104,626
2. Bag Rp 181,742 234,023
3. Needle and thread Rp 28,731 57,572
4. Pump Rp 124,636 ===
5. Others Rp 152,636 196,658
Total Rp 565,792 592,879
Source: Primary data (2015), computed
Table 5. The concentration rate of CH4 (ppm) and N2O (ppb) per minute for SRI in Dlingo Village, 2015
Pollutants Concentration's
category SRI
CH4 C0-35 0.0455
(0.0490)
C36-65 0.0114
(0.0123)
C66-95 0.0228
(0.0245)
N2O C0-35 0.0758
(0.0523)
C36-65 0.0190
(0.0131)
C66-95 0.0379
(0.0262)
Source: Primary data (2015), computed,
The CH4 and N2O flux showed the lower results from other findings. Ly et al. (2013) showed that CH4 flux in a paddy field in Cambodia was between 200 and 400 mg/m2/day and N2O fluxes varied between 7 and -6 mg/m2/day. Ly et al. (2013) also revealed that CH4 flux for SRI was higher than CH4 flux for conventional rice farming system. The same results also exhibited by Setyanto and Kartikawati (2008), explained that the highest CH4 flux in SRI in Pati Regency, Central Java Province in Indonesia, was only 455 mg/m2/day and for a conventional system, it could reach 633.8 mg/m2/day. Setyanto and Kartikawati (2008) also explained that the CH4 flux in paddy field was increased in the beginning of days planted, decreased at 65 days and slightly increased on days before harvesting time. However, Towprayoon et al. (2005) outlined that average fluxes of CH4 in a paddy field in the central plain of Thailand were only 140–218 mg/m2/day, or lower compared to Ly et al. (2013) and Setyanto and Kartikawati (2008) findings. CH4 and N2O Emission
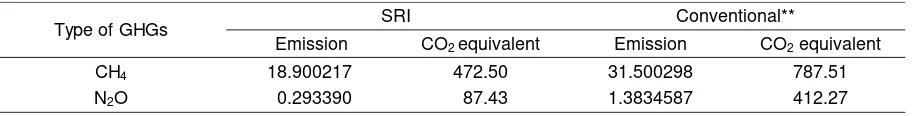
The estimation of CH4 and N2O emissions for SRI was shown in Table 8. The calculation of CO2 equivalent was performed by multiplying the emission of each gas with a coefficient of Global Warming Potential (GWP) for each gas, which is 25 for CH4 and 298 for N2O (Craighill and Powell 1996; Setyanto 2004; Lv et al. 2010). After CO2 equivalent for both gases were determined, it can be understood that N2O emission was higher than CH4 emission (Table 8).
The calculation of CH4 emissions was lower compared to Setyanto and Kartikawati (2008)
findings, which was 60.73 ± 9.13 kg/ha/season. Khalil et al. (1998) outlined that methane emission reached its highest rate at 100 kg/ha/season around the time of flowering and dropped slowly to reach 10 kg/ha/season at harvest time. The two most important factors to explain the volatilization of methane emission were soil temperature variations and fertilizer application. The higher GHGs emission of conventional system drove higher impacts on rising global temperature on earth and it might affect human health, animal and crop life, and ecosystems (Craighill and Powell 1996; FAO 2001; Scialabb and Hattam 2002; de Boer 2003; Lv et al. 2010). Comparing the emission of GHGs pollutant between SRI and conventional practice showed that SRI emission is lower than conventional practice.
In SRI, intermittent water management is applied, having an impact on less water use in farming practice. By applying reducing water use Table 6. Properties for calculating CH4 and N2O flux for SRI in Dlingo Village, 2015
No. Items Unit SRI
1. CH4 box's height m 1.03
2. N2O box's height m 0.2
3. CH4's molecule weight mg 16.12 x 10³
4. N2O's molecule weight mg 44.01 x 10³
5. Constant volume of CH4 and N2O's molecule m3 22.41 x 10⁻³
6. Average temperature during sampling Kelvin's degree 303.60
Source: Primary data (2015), computed.
Table 7. The CH4 and N2O‟s flux in three growing phases (mg/m2/day) in Dlingo Village, 2015
Pollutants Flux's category Flux
CH4
F0-35 43.4731
F36-65 10.8683
F66-95 21.7365
N2O
F0-35 0.6400
F36-65 0.1600
F66-95 0.3200
Source: Primary data (2015), computed.
Table 8. CH4 and N2O emission (kg/ha/season) and CO2 equivalent for SRI in Dlingo Village, 2015
Type of GHGs SRI Conventional**
Emission CO2 equivalent Emission CO2 equivalent
CH4 18.900217 472.50 31.500298 787.51
N2O 0.293390 87.43 1.3834587 412.27
Source: Primary data (2015), computed.
in paddy farming system, it will cut CH4 emissions. Some research results exhibited that intermittent water management in SRI reduced soil population methanogens which is bacteria synthesizing CH4, and increased methanotrophs population that is aerobic bacteria that ingest CH4 (Rajkishore et al. 2013; Uphoff 2015). Emission of SO2, NOx,and PM10
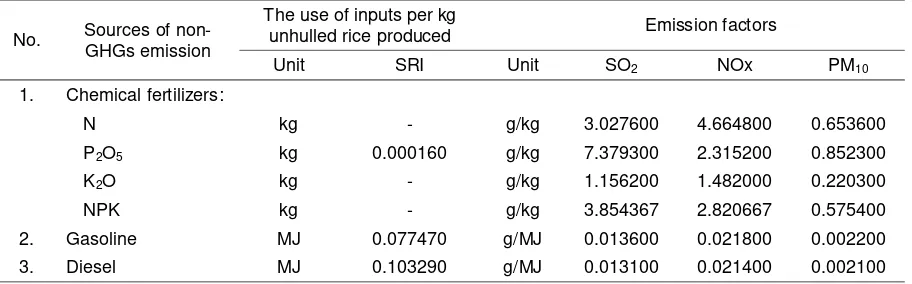
After calculating GHGs emission in the previous phase, this phase estimated non-GHGs emissions. Firstly, chemical fertilizers, gasoline, and diesel were considered as the sources of SO2, NOx, and PM10, or non-GHGs emissions. There were four kinds of chemical fertilizers, i.e. N, P2O5, K2O, and NPK (contain 15%N, 15% P2O5, and 15%K2O). The use of chemical fertilizers, gasoline, and diesel per kg unhulled rice produced were obtained from input-output analysis. Table 9 provides the use of chemical fertilizers (N, P2O5, K2O, and NPK), gasoline, and diesel per kg unhulled rice produced.
Secondly, emission factors of SO2, NOx and PM10, which were explained as numbers showing the estimation on how much emission of each unit non-GHGs (Haites 1990; Le et al. 2013), were determined for each source of non-GHGs emissions. The emission factors were taken from GREET database and have ever been applied by Le et al. 2013. The emission factors for calculating non-GHGs emissions were shown in Table 9.
Thirdly, SO2, NOx,and PM10 emissions were calculated by multiplying the use of chemical fertilizers, gasoline, and diesel per kg unhulled rice produced and the emission factors. In this study, emissions from the production of chemical inputs, organic fertilizers, and other insignificant inputs were disregarded due to the lack of emission factors data. Information in Table 10 showed the amount of emission per kg for each
type of non-GHGs. The estimation of H+ equivalent for each non-GHGs emission was calculated by multiplying each non-GHGs emission with coefficients of 31.3 for SO2 and 21.7 for NOx (Craighill and Powell 1996). The results can be seen in Table 10. Comparing the emission of non-GHGs pollutant between SRI and conventional practice showed that SRI emission is lower than conventional practice.
Damage Cost
Due to the lack of damage costs of GHGs and non-GHGs data in Indonesia, this study applied proxies for damage costs. This research used damage costs in the UK from Craighill and Powell (1996) and adjusted the damage costs for Indonesia. This study applied the same method as Leet al. (2013) performed that used gross domestic product (GDP) per capita and population density as two adjusting factors based on the assumption that the difference between the UK and Indonesia regarding willingness to pay and physical damage per kg pollutant as two foundations in calculating damage costs, could be reflected by these two adjusting factors. The ratios of GDP per capita (PPP) and population density between the UK and Indonesia were used as two adjusting factors. Damage costs for UK multiplied by adjusting factors were calculated to exhibit damage costs for Indonesia. It is shown in Table 11.
Total damage costs of each pollutant for SRI and conventional system were calculated by multiplying damage costs for Indonesia from Table 11, with CH4 and N2O emission stated in Table 9 for GHGs, and SO2, NOx, and PM10 emissions showed in Table 10 for non-GHGs. Total damage costs for SRI and conventional system are counted by adding up the damage cost from each pollutant. Total damage costs are Table 9. Chemical fertilizers, gasoline, and diesel use per kg unhulled rice produced and emission
factors of non-GHGs in Dlingo Village, 2015
No. Sources of non-GHGs emission
The use of inputs per kg
unhulled rice produced Emission factors
Unit SRI Unit SO2 NOx PM10
1. Chemical fertilizers:
N kg - g/kg 3.027600 4.664800 0.653600
P2O5 kg 0.000160 g/kg 7.379300 2.315200 0.852300
K2O kg - g/kg 1.156200 1.482000 0.220300
NPK kg - g/kg 3.854367 2.820667 0.575400
2. Gasoline MJ 0.077470 g/MJ 0.013600 0.021800 0.002200
3. Diesel MJ 0.103290 g/MJ 0.013100 0.021400 0.002100
measured on per kg unhulled rice and per ha paddy field (Table 12). Comparing the damage costs of GHGs pollutants and non-GHGs pollutant between SRI and conventional practice showed that conventional damage cost was higher than conventional practice.
Social Costs
This chapter provided the calculation of social costs by internalizing the damage costs. Social costs for SRI were calculated by adding up private cost and damage costs. Social costs were measured for per kg unhulled rice and per ha paddy field. Private costs per kg unhulled rice
were calculated by adding up input costs, labor costs and other costs, and divided by total unhulled rice production. Private cost per kg was Rp1,529/kg unhulled rice (Table 13).
In calculating SRI‟s private cost, this research showed that labor cost (its share of total production cost was 70%) and organic fertilizer costs (16%) became two important calculations due to its highest share. In Dlingo Village case, almost all SRI farmers had cattle and/or goats, and used cattle waste and goat waste as organic fertilizers. A few SRI farmers also used compost as organic fertilizer. SRI farmers did not have to buy the organic fertilizer because the amount of organic fertilizer was abundant. SRI farmers Table 10. SO2, NOx, and PM10 emission (kg/ha/season)
Type of non-GHGs SRI Conventional
a
Emission H+ equivalent Emission H+ equivalent
SO2 0.0000036 0.0001123 0.0002151 0.0067337
NOx 0.0000043 0.0000927 0.0002124 0.0046084
PM10 0.0000005 0.0000000 0.0000359 0.0000000
Source: Primary data (2015), computed.
Note: aEmission of non-GHGs for conventional system was obtained from Maulana (2015).
Table 11. Converting damage costs of GHGs and non-GHGs for the UK to damage costs for Indonesia
No. Pollutants Damage cost for UK (£/kg) 1
Adjusting factors 2
Damage cost for Indonesia (Rp/kg) GDP/cap ratio Population density
ratio
1. CH4 0.072 0.20299 0.44718 45.04
2. N2O 0.614 0.20299 0.44718 384.115
3. SO2 2.584 0.20299 0.44718 1,616.54
4. NOx 1.270 0.20299 0.44718 794.51
5. PM10 8.980 0.20299 0.44718 5,617.84
Source: 1 Craighill and Powell (1996), computed; 2 FAO and CBS of Indonesia, computed.
Note: Exchange rate used in converting damage costs is Rp6,891.85/£1 (Source: Bank of Indonesia, average exchange rate in 2014, PPP).
Table 12. Total damage cost per kg unhulled rice and per ha paddy field for SRI and conventional system in Dlingo Village, 2015
Pollutants SRI Conventional** SRI Conventional**
(Rp/kg) (Rp/ha)
CH4 3 5 21,283 33,583
N2O 6 24 35,471 150,359
GHGs 9 29 56,754 183,942
SO2 0.18 10.89 1,132 71,549
NO2 0.07 3.66 459 24,066
PM10 0.00 0.20 18 1,342
Non-GHGs 0.26 14.75 1,609 96,958
Total (GHGs + Non-GHGs) 9 44 58,363 280,899 Source: Primary data (2015), computed.
used 3,980 kg organic fertilizer per ha. By using the average of organic fertilizer price Rp753/kg, private cost for SRI increased Rp2.99 million/ha (31.4%), if organic fertilizer is considered as a cost. Meanwhile, real labor costs (“real” refers to input-output data taken from the study site, without adding some adjustments or scenarios) for SRI was Rp8.57 million/ha/season.
Farmers who implemented organic production system or SRI had lower damage cost, i.e. Rp9/kg unhulled rice. Calculating per ha, the amount of damage cost will be important to be considered because if the farmers deliberated to change the rice production method from conventional system to SRI, farmers are estimated to reduce damage cost Rp35/kg unhulled rice or 80% of the
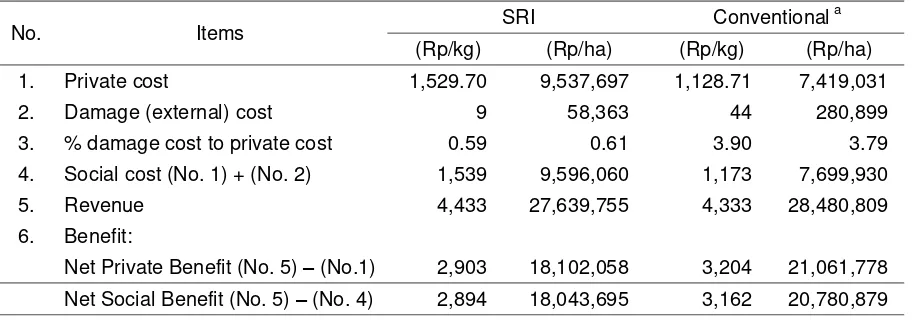
conventional system‟s damage cost (Maulana 2015). Although the percentage of damage cost to private cost was only 0.59–3.90%, if damage cost was multiplied by the paddy area in Indonesia, the amount will be significant. The social cost per kg unhulled rice of SRI was Rp1,539/kg unhulled rice. Due to the higher the amount of SRI private cost compared to conventional private cost, although social costs have been internalized into private cost, net private benefit, and net social benefit of practicing SRI were lower compared to conventional practice (Table 13).
CONCLUSION AND RECOMMENDATION Production cost of 1 kg unhulled rice by applying System of Rice Intensification was Rp1,529/kg or Rp9.54 million/ha/season. By implementing the SRI system in producing 1 kg
unhulled rice, farmers could reduce the quantity of CH4 emission from 31.5kg/ha/season to 18.94 kg/ha/season or decreased 40%. N2O emission could also be decreased by transferring their conventional farming practice to SRI from 1.383 kg/ha/season to 0.293 kg/ha/season or decreased 78.8%. In line with GHGs emission, the quantity of SO2, NOx, and PM10 emission in producing 1 kg unhulled rice were also diminished by implementing SRI system. By implementing the SRI system produced 0.0000036, 0.0000043, and 0.0000005 kg/ha/season, correspondingly.
Damage cost of CH4 and N2O emission in producing 1 kg unhulled rice by applying SRI were Rp3/kg and Rp6/kg, respectively. Damage cost of SO2, NOx, and PM10 produced by SRI system was relatively very low. The damage cost of SO2, NOx, and PM10 were Rp0.18, Rp0.07, and Rp0.00 per kg unhulled rice, respectively. Total damage cost of GHGs and non-GHGs of producing 1 kg unhulled rice by applying SRI was Rp9/kg unhulled rice. Converting to 1 ha, the total damage cost of practicing SRI was Rp58,363/ha/season. The social cost of producing 1 kg unhulled rice by implementing SRI was Rp1,539/kg unhulled rice.
In summary, the social cost calculation in this research proved that there was much economic benefit if farmers intend to transfer their rice production practice from conventional to SRI, even though the economic benefits are intangible. The government could take these advantages by using carbon trading mechanism. By using the SRI extended area in 2015 as much as 200,000 ha, the government could receive Rp222,536 per ha or Rp44.51 billion per 200,000 ha. This estimated economic benefit Table 13. Private cost, damage cost and social cost of System of Rice Intensification and conventional
rice production system in Dlingo Village, 2015
No. Items SRI Conventional
a
(Rp/kg) (Rp/ha) (Rp/kg) (Rp/ha)
1. Private cost 1,529.70 9,537,697 1,128.71 7,419,031
2. Damage (external) cost 9 58,363 44 280,899
3. % damage cost to private cost 0.59 0.61 3.90 3.79
4. Social cost (No. 1) + (No. 2) 1,539 9,596,060 1,173 7,699,930
5. Revenue 4,433 27,639,755 4,333 28,480,809
6. Benefit:
Net Private Benefit (No. 5) – (No.1) 2,903 18,102,058 3,204 21,061,778 Net Social Benefit (No. 5) – (No. 4) 2,894 18,043,695 3,162 20,780,879 Source: Primary data (2015), computed.
can be used by the government to improve subsidy. Besides, the government could facilitate SRI farmers for producing premium rice since SRI method based on organic practice. All those on benefits can be chosen by the government to enhance SRI method and the area through its counseling programs.
This research only uses 50 farmers for collecting input-output data and consider as very small number of samples. If the number of samples is increased, the findings would be different. This research also only had three points of observation and performed three times sample taking for GHGs emissions in a season, which were categorized as a small number of IAARD that provided scholarship and research fund. In organizing and analyzing field research, I thank Organic Paddy Farmers Association in Boyolali (APPOLI) which provided research field and Indonesian Agricultural Environment Research Institute (IAERI) that arranged for laboratory analysis.
I thank Mr. Muchdi and Mr. Susatyo from APPOLI for assistance for sample taking and interviewing paddy organic farmers in Dlingo Village. I also thank Mr. Ali Pramono and Mrs. Mira from IAERI who provided insight and expertise that greatly assisted the research. I would also like to show my gratitude to the
reviewers of ICASEPS‟ Agro-Economics Journal for comments that greatly improved the manuscript, although any errors were my own and should not tarnish the reputation of these esteemed persons.
REFERENCES
Ariani M, Setyanto P, Susilawati HL. 2011. Emisi gas rumah kaca (CH4) budi daya padi system SRI dan
konvensional di tanah sawah irigasi Jombang. Dalam: Rejekiningrum P, editor. Prosiding
Seminar Nasional Sumberdaya Lahan Pertanian; 2011 Jul 13-14; Banjarbaru, Indonesia. Buku 2. Banjarbaru (ID): Balai Penelitian Lahan Rawa. hlm. 351-362.
Blengini GA, Busto M. 2009. The life cycle of rice: LCA of alternative agri-food chain management systems in Vercelli (Italy). J Environ Manage. 90:1512-1522.
Chernick PL, Caverhill E. 1990. Monetizing externalities in utility regulations: the role of control cost. Proceeding of National Conference on Environmental Externalities; 1990 Oct 1-3; Jackson Hole, Wyoming, United States. Washington, DC (US): National Association of Regulatory Utility Commissioners. p. 41-62.
[CEC] Commission for the European Communities. 1994. Assessment of the external cost of the coal fuel cycle. Brussels (BG): Commission for the European Communities..
Craighill AL, Powell JC. 1996. Life cycle assessment and economic evaluation of recycling: a case study. Resour Conserv Recy.17:75-96.
Dan J, Kruger M, Frenzel P, Conrad R. 2001. Effect of a late season urea fertilization on methane emission from a rice field in Italy. Agric Ecosys Environ. 83:191-199.
de Boer IJM. 2003. Environmental impact assessment of conventional and organic milk production. Livest Prod Sci. 80:69-77.
de Witt, LB. 1990. An overview of environmental externalities. In Charles Stalon, Putnam, Hayes and Bartlett. Proceeding of National Conference on Environmental Externalities; 1990 Oct 1-3; Jackson Hole, Wyoming, United States. Washington, DC (US): National Association of Regulatory Utility Commissioners. p. 5-13.
Farber SC, Costanza R, Wilson MA. 2002. Economic and ecological concepts for valuing ecosystem service. Ecol Econ. 41:375-392.
[FAO] Food and Agriculture Organization. 2001. Roles of agriculture project. First expert meeting on the documentation and measurement of the roles of agriculture in developing countries. ROA Project Publication No. 2. Rome (IT): Food and Agriculture Organization of the United Nation.
Haites EF. 1990. Introduction to the use of social costs in utility planning and regulation. Proceedings of National Conference on Environmental Externalities; 1990 Oct 1-3, Jackson Hole, Wyoming, United States. Washington, DC (US): National Association of Regulatory Utility Commissioners. p. 29-40.
Harjanto, Ratri T, Fahrurrozi M, Bendiyasa IM. 2012. Life cycle assessment pabrik semen PT Holcim Indonesia Tbk. pabrik Cilacap: komparasi antara bahan bakar batubara dengan biomassa. J Rekayasa Proses. 6:35-44.
and methane emissions in a rice soil. Chemosphere. 74:481-486.
Husnain H, Wigena IGP, Dariah A, Marwanto S, Setyanto P, Agus F. 2014. CO2 emissions from
tropical drained peat in Sumatera, Indonesia. Mitig Adapt Strateg Glob Change. 19:845-862. doi: 10.1007/s11027-014-9550-y.
[IAASTD] International Assessment of Agricultural Knowledge, Science and Technology for Development. 2009. Agriculture at a crossroads, international assessment of agricultural knowledge, science and technology for development global report. Washington, DC (US): Island Press.
[IAEA] International Atomic Energy Agency. 1993. Manual on measurement of methane and nitrous oxide emission from agricultural land. Vienna (AT): International Atomic Energy Agency.
Johnson-Beebout SE, Angeles OR, Alberto MCR, Buresh RJ. 2009. Simultaneous minimization of nitrous oxide and methane emission from rice paddy soils is improbable due to redox potential changes with depth in a greenhouse experiment without plants. Geoderma. 149:45-53.
Kabir H., Uphoff N. 2007. Results of disseminating the System of Rice Intensification with Farmer Field School Methods in Northern Myanmar, Exp Agric 43(4):463–476. doi: 10.1017/S0014479707005340.
Khalil MAK, Rasmussen RA, Wang MX, Ren L. 1991. Methane emissions from rice fields in China.
Kruger M, Frenzel P. 2003. Effects of N-fertilization on CH4 oxidation and production, and consequences for CH4 emissions from microcosms and rice fields. Global Change Biol. 9:773-784.
Lindau CW. 1994. Methane emissions from Lousiana rice fields amended with nitrogen fertilizers. Soil Biol Biochem. 26(3):353-359.
Lv Y, Gu S, Guo D. 2010. Valuing environmental externalities from rice-wheat farming in the lower reaches of the Yangtze River. Ecol Econ. 69:1436-1442.
Ly P, Jensen LS, Bruun TB, de Neergaard A. 2013. Methane (CH4) and nitrous oxide (N2O) emissions
from the system of rice intensification (SRI) under a rain-fed lowland rice ecosystem in Cambodia. Nutr Cycl Agroecosyst. 97:13-27.
Mahananto, Sutrisno S, Ananda CF. 2009. Faktor-faktor yang memengaruhi produksi padi: studi kasus di Kecamatan Nogosari, Boyolali, Jawa Tengah). Wacana. 12(1):179-191.
Maulana M. 2015. Social costs of conventional rice production system and system of rice intensification (SRI) in Indonesia [Thesis].
Wageningen (NL): Wageningen University and Research Center, Environmental Economics and Natural Resources Group.
Mayrowani H. 2012. Pengembangan pertanian organik di Indonesia. FAE. 30(2):91-108.
Ministry of Agriculture of Republic of Indonesia. 2014. Pedoman teknis pengembangan system of rice intensification TA 2014. Jakarta (ID): Ministry of Agriculture of Republic of Indonesia.
Ministry of Public Works of Republic of Indonesia. 2009. SRI di Desa Girimukti. Laporan akhir kegiatan demplot efisiensi air irigasi melalui metode SRI. Jakarta (ID): Ministry of Public Works of Republic of Indonesia.
Neue HU. 1997. Fluxes of methane from rice fields and potential for mitigation. Soil Use Manage. 13:258-267.
Rajkishore, S.K, P. Doraisamy, K.S. Subramanian and M. Maheswari. 2013. Methane emission patterns and their associated soil microflora with SRI and conventional system of rice cultivation in Tamil Nadu, India. Taiwan Water Concervancy, 61:126-134.
Rennings K, Wiggering H. 1997. Steps towards indicators of sustainable development: linking economic and ecological concepts. Ecol Econ. 20(1):25-36.
Sahrawat KL. 2004. Nitrification inhibitors for controlling methane emission from submerged rice soil. Current Sci. 87(8):195-208.
Scialabb NE, Hattam C. 2002. Organic agriculture, environment and food security. Rome (IT): Food and Agriculture Organization of the United Nation.
[SAIC] Scientific Applications International Corporation. 2006. Life cycle assessment: principles and practice. Work Assignment 3–15 Contract No. 68-C02-067. Washington, DC (US): US Environmental Protection Agency, Office of Research and Development, National Risk Management Research Laboratory.
Simatupang P, Purwoto A, Friyatno S, Maulana M, Syam A. 2009. Kebijakan untuk merespons perubahan harga bahan bakar minyak (BBM) terhadap kinerja sektor pertanian dan kesejahteraan petani. Laporan Akhir Penelitian. Bogor (ID): Indonesian Center for Agricultural Socio Economics and Policy Studies.
Setyanto P. 2004. Methane emission and its mitigation in rice field under different management practices in Central Java [Dissertation]. Selangor (MY): Putra Malaysia University.
Setyanto P, Kartikawati R. 2008. Sistem pengelolaan tanaman padi rendah emisi gas metan. JPPTP. 27(3):154-163.
Setyanto P, Suharsih, Makarim AK. 2012. Varietal difference of irrigated rice affecting methane emission. Proceeding of International Seminar 2012: Technology innovation for increasing rice production and conserving environment under global climate change; 2012 Jul 11-12; Bogor, Indonesia. Bogor (ID): Indonesian Center of Rice Research. p.157-170.
Setyanto P, Suharsih, Makarim AK, Sasa J. 1999. Inventarisasi emisi dan mitigasi gas CH4 pada
lahan sawah di Jakenan. Dalam: Ariatin, Hendrawaty, Siti Rochanah dan Sri Hardianti, editors. Simposium Tanaman Pangan IV; 1999 Nov 22–24, Bogor, Indonesia. Bogor (ID): Pusat Penelitian dan Pengembangan.
Towprayoon S, Smakgahn K, Poonkaew S. 2005. Mitigation of methane and nitrous oxide emissions from drained irrigated rice fields. Chemosphere. 59(11):1547-1556.
Uphoff, N. 2005. Report on a visit to India and Bangladesh regarding SRI progress, February 16-17, 2005 [Internet]. [cited 2015 Mar 13].
http://sri.cals.cornell.edu/countries/bangladesh/indi abangtrep205.pdf
Uphoff, N. 2015. The System of Rice Intensification (SRI): responses to frequently asked questions. Ithaca, New York (US): Cornell University.
Wang M, Aiguo D, Jun H, Lixin R. 1993. Estimate of methane emission from China. Chinese J Atmos Sci. 17(1):49-62.
Wihardjaka A. 2010. Emisi gas dinitrogen oksida dari tanah sawah tadah hujan yang diberi jerami padi dan bahan penghambat nitrifikasi. J Biol Indones. 6(2):211-224.
Wihardjaka A, Tandjung SD, Sunarminto BH, Sugiharto E. 2010. Emisi gas dinitrogen oksida pada padi gogorancah oleh pemberian jerami padi dan bahan penghambat nitrifikasi. JPPTP. 29(3):144-151.