LAMPIRAN A
KONVERSI PERHITUNGAN EKSTRAK
Cara perhitungan ekstrak kering seledri untuk formulasi sampo
ekstrak kering seledri mengacu penelitian Nimas, Astuti dan
Asriningdhiani (2012) bahwa konsentrasi terbaik sebagai anti bakteri
adalah 10% sedangkan ekstrak kering yang didapatkan mengandung
pengisi dengan perbandingan Seledri dengan pengisi adalah 5 : 1.
Maka agar yang diformulasikan sama dengan konsentrasi seledri
perlu dikonversikan terlebih dahulu.
(ekstrak kering seledri yang telah dikonversi dengan pengisinya)
Maka konsentrasi ekstrak kering seledri yang ditimbang adalah 12 %
dengan penimbangan 1 bets yaitu 300 gram.
LAMPIRAN B
STANDARISASI EKSTRAK NON SPESIFIK dan SPESIFIK
EKSTRAK KERING SELEDRI (
Apium graveolens
L.)
A. STANDARISASI NON SPESIFIK
1.
Penentuan Kadar Air
Replikasi Berat cawan (g)
Berat ekstrak (g)
Berat ekstrak konstan (g)
% kadar (%)
I 43,0489 2,0070 1,9526 2,71
II 58,2802 2,0006 1,9439 2,83
III 56,3502 2,0020 1,9465 2,77
x ± SD 2,77±0,06
Contoh Perhitungan:
Replikasi I:
2.
Penentuan Kadar Abu Total
Replikasi Berat krus (g)
Berat ekstrak (g)
Berat krus+abu konstan (g)
% kadar (%)
I II III
32,4917 33,7279 33,3258
2,0117 2,0096 2,0770
32,6052 33,8386 33,4441
5,64 5,55 5,69
x ± SD 5,63±0,06
Contoh Perhitungan:
Replikasi I:
3.
Penentuan Kadar Abu Tidak Larut Asam
Replikasi Berat krus (g)
Berat ekstrak (g)
Berat abu+HCl konstan (g)
% kadar (%)
I II III
32,4917 33,7279 33,3258
2,0117 2,0096 2,0770
32,4957 33,7326 33,3293
0,20 0,23 0,17 x ± SD
0,20±0,03
Contoh Perhitungan:
Replikasi I:
4.
Penentuan Kadar Abu Larut Air
Replikasi Berat krus (g)
Berat ekstrak (g)
Berat abu+ Aquadest (g)
% kadar (%)
I 33,7263 2,0166 33,7460 0,98 II 32,4913 2,0194 32,5065 0,75 III 33,2728 2,0770 33,2898 0,82
x ± SD 0,85±0,1
Contoh Perhitungan:
Replikasi I:
B. STANDARISASI SPESIFIK
5.
Penentuan Nilai pH
Replikasi Hasil pengamatan
I 5,96
II 5,98
III 5,96
x ± SD 5,97±0,01
6.
Penentuan Kadar Sari Larut Air
RepBerat cawan (g)
Berat ekstrak (g)
Berat cawan + berat ekstrak
(g)
% kadar (%)
I 33,2605 5,0115 34,1973 93,47%
II 44,7800 5,0819 45,7651 96,92%
III 43,1153 5,0885 44,0494 91,79%
x ± SD 94,06±2,86
Contoh Perhitungan:
Replikasi I:
7.
Penentuan Kadar Sari Larut Etanol
Rep Berat cawan(g)
Berat ekstrak (g)
Berat cawan + berat ekstrak (g)
% kadar (%)
I 58,3405 5,0395 58,3499 0,93%
II 111,2153 5,0622 111,2203 0,49%
III 92,9845 5,0035 92,9905 0,60%
Contoh Perhitungan:
Replikasi I:
LAMPIRAN C
HASIL SEDIAAN SAMPO CAIR JERNIH EKSTRAK
KERING SELEDRI (
APIUM GRAVEOLENS
L.)
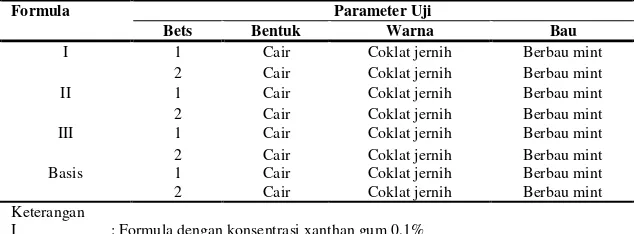
Tabel Pengamatan sediaan sampo ekstrak kering seledri (apium graveolens l.)
Formula Parameter Uji
Bets Bentuk Warna Bau
I 1 Cair Coklat jernih Berbau mint 2 Cair Coklat jernih Berbau mint II 1 Cair Coklat jernih Berbau mint 2 Cair Coklat jernih Berbau mint III 1 Cair Coklat jernih Berbau mint
Basis
2 1 2
Cair Cair Cair
Coklat jernih Coklat jernih Coklat jernih
Berbau mint Berbau mint Berbau mint Keterangan
LAMPIRAN D
HASIL UJI HOMOGENITAS SEDIAAN SAMPO EKSTRAK
KERING SELEDRI (
APIUM GRAVEOLENS
L.)
Penilaian uji homogenitas sediaan sampo ekstrak kering seledri (apium graveolens l.)
Formula Replikasi Bets 1 Bets 2
I 1 2 2
2 2 2
3 2 2
II 1 2 2
2 2 2
3 2 2
III 1 2 2
2 2 2
3 2 2
Basis 1 2 2
2 2 2
3 2 2
Keterangan
HASIL STATISTIK ANTAR BETS
Uji Statistik homogenitas antar bets mengunakan
wilcoxon
Lampiran Hasil perhitungan Statistik wilcoxon pada
Homogenitas
Formula I Bets 1 dan Bets 2
Descriptive Statistics
N Mean Std. Deviation Minimum Maximum
Bets_1 3 2.0000 .00000 2.00 2.00
Bets_2 3 2.0000 .00000 2.00 2.00
Test Statisticsb
Bets_2 - Bets_1
Z .000a
Asymp. Sig. (2-tailed) 1.000
a. The sum of negative ranks equals the sum of positive ranks. b. Wilcoxon Signed Ranks Test
Lampiran Hasil perhitungan Statistik wilcoxon pada
Homogenitas
Formula II Bets 1 dan Bets 2
Descriptive StatisticsN Mean Std. Deviation Minimum Maximum
Bets_1 3 2.0000 .00000 2.00 2.00
Bets_2 3 2.0000 .00000 2.00 2.00
Test Statisticsb
Bets_2 - Bets_1
Z .000a
Asymp. Sig. (2-tailed) 1.000
Lampiran Hasil perhitungan Statistik wilcoxon pada
Homogenitas
Formula III Bets 1 dan Bets 2
Descriptive StatisticsN Mean Std. Deviation Minimum Maximum
Bets_1 3 2.0000 .00000 2.00 2.00
Bets_2 3 2.0000 .00000 2.00 2.00
Test Statisticsb
Bets_2 - Bets_1
Z .000a
Asymp. Sig. (2-tailed) 1.000
a. The sum of negative ranks equals the sum of positive ranks. b. Wilcoxon Signed Ranks Test
Lampiran Hasil perhitungan Statistik wilcoxon pada
Homogenitas
Basis Bets 1 dan Bets 2
Descriptive StatisticsN Mean Std. Deviation Minimum Maximum
Bets_1 3 2.0000 .00000 2.00 2.00
Bets_2 3 2.0000 .00000 2.00 2.00
Test Statisticsb
Bets_2 - Bets_1
Z .000a
Asymp. Sig. (2-tailed) 1.000
HASIL STATISTIK ANTAR FORMULA
Perhitungan Nilai
Chi-square
dengan metode
Friedman test
secara manual
Lampiran Hasil perhitungan Statistik
Friedman test
pada
Homogenitas antar formula
Hasil penetapan peringkat dan analisis statistik uji homogenitas
Bets Rep Formula 0 Formula 1 Formula 2 Formula 3
Skor Peringkat Skor Peringkat Skor Peringkat Skor Peringkat
1 1 2 2,5 2 2,5 2 2,5 2 2,5
2 2 2,5 2 2,5 2 2,5 2 2,5
3 2 2,5 2 2,5 2 2,5 2 2,5
2 1 2 2,5 2 2,5 2 2,5 2 2,5
2 2 2,5 2 2,5 2 2,5 2 2,5
3 2 2,5 2 2,5 2 2,5 2 2,5
Jumlah pengamatan
6 6 6 6
Jumlah peringkat
15 15 15 15
Keterangan
I : Formula dengan konsentrasi xanthan gum 0,1%
II : Formula dengan konsentrasi xanthan gum 0,3%
III : Formula dengan konsentrasi xanthan gum 0,5% Blangko : Blangko tanpa xanthan gum
= 0
Chi-square
hit(0)
< Chi-square
tabel(11,070)
,sehingga tidak ada
LAMPIRAN E
HASIL PH SAMPO SEDIAAN SAMPO EKSTRAK KERING
SELEDRI (
APIUM GRAVEOLENS
L.)
Nilai uji pH sediaan sampo ekstrak kering seledri (Apium graveolens L.)
Formula Replikasi Bets 1 Bets 2
I 1 5,97 5,95
2 5,95 5,96
3 5,97 5,96
X
± SD 5,96±0,1 5,96±0,1II 1 5,94 5,95
2 5,94 5,95
3 5,96 5,96
X
± SD 5,95±0,1 5,95±0,1III 1 5,95 5,94
2 5,96 5,95
3 5,95 5,95
X
± SD 5,95±0,1 5,95±0,1Basis 1
2 3
5,94 5,95 5,95
5,96 5,96 5,95
X
± SD 5,95±0,1 5,96±0,1Keterangan
HASIL STATISTIK ANTAR BETS
Uji Statistik pH antar bets mengunakan
independent t-test
Lampiran Hasil perhitungan Statistik Uji t-bebas pada
Pengujian pH
Formula I Bets 1 dan Bets 2
Group StatisticsBets N Mean Std. Deviation Std. Error Mean
Nilai_pH 1.00 3 5.9633 .01155 .00667
2.00 3 5.9567 .00577 .00333
Independent Samples Test
Levene's Test for Equality of
Variances t-test for Equality of Means
95% Confidence Interval of the
Difference
F Sig. t df
Sig. (2-tailed)
Mean Differenc
e
Std. Error Differenc
e Lower Upper
Nilai_ pH
Equal variances assumed
3.200 .148 .894 4 .422 .00667 .00745 -.01403 .02736
Equal variances not assumed
.894 2.941 .438 .00667 .00745 -.01732 .03066
Lampiran Hasil perhitungan Statistik Uji t-bebas pada
Pengujian pH
Formula II Bets 1 dan Bets 2
Group Statistics
Bets N Mean Std. Deviation Std. Error Mean
Nilai_Ph 1.00 3 5.9467 .01155 .00667
Independent Samples Test
Levene's Test for Equality of
Variances t-test for Equality of Means
95% Confidence Interval of the
Difference
F Sig. t df
Sig. (2-tailed) Mean Differen ce Std. Error Differenc
e Lower Upper
Nilai_ pH
Equal variances assumed
3.200 .148 -.894 4 .422 -.00667 .00745 -.02736 .01403
Equal variances not assumed
-.894 2.941 .438 -.00667 .00745 -.03066 .01732
Lampiran Hasil perhitungan Statistik Uji t-bebas pada
Pengujian pH
Formula III Bets 1 dan Bets 2
Group StatisticsBets N Mean Std. Deviation Std. Error Mean
Nilai_pH 1.00 3 5.9533 .00577 .00333
2.00 3 5.9467 .00577 .00333
Independent Samples Test
Levene's Test for Equality of
Variances t-test for Equality of Means
95% Confidence Interval of the
Difference
F Sig. t df
Sig. (2-tailed)
Mean Difference
Std. Error
Difference Lower Upper
Nilai_p H
Equal variances assumed
.000 1.000 1.414 4 .230 .00667 .00471 -.00642 .01975
Equal variances not assumed
Lampiran Hasil perhitungan Statistik Uji t-bebas pada
Pengujian pH Formula
Basis Bets 1 dan Bets 2
Group StatisticsBets N Mean Std. Deviation Std. Error Mean
Nilai_pH 1.00 3 5.9467 .00577 .00333
2.00 3 6.2900 .58026 .33501
Independent Samples Test
Levene's Test for Equality of
Variances t-test for Equality of Means
95% Confidence Interval of the
Difference
F Sig. t df
Sig. (2-tailed)
Mean Difference
Std. Error
Difference Lower Upper
Nilai_ pH
Equal variances assumed
15.671 .017 -1.025
4 .363 -.34333 .33503 -1.27352 .58686 Equal variances not assumed -1.025
2.000 .413 -.34333 .33503 -1.78457
1.09791
HASIL STATISTIK ANTAR FORMULA
Uji Statistik pH antar formula mengunakan
One way anova
Descriptive Statistics
N Minimum Maximum Mean Std. Deviation
Nilai_pH 24 5.94 5.97 5.9529 .00859
Valid N (listwise) 24
ANOVA
Nilai_Ph
Sum of Squares Df Mean Square F Sig.
Between Groups .000 3 .000 2.143 .127
Within Groups .001 20 .000
LAMPIRAN F
HASIL PEMERIKSAAN SOLID DALAM SAMPO EKSTRAK
KERING SELEDRI (
APIUM GRAVEOLENS
L.)
Nilai uji Pemeriksaan Solid dalam Sampo ekstrak kering seledri (Apium graveolens L.)
Keterangan
I : Formula dengan konsentrasi xanthan gum 0,1% II : Formula dengan konsentrasi xanthan gum 0,3% III : Formula dengan konsentrasi xanthan gum 0,5% Blangko : Blangko tanpa xanthan gum
Pengamatan Berat
cawan kosong
Berat sampo
Berat cawan +
sampo
Persen solid dalam sampo
(%)
Formula I Bets 1 1 43,4733 3,0663 44,2500 25,33
2 43,4564 3,0292 44,2182 25,15 3 43,2754 3,0123 44,0571 25,95 Bets 2 1 43,5729 3,0729 44,3531 25,39 2 44,5850 3,0003 45,3591 25,80 3 42,4521 3,0025 43,2189 25,54
Formula II Bets 1 1 58,2910 3,2502 59,0829 24,36 2 43,7813 3,1034 44,5435 24,56 3 54,9850 3,0345 55,7269 24,45 Bets 2 1 70,3900 3,0437 71,1311 24,35 2 62,8798 3,0295 63,6184 24,38 3 62,8725 3,1003 63,6315 24,48
Formula III Bets 1 1 45,9876 3,0012 46,7247 24,56 2 45,8720 3,0053 46,6095 24,54 3 43,5432 3,0245 44,2836 24,48 Bets 2 1 44,3258 3,2576 45,1353 24,85 2 45,7296 3,1659 46,5157 24,83 3 43,8752 3,0064 44,6205 24,79
Basis Bets 1 1 45,9856 3,1870 46,7626 24,38
Contoh Perhitungan:
Formula I bets I replikasi I
Nilai Pemeriksaan solid dalam sampo ekstrak kering seledri
(
Apium graveolens
L.)
Formula Replikasi Bets 1 Bets 2
I
1 25,33% 25,39%
2 25,15% 25,80%
3 25,95% 25,54%
X
± SD 25,48%±0,47 25,58%±0,22II
1 24,36% 24,35%
2 24,56% 24,38%
3 24,45% 24,48%
X
± SD 24,46%±0,10 24,40%%±0,08III 1 24,56% 24,85%
2 24,54% 24,83%
3 24,48% 24,79%
X
± SD 24,53%±0,05 24,82%±0,03Basis
1 2 3
24,38% 24,72% 24,65%
24,54% 24,40% 24,45%
X
± SD 24,58%±0,14 24,46%±0,08Keterangan
HASIL STATISTIK ANTAR BETS
Uji Statistik pemeriksaan solid dalam sampo antar bets
mengunakan
independent t-test
Lampiran Hasil perhitungan Statistik Uji t-bebas pada
pemeriksaan solid dalam sampo Formula I Bets 1 dan Bets 2
Group Statistics
Bets N Mean Std. Deviation Std. Error Mean
Pemeriksaan_solid_dalam_sampo 1.00 3 24.4767 .41968 .24230
2.00 3 24.5767 .20744 .11977
Independent Samples Test
Levene's Test for Equality of
Variances t-test for Equality of Means
95% Confidence Interval of the
Difference
F Sig. T Df Sig.
(2-tailed) Mean Differen
ce
Std. Error Differen
ce Lower Upper
Pemeriksaan_so lid_dalam_sam po
Equal variances assumed
2.280 .206 -.370 4 .730 -.10000 .27029 -.85044 .65044
Equal variances not assumed
-.370 2.922 .737 -.10000 .27029 -.97327 .77327
Lampiran Hasil perhitungan Statistik Uji t-bebas pada
pemeriksaan solid dalam sampo Formula II Bets 1 dan Bets 2
Group Statistics
Bets N Mean Std. Deviation Std. Error Mean
Pemeriksaan_solid_dalam_sampo 1.00 3 24.4567 .10017 .05783
Independent Samples Test
Levene's Test for Equality of
Variances t-test for Equality of Means
95% Confidence Interval of the
Difference
F Sig. T df Sig.
(2-tailed) Mean Difference
Std. Error
Difference Lower Upper
Pemeriksaan_s olid_dalam_sa mpo Equal variances assumed
.261 .636 .763 4 .488 .05333 .06992 -.14080 .24746
Equal variances not assumed
.763 3.522 .493 .05333 .06992 -.15163 .25830
Lampiran Hasil perhitungan Statistik Uji t-bebas pada
pemeriksaan solid dalam sampo Formula III Bets 1 dan Bets 2
Group Statistics
Bets N Mean Std. Deviation Std. Error Mean
Pemeriksaan_solid_dalam_sampo 1.00 3 24.5267 .04163 .02404
2.00 3 24.4500 .11269 .06506
Independent Samples Test
Levene's Test for Equality of
Variances t-test for Equality of Means
95% Confidence Interval of the
Difference
F Sig. T df Sig. (2-tailed) Mean Differen ce Std. Error Differen
ce Lower Upper
Pemeriksaan_s olid_dalam_sa mpo Equal variances assumed
5.400 .081 1.105 4 .331 .07667 .06936 -.11591 .26925
Equal variances not assumed
Lampiran Hasil perhitungan Statistik Uji t-bebas pada
pemeriksaan solid dalam sampo
Basis Bets 1 dan Bets 2
Group StatisticsBets N Mean Std. Deviation Std. Error Mean
Pemeriksaan_solid_dalam_sampo 1.00 3 24.5833 .17954 .10366
2.00 3 24.4633 .07095 .04096
HASIL STATISTIK ANTAR FORMULA
Uji Statistik pemeriksaan solid dalam sampo antar formula
mengunakan
One way anova
Descriptive Statistics
N Minimum Maximum Mean Std. Deviation
Pemeriksaan_solid_dalam_sampo 24 24.15 24.95 24.4921 .16901
Valid N (listwise) 24
ANOVA
Pemeriksaan_solid_dalam_sampo
Sum of Squares Df Mean Square F Sig.
Between Groups .036 3 .012 .389 .762
Within Groups .621 20 .031
Total .657 23
Independent Samples Test
Levene's Test for Equality of
Variances t-test for Equality of Means
95% Confidence Interval of the
Difference
F Sig. T df Sig.
(2-tailed) Mean Difference
Std. Error
Difference Lower Upper
Pemeriksaan_s olid_dalam_sa mpo Equal variances assumed
3.698 .127 1.077 4 .342 .12000 .11146 -.18945
.42945
Equal variances not assumed
1.077 2.610 .371 .12000 .11146 -.26668
LAMPIRAN G
HASIL VISKOSITAS SAMPO EKSTRAK KERING SELEDRI
(
APIUM GRAVEOLENS
L.)
Penilaian uji viskositas sediaan sampo ekstrak kering seledri (Apium graveolens L.)
Formula Replikasi Minggu I
Formula I Bets I 1 2670
2 2570
3 2500
Bets II 1 2500
2 2600
3 2550
Formula II Bets I 1 8715
2 8691
3 8690
Bets II 1 8942
2 8886
3 8873
Formula III Bets I 1 14953
2 14950
3 14996
Bets II 1 15650
2 15422
3 14982
Basis Bets I 1 1880
2 2100
3 1900
Bets II 1 2000
2 2056
3 1900
Keterangan
HASIL STATISTIK ANTAR BETS
Uji Statistik viskositas antar bets mengunakan
independent t-test
Lampiran Hasil perhitungan Statistik Uji t-bebas pada
Viskositas
Formula I Bets 1 dan Bets 2
Group StatisticsBets N Mean Std. Deviation Std. Error Mean
Viskositas 1.00 3 2580.0000 85.44004 49.32883
2.00 3 2550.0000 50.00000 28.86751
Independent Samples Test
Levene's Test for Equality of
Variances t-test for Equality of Means
95% Confidence Interval of the
Difference
F Sig. t df
Sig. (2-tailed) Mean Differenc e Std. Error Differenc
e Lower Upper
Viskos itas
Equal variances assumed
.780 .427 .525 4 .627 30.00000 57.15476 -128.6870 6 188.6870 6 Equal variances not assumed
.525 3.226 .634 30.00000 57.15476 -144.8895 9
204.8895 9
Lampiran Hasil perhitungan Statistik Uji t-bebas pada
Viskositas
Formula II Bets 1 dan Bets 2
Group StatisticsBets N Mean Std. Deviation Std. Error Mean
Viskositas 1.00 3 8698.6667 14.15392 8.17177
Independent Samples Test
Levene's Test for Equality of
Variances t-test for Equality of Means
95% Confidence Interval of the
Difference
F Sig. t df Sig.
(2-tailed)
Mean Difference
Std. Error
Difference Lower Upper
Viskos itas
Equal variances assumed
4.086 .113 -0.887
4 .001 -201.66667 22.69116 -264.66 744 -138.665 90 Equal variances not assumed -0.887
2.583 .005 -201.66667 22.69116 -280.94 222
-122.391 11
Lampiran Hasil perhitungan Statistik Uji t-bebas pada
Viskositas
Formula III Bets 1 dan Bets 2
Group StatisticsBets N Mean Std. Deviation Std. Error Mean
Viskositas 1.00 3 14966.3333 25.73584 14.85859
2.00 3 15351.3333 339.56050 196.04535
Independent Samples Test
Levene's Test for
Equality of Variances t-test for Equality of Means
95% Confidence Interval of the
Difference
F Sig. t df
Sig. (2-tailed) Mean Differenc e Std. Error Differenc
e Lower Uppe r Viskosi tas Equal variances assumed
6.295 .066 -1.958 4 .122 -385.0000 0
196.6076 2
-930.87026 160.8 7026
Equal variances not assumed
-1.958 2.023 .188 -385.0000 0
196.6076 2
Lampiran Hasil perhitungan Statistik Uji t-bebas pada
Viskositas
BASIS Bets 1 dan Bets 2
Group StatisticsBets N Mean Std. Deviation Std. Error Mean
Viskositas 1.00 3 1960.0000 121.65525 70.23769
2.00 3 1985.3333 79.02742 45.62650
Independent Samples Test
Levene's Test for Equality of
Variances t-test for Equality of Means
95% Confidence Interval of the
Difference
F Sig. t df
Sig. (2-tailed)
Mean Differenc
e
Std. Error Differenc
e Lower Upper
Viskos itas
Equal variances assumed
1.275 .322 -.302 4 .777 -25.33333
83.75626 -257.8779 9
207.2113 3
Equal variances not assumed
-.302 3.433 .780 -25.33333
83.75626 -273.8444 4
HASIL STATISTIK ANTAR FORMULA
Uji Statistik viskositas antar formula mengunakan
One way
anova
Descriptive Statistics
N Minimum Maximum Mean Std. Deviation
Formula 24 1.00 4.00 2.5000 1.14208
Valid N (listwise) 24
ANOVA
Viskositas
Sum of Squares df Mean Square F Sig.
Between Groups 6.881E8 3 2.294E8 7877.343 .000 Within Groups 582361.667 20 29118.083
Total 6.887E8 23
Multiple Comparisons
Viskositas LSD
(I) Formula (J) Formula
Mean Difference
(I-J) Std. Error Sig.
95% Confidence Interval
Lower Bound Upper Bound
Formula 1 Formula 2 -6234.50000* 98.51917 .000 -6440.0074 -6028.9926
Formula 3 -1.25938E4 98.51917 .000 -12799.3407 -12388.3259
Basis 592.33333* 98.51917 .000 386.8259 797.8407 Formula 2 Formula 1 6234.50000* 98.51917 .000 6028.9926 6440.0074 Formula 3 -6359.33333* 98.51917 .000 -6564.8407 -6153.8259
Basis 6826.83333* 98.51917 .000 6621.3259 7032.3407
Formula 3 Formula 1 12593.83333* 98.51917 .000 12388.3259 12799.3407 Formula 2 6359.33333* 98.51917 .000 6153.8259 6564.8407
Basis 13186.16667* 98.51917 .000 12980.6593 13391.6741
Basis Formula 1 -592.33333* 98.51917 .000 -797.8407 -386.8259
Formula 2 -6826.83333* 98.51917 .000 -7032.3407 -6621.3259
Formula 3 -1.31862E4 98.51917 .000 -13391.6741 -12980.6593
LAMPIRAN H
HASIL KESTABILAN VISKOSITAS SAMPO EKSTRAK
KERING SELEDRI (
APIUM GRAVEOLENS
L.)
Nilai uji kestabilan viskositas sediaan sampo ekstrak kering seledri (Apium graveolens L.) Formula Replikasi Minggu
I
Minggu II
Minggu III
Minggu IV
Slope
Formula I Bets I 1 2670 2669 2661 2660 3,8
2 2570 2568 2561 2559 4
3 2500 2458 2451 2448 3,7 Bets II 1 2500 2499 2490 2490 3,9 2 2600 2590 2589 2588 3,7 3 2550 2540 2539 2538 3,8
Formula II Bets I 1 8715 8710 8710 8708 2,1
2 8691 8690 8689 8683 2,5 3 8690 8689 8688 8681 2,8 Bets II 1 8942 8940 8935 8934 2,9 2 8886 8885 8881 8880 2,2 3 8873 8870 8865 8865 2,9
Formula III Bets I 1 14953 14951 14948 14948 1,8
2 14950 14949 14946 14945 1,8 3 14996 14996 14992 14992 1,6 Bets II 1 15650 15559 15551 15549 1,6 2 15422 15420 15418 15418 1,4 3 14982 14980 14978 14978 1,4
Basis Bets I 1 1880 1879 1631 1425 161,3
2 2100 2095 1839 1625 168,1 3 1900 1873 1635 1421 167,5 Bets II 1 2000 1989 1659 1639 171,3 2 2056 2049 1735 1590 171,2 3 1900 1798 1509 1398 179,5 Keterangan
HASIL STATISTIK ANTAR BETS
Uji Statistik kestabilan viskositas antar bets mengunakan
independent t-test
Lampiran Hasil perhitungan Statistik Uji t-bebas pada
Viskositas
Formula I Bets 1 dan Bets 2
Group StatisticsBets N Mean Std. Deviation Std. Error Mean
Viskositas 1.00 3 3.8333 .15275 .08819
2.00 3 3.8000 .10000 .05774
Independent Samples Test
Levene's Test for Equality of
Variances t-test for Equality of Means
95% Confidence Interval of the
Difference
F Sig. t df
Sig. (2-tailed)
Mean Differenc
e
Std. Error Differenc
e Lower Upper
Viskos itas
Equal variances assumed
.727 .442 .316 4 .768 .03333 .10541 -.25933 .32600
Equal variances not assumed
.316 3.448 .770 .03333 .10541 -.27876 .34542
Lampiran Hasil perhitungan Statistik Uji t-bebas pada
Viskositas
Formula II Bets 1 dan Bets 2
Group Statistics
Bets N Mean Std. Deviation Std. Error Mean
Viskositas 1.00 3 2.4667 .35119 .20276
Independent Samples Test
Levene's Test for Equality of
Variances t-test for Equality of Means
95% Confidence Interval of the
Difference
F Sig. t Df Sig. (2-tailed) Mean Differenc e Std. Error Differenc
e Lower Upper
Visko sitas
Equal variances assumed .257 .639 -.647 4 .553 -.20000 .30912 -1.05826 .65826
Equal variances not assumed
-.647 3.924 .554 -.20000 .30912 -1.06489 .66489
Lampiran Hasil perhitungan Statistik Uji t-bebas pada
Viskositas
Formula III Bets 1 dan Bets 2
Group StatisticsBets N Mean Std. Deviation Std. Error Mean
Viskositas 1.00 3 1.7333 .11547 .06667
2.00 3 1.4667 .11547 .06667
Independent Samples Test
Levene's Test for Equality of
Variances t-test for Equality of Means
95% Confidence Interval of the
Difference
F Sig. t Df
Sig. (2-tailed) Mean Differenc e Std. Error Differenc
e Lower Upper
Viskosi tas
Equal variances assumed
.000 1.000 2.828 4 .047 .26667 .09428 .00490 .52843
Equal variances not assumed
Lampiran Hasil perhitungan Statistik Uji t-bebas pada
Viskositas
Basis Bets 1 dan Bets 2
Group Statistics
Bets N Mean Std. Deviation Std. Error Mean
Viskositas 1.00 3 165.6333 3.76475 2.17358
2.00 3 174.0000 4.76340 2.75015
Independent Samples Test
Levene's Test for Equality of
Variances t-test for Equality of Means
95% Confidence Interval of the
Difference
F Sig. t Df Sig.
(2-tailed) Mean Differen
ce
Std. Error Differen
ce Lower Upper
Viskositas Equal variances assumed
.434 .546 -2.387
4 .075 -8.36667 3.50539 -18.0992 0
1.36586
Equal variances not assumed
-2.387
3.797 .079 -8.36667 3.50539 -18.3075 4
HASIL STATISTIK ANTAR FORMULA
Uji Statistik kestabilan viskositas antar formula mengunakan
One way anova
Descriptive Statistics
N
Minimum
Maximum
Mean
Std. Deviation
Viskositas
24
1.40
179.50
44.4500
73.99437
Valid N (listwise)
24
ANOVA
Viskositas
Sum of Squares Df Mean Square F Sig.
Between Groups 125749.230 3 41916.410 4668.012 .000
Within Groups 179.590 20 8.979
Total 125928.820 23
Multiple Comparisons
Viskositas LSD
(I) Formula (J) Formula
Mean Difference
(I-J) Std. Error Sig.
95% Confidence Interval
Lower Bound Upper Bound
Formula 1 Formula 2 1.25000 1.73008 .478 -2.3589 4.8589
Formula 3 2.21667 1.73008 .215 -1.3922 5.8255
Basis -166.00000* 1.73008 .000 -169.6089 -162.3911 Formula 2 Formula 1 -1.25000 1.73008 .478 -4.8589 2.3589
Formula 3 .96667 1.73008 .583 -2.6422 4.5755
Basis -167.25000* 1.73008 .000 -170.8589 -163.6411 Formula 3 Formula 1 -2.21667 1.73008 .215 -5.8255 1.3922
Formula 2 -.96667 1.73008 .583 -4.5755 2.6422 Basis -168.21667* 1.73008 .000 -171.8255 -164.6078 Basis Formula 1 166.00000* 1.73008 .000 162.3911 169.6089
LAMPIRAN I
HASIL PENGUKURAN PEMBERSIHAN SAMPO EKSTRAK
KERING SELEDRI (
APIUM GRAVEOLENS
L.)
Nilai uji pengukuran pembersihan sediaan sampo ekstrak kering seledri (Apium graveolens L.)
Pengamatan Berat
Control
Berat Sampel uji
% Pengukuran Pembersihan
Formula I Bets 1 1 1,4670 1,1028 24,82%
2 1,4670 1,1033 24,79%
3 1,4670 1,1035 24,78%
Bets 2 1 1,4670 1,1035 24,78%
2 1,4670 1,1032 24,80%
3 1,4670 1,1033 24,79 %
Formula II Bets 1 1 1,4670 1,1064 24,58%
2 1,4670 1,1061 24,60%
3 1,4670 1,1054 24,65%
Bets 2 1 1,4670 1,1061 24,60%
2 1,4670 1,1055 24,64%
3 1,4670 1,1058 24,62%
Formula III Bets 1 1 1,4670 1,1044 24,72%
2 1,4670 1,1049 24,68%
3 1,4670 1,1063 24,59%
Bets 2 1 1,4670 1,1039 24,75%
2 1,4670 1,1042 24,73%
3 1,4670 1,1045 24,71%
Basis Bets 1 1 1,4670 1,1064 24,58%
2 1,4670 1,1061 24,60%
3 1,4670 1,1054 24,65%
Bets 2 1 1,4670 1,1044 24,72%
2 1,4670 1,1049 24,68%
3 1,4670 1,1063 24,59%
Keterangan
Contoh perhitungan
Formula 1 bets 1 replikasi 1
Penilaian uji pengukuran pembersihan sediaan sampo ekstrak kering seledri (Apium graveolens L.)
Formula Replikasi Bets 1 Bets 2
I
1 24,82% 24,78%
2 24,79% 24,80%
3 24,78% 24,79 %
X
± SD 24,80%±0,02 24,79%±0,02II
1 24,58% 24,60%
2 24,60% 24,64%
3 24,65% 24,62%
X
± SD 24,61%±0,04 24,62%±0,02III 1 24,72% 24,75%
2 24,68% 24,73%
3 24,59% 24,71%
X
± SD 24,66%±0,07 24,73%±0,02Basis
1 2 3
24,58% 24,60% 24,65%
24,72% 24,68% 24,59%
X
± SD 24,61%±0,04 24,66%±0,07Keterangan
HASIL STATISTIK ANTAR BETS
Uji Statistik pengukuran pembersihan antar bets mengunakan
independent t-test
Lampiran Hasil perhitungan Statistik Uji t-bebas pada
pengukuran pembersihan dalam sampo
Formula I Bets 1 dan Bets 2
Group StatisticsBets N Mean Std. Deviation Std. Error Mean
Pengukuran_pembersihan 1.00 3 24.7967 .02082 .01202
2.00 3 24.7900 .01000 .00577
Independent Samples Test
Levene's Test for Equality of
Variances t-test for Equality of Means
95% Confidence Interval of the
Difference
F Sig. T df Sig.
(2-tailed) Mean Differen
ce
Std. Error Differen
ce Lower Upper
Pengukuran_p embersihan
Equal variances assumed
2.286 .205 .500 4 .643 .00667 .01333 -.03035 .04369
Equal variances not assumed
.500 2.876 .653 .00667 .01333 -.03682 .05015
Lampiran Hasil perhitungan Statistik Uji t-bebas pada
pengukuran pembersihan dalam sampo
FormulaII Bets 1 dan Bets 2
Group StatisticsBets N Mean Std. Deviation Std. Error Mean
Pengukuran_pembersihan 1.00 3 24.6100 .03606 .02082
2.00 3 24.6200 .02000 .01155
Levene's Test for Equality of
Variances t-test for Equality of Means
95% Confidence Interval of the
Difference
F Sig. T df
Sig. (2-tailed) Mean Difference Std. Error Differen
ce Lower Upper
Pengukuran_pem bersihan
Equal variances assumed
1.455 .294 -.420 4 .696 -.01000 .02380 -.07609 .05609
Equal variances not assumed
-.420 3.124 .702 -.01000 .02380 -.08408 .06408
Lampiran Hasil perhitungan Statistik Uji t-bebas pada
pengukuran pembersihan dalam sampo
Formula III Bets 1 dan Bets 2
Group StatisticsBets N Mean Std. Deviation Std. Error Mean
Pengukuran_pembersihan 1.00 3 24.6633 .06658 .03844
2.00 3 24.7300 .02000 .01155
Independent Samples Test
Levene's Test for Equality of
Variances t-test for Equality of Means
95% Confidence Interval of the
Difference
F Sig. T Df Sig.
(2-tailed) Mean Difference
Std. Error
Difference Lower Upper
Pengukuran_p embersihan
Equal variances assumed
3.864 .121 -1.661
4 .172 -.06667 .04014 -.17811 .04478
Equal variances not assumed -1.661 2.35 8
.219 -.06667 .04014 -.21652 .08319
Basis Bets 1 dan Bets 2
Group StatisticsBets N Mean Std. Deviation Std. Error Mean
Pengukuran_pembersihan 1.00 3 24.6100 .03606 .02082
2.00 3 24.6633 .06658 .03844
Independent Samples Test
Levene's Test for Equality of
Variances t-test for Equality of Means
95% Confidence Interval of the
Difference
F Sig. T df Sig.
(2-tailed) Mean Difference
Std. Error
Difference Lower Upper
Pengukuran_pemb ersihan
Equal variances assumed
1.370 .307 -1.220
4 .289 -.05333 .04372 -.17471 .06804 Equal variances not assumed -1.220 3.08 0
.308 -.05333 .04372 -.19043
.08377
HASIL STATISTIK ANTAR FORMULA
Uji Statistik pengukuran pembersihan antar formula
mengunakan
One way anova
Descriptive Statistics
N Minimum Maximum Mean Std. Deviation
Pengukuran_pembersihan 24 24.58 24.82 24.6854 .08113 Valid N (listwise) 24
ANOVA
Pengukuran_pembersihan
Sum of Squares Df Mean Square F Sig.
Between Groups .115 3 .038 2.797 .000
Within Groups .037 20 .002
LAMPIRAN J
HASIL UJI KEMAMPUAN MENGHASILKAN BUSA SAMPO
EKSTRAK KERING SELEDRI (
APIUM GRAVEOLENS
L.)
Penilaian uji Kemampuan Menghasilkan Busa sediaan sampo ekstrak kering seledri (Apium graveolens L.)
Formula Replikasi Bets 1 Bets 2
I 1 2 2
2 2 2
3 2 2
II 1 2 2
2 2 2
3 2 2
III 1 2 2
2 2 2
3 2 2
Basis 1 2 2
2 2 2
3 2 2
Keterangan
HASIL STATISTIK ANTAR BETS
Uji Statistik kemampuan menghasilkan busa antar bets
mengunakan
independent t-test
Lampiran Hasil perhitungan Statistik Uji t-bebas pada
kemampuan menghasilkan busa
Formula I Bets 1 dan Bets 2
Group StatisticsBets N Mean Std. Deviation
Std. Error Mean
Kemampuan_menghasilkan_ busa
1.00 3 7.8333 .28868 .16667
2.00 3 7.8333 .28868 .16667
Independent Samples Test
Levene's Test for Equality of
Variances t-test for Equality of Means 95% Confidence Interval of the
Difference
F Sig. T df Sig. (2-tailed) Mean Differe nce Std. Error Differe
nce Lower Upper
Kema mpuan _meng hasilka n_busa Equal variances assumed
.000 1.000 .000 4 1.000 .00000 .23570 -.65441 .65441
Equal variances not assumed
.000 4.00 0
1.000 .00000 .23570 -.65441 .65441
Lampiran Hasil perhitungan Statistik Uji t-bebas pada
kemampuan menghasilkan busa
Formula II Bets 1 dan Bets 2
Group StatisticsBets N Mean Std. Deviation Std. Error Mean
Kemampuan_menghasilkan_bus a
1.00 3 7.8333 .28868 .16667
2.00 3 7.8333 .28868 .16667
Levene's Test for Equality of
Variances t-test for Equality of Means
95% Confidence Interval of the
Difference
F Sig. t Df Sig. (2-tailed) Mean Difference Std. Error Differenc
e Lower Upper
Kemampuan_meng hasilkan_busa
Equal variances assumed
.000 1.000 .000 4 1.000 .00000 .23570 -.65441 .65441
Equal variances not assumed
.000 4.000 1.000 .00000 .23570 -.65441 .65441
Lampiran Hasil perhitungan Statistik Uji t-bebas pada
kemampuan menghasilkan busa
Formula III Bets 1 dan Bets 2
Group StatisticsBets N Mean Std. Deviation Std. Error Mean
Kemampuan_meng hasilkan_busa
1.00 3 7.8333 .28868 .16667
2.00 3 8.0000 .00000 .00000
Independent Samples Test
Levene's Test for Equality
of Variances t-test for Equality of Means
95% Confidence Interval of the
Difference
F Sig. t df Sig. (2-tailed) Mean Difference Std. Error Differe
nce Lower Upper
Kemampuan _menghasilk an_busa Equal variances assumed
16.000 .016 -1.000
4 .374 -.16667 .16667 -.62941 .29607
Equal variances not assumed -1.000 2.0 00
Lampiran Hasil perhitungan Statistik Uji t-bebas pada
kemampuan menghasilkan busa
Basis Bets 1 dan Bets 2
Group StatisticsBets N Mean Std. Deviation Std. Error Mean
Kemampuan_menghasilkan_busa 1.00 3 8.0000 .00000 .00000
2.00 3 7.8333 .28868 .16667
Independent Samples Test
Levene's Test for Equality of
Variances t-test for Equality of Means
95% Confidence Interval of the
Difference
F Sig. t df Sig. (2-tailed) Mean Difference Std. Error Difference Low er Upper
Kemampuan_mengh asilkan_busa
Equal variances assumed
16.000 .016 1.000 4 .374 .16667 .16667 -.296 07 .62941 Equal variances not assumed
1.000 2.000 .423 .16667 .16667 -.550 44
.88378
HASIL STATISTIK ANTAR FORMULA
Uji Statistik kemampuan menghasilkan busa antar formula
mengunakan
One way anova
Descriptive Statistics
N Minimum Maximum Mean Std. Deviation
Kemampuan_menghasilkan_busa 24 7.50 8.00 7.8750 .22116 Valid N (listwise) 24
ANOVA
Kemampuan_menghasilkan_busa
Sum of Squares Df Mean Square F Sig.
Between Groups .042 3 .014 .256 .856
Within Groups 1.083 20 .054
LAMPIRAN K
HASIL UJI STABILITAS MENGHASILKAN BUSA SAMPO
EKSTRAK KERING SELEDRI (
APIUM GRAVEOLENS
L.)
Penilaian uji Stabilitas Busa sediaan sampo ekstrak kering seledri (Apium graveolens L.)
Formula Replikasi Bets 1 Bets 2
I
1 8 cm 8 cm
2 7,5 cm 8 cm
3 8 cm 7,5 cm
X
± SD 7,83 ±0,33 cm 7,83 ±0,33 cmII
1 7,5 cm 8 cm
2 8 cm 7,5 cm
3 8 cm 8 cm
X
± SD 7,83 ±0,33 cm 7,83 ±0,33 cmIII 1 8 cm 8 cm
2 7,5 cm 8 cm
3 8 cm 8 cm
X
± SD 7,83 ±0,33 cm 8 cmBasis
1 2 3
8 cm 8 cm 8 cm
7,5 cm 8 cm 8 cm
X
± SD 8 cm 7,83 ±0,33 cmKeterangan
HASIL STATISTIK ANTAR BETS
Uji Statistik stabilitas busa antar bets mengunakan
wilcoxon
Lampiran Hasil perhitungan Statistik wilcoxon pada Stabilitas
Busa
Formula I Bets 1 dan Bets 2
Descriptive StatisticsN Mean Std. Deviation Minimum Maximum
Bets_1 3 2.0000 .00000 2.00 2.00
Bets_2 3 2.0000 .00000 2.00 2.00
Test Statisticsb
Bets_2 - Bets_1
Z .000a
Asymp. Sig. (2-tailed) 1.000
a. The sum of negative ranks equals the sum of positive ranks. b. Wilcoxon Signed Ranks Test
Lampiran Hasil perhitungan Statistik wilcoxon pada Stabilitas
Busa
Formula II Bets 1 dan Bets 2
Descriptive Statistics
N Mean Std. Deviation Minimum Maximum
Bets_1 3 2.0000 .00000 2.00 2.00
Bets_2 3 2.0000 .00000 2.00 2.00
Test Statisticsb
Bets_2 - Bets_1
Z .000a
Asymp. Sig. (2-tailed) 1.000
Lampiran Hasil perhitungan Statistik wilcoxon pada Stabilitas
Busa
Formula III Bets 1 dan Bets 2
Descriptive Statistics
N Mean Std. Deviation Minimum Maximum
Bets_1 3 2.0000 .00000 2.00 2.00
Bets_2 3 2.0000 .00000 2.00 2.00
Test Statisticsb
Bets_2 - Bets_1
Z .000a
Asymp. Sig. (2-tailed) 1.000
a. The sum of negative ranks equals the sum of positive ranks. b. Wilcoxon Signed Ranks Test
Lampiran Hasil perhitungan Statistik wilcoxon pada Stabilitas
busa
Basis Bets 1 dan Bets 2
Descriptive StatisticsN Mean Std. Deviation Minimum Maximum
Bets_1 3 2.0000 .00000 2.00 2.00
Bets_2 3 2.0000 .00000 2.00 2.00
Test Statisticsb
Bets_2 - Bets_1
Z .000a
Asymp. Sig. (2-tailed) 1.000
HASIL STATISTIK ANTAR FORMULA
Perhitungan Nilai
Chi-square
dengan metode
Friedman test
secara manual
Lampiran Hasil perhitungan Statistik
Friedman test
pada
Stabilitas busa antar formula
Hasil penetapan peringkat dan analisis statistik uji stabilitas busa
Bets Rep Formula 0 Formula 1 Formula 2 Formula 3
Skor Peringkat Skor Peringkat Skor Peringkat Skor Peringkat
1 1 2 2,5 2 2,5 2 2,5 2 2,5
2 2 2,5 2 2,5 2 2,5 2 2,5
3 2 2,5 2 2,5 2 2,5 2 2,5
2 1 2 2,5 2 2,5 2 2,5 2 2,5
2 2 2,5 2 2,5 2 2,5 2 2,5
3 2 2,5 2 2,5 2 2,5 2 2,5
Jumlah pengamatan
6 6 6 6
Jumlah peringkat
15 15 15 15
Keterangan
I : Formula dengan konsentrasi xanthan gum 0,1% II : Formula dengan konsentrasi xanthan gum 0,3% III : Formula dengan konsentrasi xanthan gum 0,5% Blangko : Blangko tanpa xanthan gum
= 0
Chi-square
hit(0)
< Chi-square
tabel(11,070)
,sehingga tidak ada
LAMPIRAN L
HASIL UJI TEGANGAN PERMUKAAN SAMPO EKSTRAK
KERING SELEDRI (
APIUM GRAVEOLENS
L.)
Diketahui:
Percepatan gravitasi = 9,8 m/s = 980 cm/s
Massa kawat = 1,2 gram
Panjang benang = 8 cm
Panjang kawat = 6 cm
Nilai uji tegangan permukaan sediaan sampo ekstrak kering seledri (Apium graveolens L.)
Pengamatan Panjang
bagian benang yang sempit
Jari-jari Tegangan permukaan
(dyne/cm)
Formula I Bets I 1 3,5 7,025 33.5
2 3,2 6.414 36.68
3 3,3 6.601 35.63
Bets II 1 3,3 6.601 35.63
2 3,4 6.804 34.57
3 3,4 6.804 34.57
Formula II Bets I 1 3 6.083 38.77
2 3,2 6.414 36.68
3 3,4 6.804 34.57
Bets II 1 3,2 6.414 36.68
2 3,3 6.601 35.63
3 3,3 6.601 35.63
Formula III Bets I 1 3,3 6.601 35.63
2 3,2 6.414 36.68
3 3,4 6.804 34.57
Bets II 1 3,2 6.414 36.68
2 3,4 6.804 34.57
3 3,5 7,025 33.5
Basis Bets I 1 3,2 6.414 36.68
2 3,4 6.804 34.57
3 3,5 7,025 33.5
Bets II 1 3,3 6.601 35.63
2 3,4 6.804 34.57
3 3,4 6.804 34.57
Keterangan
I : Formula dengan konsentrasi xanthan gum 0,1% II : Formula dengan konsentrasi xanthan gum 0,3% III : Formula dengan konsentrasi xanthan gum 0,5% Blangko : Blangko tanpa xanthan gum
Contoh perhitungan
Cara menghitung Tegangan Permukaan
HASIL STATISTIK ANTAR BETS
Uji Statistik tegangan permukaan antar bets mengunakan
independent t-test
Lampiran Hasil perhitungan Statistik Uji t-bebas pada tegangan
permukaan
Formula I Bets 1 dan Bets 2
Independent Samples Test
Levene's Test for Equality of
Variances t-test for Equality of Means
95% Confidence Interval of the
Difference
F Sig. T df Sig. (2-tailed) Mean Differe nce Std. Error Differe
nce Lower Upper
Tegangan_p ermukaan
Equal variances assumed
2.607 .182 .347 4 .746 .34667 .99997 -2.42970
3.12303
Equal variances not assumed
.347 2.55 9
.755 .34667 .99997 -3.16935
3.86268
Lampiran Hasil perhitungan Statistik Uji t-bebas pada tegangan
permukaan
Formula II Bets 1 dan Bets 2
Group Statistics
Bets N Mean Std. Deviation Std. Error Mean
Tegangan_permukaan 1.00 3 36.6733 2.10001 1.21244
2.00 3 35.9800 .60622 .35000
Group Statistics
Bets N Mean Std. Deviation Std. Error Mean
Tegangan_permukaan 1.00 3 35.2700 1.62028 .93547
Independent Samples Test
Levene's Test for Equality of
Variances t-test for Equality of Means
95% Confidence Interval of the
Difference
F Sig. t Df Sig. (2-tailed) Mean Differe nce Std. Error Differenc
e Lower Upper
Tegangan_p ermukaan
Equal variances assumed
1.749 .257 .549 4 .612 .69333 1.26195 -2.8103 9 4.19706 Equal variances not assumed
.549 2.33 1
.631 .69333 1.26195 -4.0604 6
5.44713
Lampiran Hasil perhitungan Statistik Uji t-bebas pada tegangan
permukaan
Formula III Bets 1 dan Bets 2
Group StatisticsBets N Mean Std. Deviation Std. Error Mean
Tegangan_permukaan 1.00 3 35.6267 1.05500 .60911
2.00 3 34.9167 1.61810 .93421
Independent Samples Test
Levene's Test for Equality of
Variances t-test for Equality of Means
95% Confidence Interval of the
Difference
F Sig. T df Sig. (2-tailed) Mean Differen ce Std. Error Differen
ce Lower Upper
Tegangan_p ermukaan
Equal variances assumed
.728 .441 .637 4 .559 .71000 1.11524 -2.38640
3.80640
Equal variances not assumed
.637 3.440 .564 .71000 1.11524 -2.59561
Lampiran Hasil perhitungan Statistik Uji t-bebas pada tegangan
permukaan
Basis Bets 1 dan Bets 2
Group StatisticsBets N Mean Std. Deviation Std. Error Mean
Tegangan_permukaan 1.00 3 34.9167 1.61810 .93421
2.00 3 34.9233 .61199 .35333
Independent Samples Test
Levene's Test for Equality of
Variances t-test for Equality of Means
95% Confidence Interval of the
Difference
F Sig. t df Sig. (2-tailed) Mean Differe nce Std. Error Difference Lowe r Upper
Tegangan_ permukaan
Equal variances assumed
2.536 .186 -.007
4 .995 -.00667
.99879 -2.779 76 2.76643 Equal variances not assumed -.007 2.56 1
.995 -.00667
.99879 -3.517 16
3.50383
HASIL STATISTIK ANTAR FORMULA
Uji Statistik tegangan permukaan antar formula mengunakan
One way anova
Descriptive Statistics
N Minimum Maximum Mean Std. Deviation
Tegangan_permukaan 24 33.50 38.77 35.4037 1.28275 Valid N (listwise) 24
ANOVA
Tegangan_permukaan
Sum of Squares df Mean Square F Sig.
Between Groups 7.185 3 2.395 1.562 .230
Within Groups 30.660 20 1.533
LAMPIRAN M
HASIL UJI KEMAMPUAN DETERGENT SAMPO EKSTRAK
KERING SELEDRI (
APIUM GRAVEOLENS
L.)
Nilai uji kemampuan detergent sediaan sampo ekstrak kering seledri (Apium graveolens L.)
Pengamatan Berat
Control
Berat Sampel uji
% Pengukuran Pembersihan
Formula I Bets 1 1 5,0716 1,6305 67,85%
2 5,0716 1,5752 68,94%
3 5,0716 1,6052 68,35%
Bets 2 1 5,0716 1,5905 68,64%
2 5,0716 1,6508 67,45%
3 5,0716 1,6275 67,91%
Formula II Bets 1 1 5,0716 1,6112 68,23%
2 5,0716 1,5849 68,75%
3 5,0716 1,5783 68,88%
Bets 2 1 5,0716 1,6305 67,85%
2 5,0716 1,5732 68,98%
3 5,0716 1,5905 68,64%
Formula III Bets 1 1 5,0716 1,5757 68,93%
2 5,0716 1,5854 68,74%
3 5,0716 1,5849 68,75%
Bets 2 1 5,0716 1,6011 68,43%
2 5,0716 1,6168 68,12%
3 5,0716 1,6183 68,09%
Basis Bets 1 1 5,0716 1,6168 68,12%
2 5,0716 1,6204 68,05%
3 5,0716 1,6123 68,21%
Bets 2 1 5,0716 1,6168 68,09%
2 5,0716 1,6209 68,04%
3 5,0716 1,6011 68,43%
Keterangan
Contoh perhitungan
Formula 1 Bets 1 Replikasi 1
Nilai uji Kemampuan detergen sediaan sampo ekstrak kering seledri (Apium graveolens L.)
Formula Replikasi Bets 1 Bets 2
I
1 67,85% 68,64%
2 68,94% 67,45%
3 68,35% 67,91%
X
± SD 68,38%±0,56 68,00%±0,64II
1 68,23% 67,85%
2 68,75% 68,98%
3 68,88% 68,64%
X
± SD 68,62%±0,39 68,49%±0,64III 1 68,93% 68,43%
2 68,74% 68,12%
3 68,75% 68,09%
X
± SD 68,81%±0,12 68,21%±0,22Basis
1 2 3
68,12% 68,05% 68,21%
68,09% 68,04% 68,43%
X
± SD 68,13%±0,08 68,19%±0,24Keterangan
HASIL STATISTIK ANTAR BETS
Uji Statistik kemampuan detergent antar bets mengunakan
independent t-test
Lampiran Hasil perhitungan Statistik Uji t-bebas pada
kemampuan detergent
Formula I Bets 1 dan Bets 2
Group StatisticsBets N Mean Std. Deviation Std. Error Mean
Kemampuan_detergent Formula 1 3 68.3800 .54562 .31501
Formula 2 3 68.0000 .60008 .34646
Independent Samples Test
Levene's Test for Equality of
Variances t-test for Equality of Means
95% Confidence Interval of the
Difference
F Sig. t df Sig.
(2-tailed) Mean Differen
ce
Std. Error Differen
ce Lower Upper
Kemampuan_ detergent
Equal variances assumed
.049 .836 .812 4 .463 .38000 .46826 -.92010 1.68010
Equal variances not assumed
.812 3.964 .463 .38000 .46826 -.92472 1.68472
Lampiran Hasil perhitungan Statistik Uji t-bebas pada
kemampuan detergent
Formula II Bets 1 dan Bets 2
Group Statistics
Bets N Mean Std. Deviation Std. Error Mean
Kemampuan_detergent Formula 1 3 68.6200 .34395 .19858
Independent Samples Test
Levene's Test for Equality of
Variances t-test for Equality of Means
95% Confidence Interval of the
Difference
F Sig. T df Sig. (2-tailed) Mean Differe nce Std. Error Differe
nce Lower Upper
Kemampuan _detergent
Equal variances assumed
1.043 .365 .334 4 .755 .13000 .38919 -.95056 1.21056
Equal variances not assumed
.334 3.25 3
.759 .13000 .38919 -1.05587
1.31587
Lampiran Hasil perhitungan Statistik Uji t-bebas pada
kemampuan detergent
Formula III Bets 1 dan Bets 2
Group StatisticsBets N Mean Std. Deviation Std. Error Mean
Kemampuan_detergent Formula 1 3 68.8067 .10693 .06173
Formula 2 3 68.2133 .18824 .10868
Independent Samples Test
Levene's Test for Equality
of Variances t-test for Equality of Means 95% Confidence
Interval of the Difference
F Sig. T df Sig. (2-tailed) Mean Differe nce Std. Error Differe
nce Lower Upper
Kemampuan_det ergent
Equal variances assumed
2.139 .217 4.74 7
4 .009 .59333 .12499 .24631 .94036
Equal variances not assumed 4.74 7 3.16 9
Lampiran Hasil perhitungan Statistik Uji t-bebas pada
kemampuan detergent
Basis Bets 1 dan Bets 2
Group StatisticsBets N Mean Std. Deviation Std. Error Mean
Kemampuan_detergent Formula 1 3 68.1267 .08021 .04631
Formula 2 3 68.1867 .21221 .12252
Independent Samples Test
Levene's Test for Equality
of Variances t-test for Equality of Means
95% Confidence Interval of the
Difference
F Sig. t df
Sig. (2-tailed)
Mean Differen
ce
Std. Error Differenc
e Lower Upper
Kemampuan_deter gent
Equal variances assumed
4.636 .098 -.458 4 .671 -.06000 .13098 -.42366 .30366
Equal variances not assumed
-.458 2.560 .683 -.06000 .13098 -.52045 .40045
HASIL STATISTIK ANTAR FORMULA
Uji Statistik kemampuan detergen antar formula mengunakan
One way anova
Descriptive Statistics
N Minimum Maximum Mean Std. Deviation
Kemampuan_detergent 24 67.45 68.98 68.3529 .41598
Valid N (listwise) 24
ANOVA
Kemampuan_detergent
Sum of Squares Df Mean Square F Sig.
Between Groups .783 3 .261 1.634 .213
Within Groups 3.196 20 .160
LAMPIRAN N
HASIL UJI IRITASI MATA SAMPO EKSTRAK KERING
SELEDRI (
APIUM GRAVEOLENS
L.)
Penilaian uji iritasi mata sediaan sampo ekstrak kering seledri (Apium graveolens L.)
Formula Replikasi Bets 1 Bets 2
I 1 2 2
2 2 2
3 2 2
II 1 2 2
2 2 2
3 2 2
III 1 2 2
2 2 2
3 2 2
Basis 1 2 2
2 2 2
3 2 2
Keterangan
HASIL STATISTIK ANTAR BETS
Uji Statistik iritasi mata antar bets mengunakan
wilcoxon
Lampiran Hasil perhitungan Statistik wilcoxon pada Iritasi
Mata
Formula I Bets 1 dan Bets 2
Descriptive StatisticsN Mean Std. Deviation Minimum Maximum
Bets_1 3 2.0000 .00000 2.00 2.00
Bets_2 3 2.0000 .00000 2.00 2.00
Test Statisticsb
Bets_2 - Bets_1
Z .000a
Asymp. Sig. (2-tailed) 1.000 a. The sum of negative ranks equals the sum of positive ranks.
b. Wilcoxon Signed Ranks Test
Lampiran Hasil perhitungan Statistik wilcoxon pada Iritasi mata
Formula II Bets 1 dan Bets 2
Descriptive Statistics
N Mean Std. Deviation Minimum Maximum
Bets_1 3 2.0000 .00000 2.00 2.00
Bets_2 3 2.0000 .00000 2.00 2.00
Test Statisticsb
Bets_2 - Bets_1
Z .000a
Asymp. Sig. (2-tailed) 1.000
Lampiran Hasil perhitungan Statistik wilcoxon pada Iritasi mata
Formula III Bets 1 dan Bets 2
Descriptive Statistics
N Mean Std. Deviation Minimum Maximum
Bets_1 3 2.0000 .00000 2.00 2.00
Bets_2 3 2.0000 .00000 2.00 2.00
Test Statisticsb
Bets_2 - Bets_1
Z .000a
Asymp. Sig. (2-tailed) 1.000
a. The sum of negative ranks equals the sum of positive ranks. b. Wilcoxon Signed Ranks Test
Lampiran Hasil perhitungan Statistik wilcoxon pada Iritasi mata
Basis Bets 1 dan Bets 2
Descriptive Statistics
N Mean Std. Deviation Minimum Maximum
Bets_1 3 2.0000 .00000 2.00 2.00
Bets_2 3 2.0000 .00000 2.00 2.00
Test Statisticsb
Bets_2 - Bets_1
Z .000a
Asymp. Sig. (2-tailed) 1.000
HASIL STATISTIK ANTAR FORMULA
Perhitungan Nilai
Chi-square
dengan metode
Friedman test
secara manual
Lampiran Hasil perhitungan Statistik
Friedman test
pada Iritasi
mata antar formula
Hasil penetapan peringkat dan analisis statistik uji iritasi mata
Bets Rep Formula 0 Formula 1 Formula 2 Formula 3
Skor Peringkat Skor Peringkat Skor Peringkat Skor Peringkat
1 1 2 2,5 2 2,5 2 2,5 2 2,5
2 2 2,5 2 2,5 2 2,5 2 2,5
3 2 2,5 2 2,5 2 2,5 2 2,5
2 1 2 2,5 2 2,5 2 2,5 2 2,5
2 2 2,5 2 2,5 2 2,5 2 2,5
3 2 2,5 2 2,5 2 2,5 2 2,5
Jumlah pengamatan
6 6 6 6
Jumlah peringkat
15 15 15 15
Keterangan
I : Formula dengan konsentrasi xanthan gum 0,1% II : Formula dengan konsentrasi xanthan gum 0,3% III : Formula dengan konsentrasi xanthan gum 0,5% Blangko : Blangko tanpa xanthan gum
= 0
Chi-square
hit(0)
< Chi-square
tabel(11,070)
,sehingga tidak ada
LAMPIRAN O
HASIL UJI IRITASI KULIT SAMPO EKSTRAK KERING
SELEDRI (
APIUM GRAVEOLENS
L.)
HASIL STATISTIK ANTAR BETS
Uji Statistik iritasi kulit antar bets mengunakan
wilcoxon
Lampiran Hasil perhitungan Statistik wilcoxon pada Iritasi
Kulit
Formula I Bets 1 dan Bets 2
Descriptive StatisticsN Mean Std. Deviation Minimum Maximum
Bets_1 10 2.0000 .00000 2.00 2.00
Bets_2 10 2.0000 .00000 2.00 2.00
Test Statisticsb
Bets_2 - Bets_1
Z .000a
Asymp. Sig. (2-tailed) 1.000
a. The sum of negative ranks equals the sum of positive ranks. b. Wilcoxon Signed Ranks Test
Lampiran Hasil perhitungan Statistik wilcoxon pada Iritasi
Kulit
Formula II Bets 1 dan Bets 2
Descriptive Statistics
N Mean Std. Deviation Minimum Maximum
Bets_1 10 2.0000 .00000 2.00 2.00
Bets_2 10 2.0000 .00000 2.00 2.00
Test Statisticsb
Bets_2 - Bets_1
Z .000a
Asymp. Sig. (2-tailed) 1.000
Lampiran Hasil perhitungan Statistik wilcoxon pada Iritasi
Kulit
Formula III Bets 1 dan Bets 2
Descriptive Statistics
N Mean Std. Deviation Minimum Maximum
Bets_1 10 2.0000 .00000 2.00 2.00
Bets_2 10 2.0000 .00000 2.00 2.00
Test Statisticsb
Bets_2 - Bets_1
Z .000a
Asymp. Sig. (2-tailed) 1.000
a. The sum of negative ranks equals the sum of positive ranks. b. Wilcoxon Signed Ranks Test
Lampiran Hasil perhitungan Statistik wilcoxon pada Iritasi kulit
Basis Bets 1 dan Bets 2
Descriptive Statistics
N Mean Std. Deviation Minimum Maximum
Bets_1 10 2.0000 .00000 2.00 2.00
Bets_2 10 2.0000 .00000 2.00 2.00
Test Statisticsb
Bets_2 - Bets_1
Z .000a
Asymp. Sig. (2-tailed) 1.000
HASIL STATISTIK ANTAR FORMULA
Perhitungan Nilai
Chi-square
dengan metode
Friedman test
secara manual
Lampiran Hasil perhitungan Statistik
Friedman test
pada Iritasi
Kulit antar formula
Hasil penetapan peringkat dan analisis statistik uji keamanan (iritasi)
Bets Rep Formula 0 Formula 1 Formula 2 Formula 3
Skor Peringkat Skor Peringkat Skor Peringkat Skor Peringkat
1 1 2 2,5 2 2,5 2 2,5 2 2,5
2 2 2,5 2 2,5 2 2,5 2 2,5
3 2 2,5 2 2,5 2 2,5 2 2,5
2 1 2 2,5 2 2,5 2 2,5 2 2,5
2 2 2,5 2 2,5 2 2,5 2 2,5
3 2 2,5 2 2,5 2 2,5 2 2,5
Jumlah pengamatan
6 6 6 6
Jumlah peringkat
15 15 15 15
Keterangan
I : Formula dengan konsentrasi xanthan gum 0,1% II : Formula dengan konsentrasi xanthan gum 0,3% III : Formula dengan konsentrasi xanthan gum 0,5% Blangko : Blangko tanpa xanthan gum
= 0
Chi-square
hit(0)
< Chi-square
tabel(16,919)
,sehingga tidak terdapat
LAMPIRAN P
HASIL UJI KESUKAAN SAMPO EKSTRAK KERING
SELEDRI (
APIUM GRAVEOLENS
L.)
HASIL STATISTIK ANTAR BETS
Uji Statistik kesukaan antar bets mengunakan
wilcoxon
Lampiran Hasil perhitungan Statistik wilcoxon pada uji
Kesukaan
Formula I Bets 1 dan Bets 2
Descriptive StatisticsN Mean Std. Deviation Minimum Maximum
Bets_1 10 2.0000 .00000 2.00 2.00
Bets_2 10 2.0000 .00000 2.00 2.00
Test Statisticsb
Bets_2 - Bets_1
Z .000a
Asymp. Sig. (2-tailed) 1.000
a. The sum of negative ranks equals the sum of positive ranks. b. Wilcoxon Signed Ranks Test
Lampiran Hasil perhitungan Statistik wilcoxon pada uji
Kesukaan
Formula II Bets 1 dan Bets 2
Descriptive Statistics
N Mean Std. Deviation Minimum Maximum
Bets_1 10 2.0000 .00000 2.00 2.00
Bets_2 10 2.0000 .00000 2.00 2.00
Test Statisticsb
Bets_2 - Bets_1
Z .000a
Asymp. Sig. (2-tailed) 1.000
Lampiran Hasil perhitungan Statistik wilcoxon pada uji
Kesukaan
Formula III Bets 1 dan Bets 2
Descriptive Statistics
N Mean Std. Deviation Minimum Maximum
Bets_1 10 2.0000 .00000 2.00 2.00
Bets_2 10 2.0000 .00000 2.00 2.00
Test Statisticsb
Bets_2 - Bets_1
Z .000a
Asymp. Sig. (2-tailed) 1.000
a. The sum of negative ranks equals the sum of positive ranks. b. Wilcoxon Signed Ranks Test
Lampiran Hasil perhitungan Statistik wilcoxon pada uji
Kesukaan
Basis Bets 1 dan Bets 2
Descriptive StatisticsN Mean Std. Deviation Minimum Maximum
Bets_1 10 2.0000 .00000 2.00 2.00
Bets_2 10 2.0000 .00000 2.00 2.00
Test Statisticsb
Bets_2 - Bets_1
Z .000a
Asymp. Sig. (2-tailed) 1.000
HASIL STATISTIK ANTAR FORMULA
Perhitungan Nilai
Chi-square
dengan metode
Friedman test
secara manual
Lampiran Hasil perhitungan Statistik
Friedman test
pada uji
Kesukaan antar formula
Hasil penetapan peringkat dan analisis statistik uji kesukaan
Bets Rep Formula 0 Formula 1 Formula 2 Formula 3
Skor Peringkat Skor Peringkat Skor Peringkat Skor Peringkat
1 1 2 2,5 2 2,5 2 2,5 2 2,5
2 2 2,5 2 2,5 2 2,5 2 2,5
3 2 2,5 2 2,5 2 2,5 2 2,5
2 1 2 2,5 2 2,5 2 2,5 2 2,5
2 2 2,5 2 2,5 2 2,5 2 2,5
3 2 2,5 2 2,5 2 2,5 2 2,5
Jumlah pengamatan
6 6 6 6
Jumlah peringkat
15 15 15 15
Keterangan
I : Formula dengan konsentrasi xanthan gum 0,1% II : Formula dengan konsentrasi xanthan gum 0,3% III : Formula dengan konsentrasi xanthan gum 0,5% Blangko : Blangko tanpa xanthan gum
= 0
Chi-square
hit(0)
< Chi-square
tabel(16,919)
,sehingga tidak terdapat
LAMPIRAN Q
LEMBAR KUISIONER PANELIS UNTUK PENGUJIAN
IRITASI KULIT PADA SEDIAAN SAMPO EKSTRAK
LAMPIRAN R
LEMBAR KUISIONER PANELIS UNTUK PENGUJIAN
KESUKAAN TERHADAP SEDIAAN SAMPO EKSTRAK
LAMPIRAN S
TABEL- TABEL
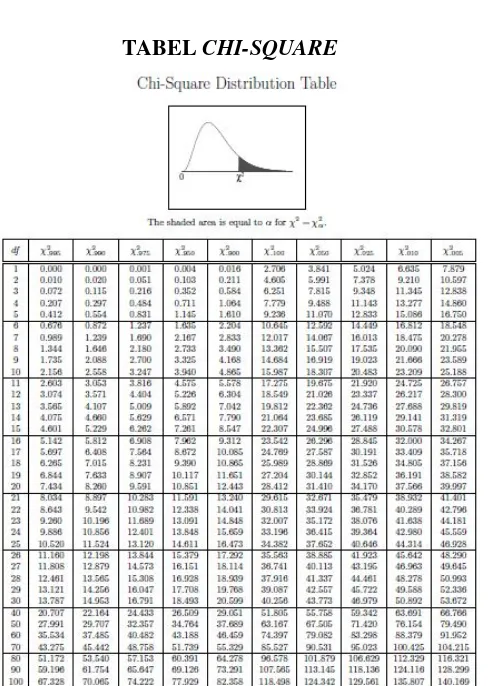
TABEL
CHI-SQUARE
Cara Melihat Chi-square tabel adalah dari data statistik dikurangi 1.
Contoh:
Data yang dimiliki 6 data. Maka 6 data dikurangi 1. Maka
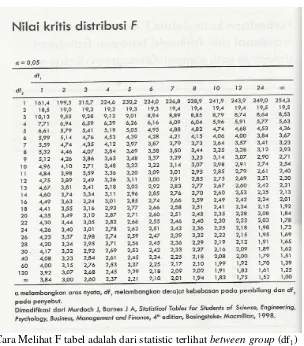
TABEL F
Cara Melihat F tabel adalah dari statistic terlihat
between group
(df
1)
dan
within group
(df
2).
Contoh:
between group
(df
1)= 3
dan
within group
(df
2) = 20. Maka
F tabel
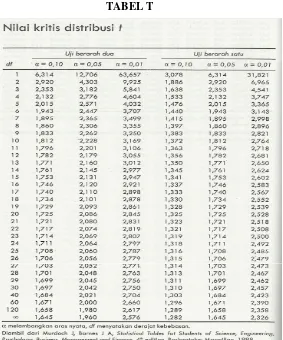
TABEL T
Cara Melihat t tabel adalah dari data statistik dikurangi 2 apabila
menggunakan statistik
independent t-test.
Contoh:
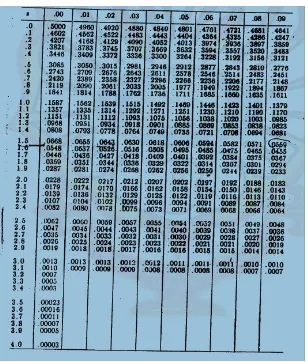
TABEL Z
Cara Melihat Z tabel adalah dari data statistik dikurangi 1.
Contoh:
LAMPIRAN T