JEJAK
Journal of Economics and Policy http://journal.unnes.ac.id/nju/index.php/jejak
Analysis of Economic Growth Factors in West Pantura Areas of
Central Java
Sarwono1
1Diponegoro University, Indonesia
Permalink/DOI: http://dx.doi.org/10.15294/jejak.v9i1.7204
Received: January 2016; Accepted: February 2016; Published: March 2016
Abstract
There are six factors of economic growth which influence on the economic growth level is analyzed in this research. The factors are: General Allocation Fund, government expenditure, investment, quality of human resources, agglomeration, and labor. The analysis tool used ist the regression of data panel/pooled data with the approach of Least Square Dummy Variable (lSDV). This approach is used because it is in accordance with the aim of research, which is to know the role of the economic growth factors to the GDP and to know the rate of economic growth from 2004 to 2013 in the West Pantura (northern coastal) areas of Central Java. From the estimation, it is known that the economic growth factor of human resource is the one that influence the GDP ipm with coefficient of 0.199316 percent, followed by the labor factor with coefficient of 0.165086 percent, an investment of 0.0013066 percent and the government expenditure with coefficient of minus 0.019731 percent. However, the General Allocation Funds does not have much influence on the economic growth, only at 0.009572 percent. Whereas, the agglomeration has no influence on the role of the GDP and on the economic growth in the West Pantura areas of Central Java. The regression result indicates -0.013514 percent.
Keywords: West Pantura, Gross Domestic Product.
How to Cite: Sarwono, S. (2016). Analysis of Economic Growth Factors in West Pantura Areas of Central Java. JEJAK: Jurnal Ekonomi Dan Kebijakan, 9(1), 145-158. doi:http://dx.doi.org/10.15294/jejak.v9i1.7204
© 2016 Semarang State University. All rights reserved
Corresponding author: ISSN 1979-715X
INTRODUCTION
A development in an area essentially is an effort to increase the capacity of government, private sector, society, and relevant stakeholders in managing the economic resources in efficient and effective ways for the progress of the area and the social welfare. Some regions achieve the rapid growth, while other ones experience slower growth. The region that becomes the center of growth is the one that has good enough resources so that its economic activity is quite high and is expected to give a positive impact to the other surrounding areas (trickle down effect). (Achal Kumar, 2010).
Some regions achieve the rapid growth, while some other ones experience slower growth. These regions do not experience the similar progress because they are lack of resources (Sutarno, 2003). As the integral part of the national development, essentially the regional development is an effort to improve the capacity of the local govern-ments to create a powerful capability in implementing the government and giving the maximum service to the society. The decentralization policy is aimed at realizing the region's autonomy.
The West Pantura areas of Central Java or formerly known as the Residency of Pekalongan (next it will be called the former residency of Pekalongan) cover Batang Regency, Pekalongan Regency, Pekalongan City, Pemalang Regency, Tegal Regency, Tegal City, and Brebes Regency.
If further examined, it appears that the five regencies in the former residency of Pekalongan (Batang, Pekalongan, Pemalang, Tegal, and Brebes) are traversed by the path of the northern coastal (Pantura) of East Java, Central Java to West Java and DKI Jakarta. Moreover they have the similar potential and natural resources. The only difference is the width of the area (see the appendix 2, the width of Central Java areas). However, the difference can be seen when examining the economic earnings or the economic macro indicators. This condition is interesting to be researched and examined in science, particularly in economics. Table 1 below provides information on the GRDP in Pantura Areas, compared to the GRDP of Kendal Regency or Central Java Province.
On average, the largest GRDP of the last five years is Brebes Regency with the value of GRDP of Rp 13,162.63 billions, Pemalang Regency with the value of GRDP of Rp 8,937.600 billions, Tegal Regency with the
CENTRAL JAVA
Administrative Distribution
City
Regency
Capital of Regency
East Java
value of GRDP of Rp 8,931.112 billions, Pekalongan Regency with the value of GRDP of Rp 8130.158 billions, Pekalongan City with the value of GRDP of Rp 4,261.886 billions, and the lattest is Tegal City with the value of GRDP of Rp 2,872.128 billions. While Kendal Regency, which is the most eastern region of the West Pantura, has the value of GRDP of Rp 12,163.942. The GRDP value of Kendal Regency is higher than Batang Regency, Pekalongan Regency, Pemalang Regency, Tegal Regency, Pekalongan City, and Tegal City, and slightly below Brebes Regency.
This condition should become a concern. Kendal at least has successfully managed what it owns so that in macro economic way it has successfully empowered its economic resources; the direct impact of the economic growth is as expected. The economic growth in Central Java in 2009-2013 tends to increase as indicated by the growth of GRDP that is continuously increased and almost achieves the national economic growth. Central Java Province achieves on average of 6.168 percent, only closed within 0.57 percent of the national economic growth of 6.73 percent (Table 2).
Table 1. GRDP of West Pantura Areas, Kendal Regency, and GRDP of Central Java Province the period of 2009 - 2013 (billions)
Regency/City 2009 2010 2011 2012 2013 Average
01. Batang Regency 4 685.02 5 268,57 5 865,06 6 492,41 7 219.97 5 928,206
02. Pekalongan Regency 6 436,18 7 230,83 8 033,44 8 934,75 10 014.97 8 130,158
03. Pemalang Regency 7 170,68 7 961,38 8 859,72 9 771,67 10 924.55 8 937,600
04. Tegal Regency 7 129,48 7 936,03 8 798,46 9 802,45 10 989.14 8 931,112
05. Brebes Regency 12 532,52 14 629,93 16 426,88 18 026,80 20 199.86 13 162,638
06. Pekalongan City 3 476,70 3 803,99 4 191,36 4636,01 5 201.37 4 261,886
07. Tegal City 2 387,81 2 635,24 2 846,98 3 091,84 3 398.77 2 872,128
Amount 43 818.39 49 465.98 55 021.89 60 745.93 67 948.63 55 400,164
Kendal Regency 9 555,94 10 778,66 12 130,06 13 431,61 14 923,44 12 163,942
GDP of Central Java Province 347.235,35 390.879,77 441.216,18 497.778,07 561.952,49 447.812,372 Source: GRDP of Central Java Province, 2004-2015
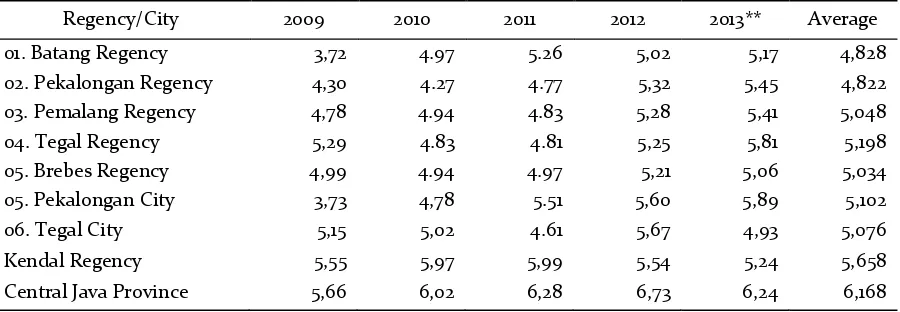
Table 2. Growth Rate of GRDP West Pantura Areas, Kendal Regency and Central Java
Province, in 2009 - 2013 (%)
Regency/City 2009 2010 2011 2012 2013** Average
01. Batang Regency 3,72 4.97 5.26 5,02 5,17 4,828
02. Pekalongan Regency 4,30 4.27 4.77 5,32 5,45 4,822
03. Pemalang Regency 4,78 4.94 4.83 5,28 5,41 5,048
04. Tegal Regency 5,29 4.83 4.81 5,25 5,81 5,198
05. Brebes Regency 4,99 4.94 4.97 5,21 5,06 5,034
05. Pekalongan City 3,73 4,78 5.51 5,60 5,89 5,102
06. Tegal City 5,15 5,02 4.61 5,67 4,93 5,076
Kendal Regency 5,55 5,97 5,99 5,54 5,24 5,658
Central Java Province 5,66 6,02 6,28 6,73 6,24 6,168
The high economic growth is an important indicator in assessing the success of development that has been carried out by the local governments. So the higher the economic growth rate of a region is, the more successful the region will be in the development. The GRDP and the economic growth rate achieved in the West Pantura areas of Central Java (the former residency of Pekalongan) seems still far from the expectations. This is proved by the low role of the GRDP and the level of economic growth in the West Pantura Areas (the former residency of Pekalongan) that is still low and below the average of economic growth rate of Central Java.
According to Saragih (2003), the development in a region is essentially an effort to increase the capacity of government, private sector, society, and relevant stake-holders in managing its economic resources in efficient and effective ways for the regional progress and the social welfare. Furthermore, the local economic development actually is a process that requires a synergy and coordination between the local government and its communities to manage the existing natural resources (Economic Journal, Vol. 2, 2013).
The Gross Regional Domestic Product (GRDP) (BPS, 2010) is to measure the performance of the economy of a region in a certain period. The quantity of GDP varies from one region to another. According to Shelby Hunt (2011), the economic activity is relatively more common in the growth centers. The high activity is reflected in the Gross Regional Domestic Product (GRDP) and the rate of GRDP.
When the economy is in growth, the demand and employment will increase. This means that if the economic growth rate is
high, the number of unemployment will decrease. On the contrary, if the economic growth is low, the number of unemployment will be increasing.
According to the Classical theory, the level of investments made will always be equal to the level of public savings. It is because the level of investment and savings are equally determined by the high-low interest rates.
The General Allocation Fund (DAU) is sourced from the national budget (APBN) that is allocated to bring equality of financial ability among the regions to fund the needs of the region in the implementation of decentralization (The Acts No. 33 of 2004). The central government provides the DAU to finance the shortfall of the local government in utilizing the PAD. DAU is "Block Grant", which means that the use is delegated to the regions in accordance with the priorities and the regional needs to improve services to the society in the implementation of regional autonomy.
The role of investment and government expenditure in the economic growth is equally increase the value of capital stock. The higher the level of investment value occurs, the higher the capital reserves / the capital can be used in the economy. (Rahman, Zia Ur. 2014)
When a developing country must decide whether to focus on the increasing economic growth or the development capabilities, Amarta Zen believes that the country should focus on the real goal that is the develop-ment of human potential.
The increasing Human Capital develop-ment is one of the important determinants in the process of development and economic growth. On the other hand, the human development requires resources, such as for funding, which comes from the economic growth. In other words, there is a two-way relationship between the human develop-ment and the economic performance. Therefore, to accelerate the high and quali-fied economic growth requires some major driving factors such as human capital investment that is sufficient and sustainable. (Yuliani, 2014).
According to Sbergami (2002), the human resources are influenced by the level of education, which accomplishments are through formal and non formal education, such as learning by doing, learning by using and accumulated work experience (Karlsson, 2009). Bautista (2000) used the model of Human Capital including the knowledge and technology. More investments made in the knowledge, more increasing the economy will be.
From the above background, the research has focused on the extent to which the factors of government expenditure and the capital accumulation obtained from the private sector, the quality of human resources, agglomeration and labor affect the GRDP and the economic growth in teh West Pantura Areas of Central Java. Although the factors of economic growth have been much researched, both internationally and natio-nally and even regionatio-nally, the results of the
previous research are used as a reference for the research. So based on the background and the description above, the writer is interested in conducting further research and put it in the form of a thesis entitled "Analysis of Economic Growth Factors in West Pantura Areas of Central Java Province".
RESEARCH METHODS
This research in collecting data uses the technique of literature study or the library research, in which the data collection technique is done by conducting a study of literature or studying any books that are relevant to the research materials.
The data used in this research is the secondary data obtained from the Central Bureau of Statistics (BPS) of various years, the Regional Development Planning Board (Bappeda), the Department of Financial Management and Local Assets (DPKAD), and the Regional Work Unit (SKPD) in the provincial and regional level.
The span of time is the year of 2004-2013. Because the data of IPM is calculated regularly or published every year, it is just started in 2004, along with the data requirements for the national indicator of DAU. The research variables used are the Gross Regional Domestic Product (GRDP) as the dependent variable while the indepen-dent variables are the Government Expen-diture, the Quality of Human Resources, Agglomeration, Labor, and Investment.
The Government Expenditure in this case is the realization of development diture or the realization of capital expen-diture of local government development of various sources of income in one year of the Regional Budget (APBD) for the develop-ment expenditure or the public expenditure, in other words, in this research the compo-nent of government expenditure in the form of official salaries is not included in the government expenditure variables in units of billion rupiahs.
Variables of investment in this research is the realization of the investments made by the domestic investors (PMDN) and the foreign investors (PMA) in the West Pantura areas of Central Java in a certain year in rupiah unit, which is approximated by the number of input values of large industries with a unit of million rupiahs.
To measure the level of Quality of Human Resources uses the proxy of Human Development Index (IPM). To collect the data of IPM simultaneously throughout Indonesia around 400 Regencies / Cities, both the collecting and processing, takes time, because the numbers generated are in national area. So there is a time lag in the presentation, which is one year after the implementation of the survey.
Human Development Index (IPM) is a human development indicator introduced by the United Nations Development Program-me (UNDP) in 1990. Basically IPM includes three components that are considered essential for humans and operationally easily calculated to produce a measure that reflects the human development efforts. These three aspects are related to the longevity, know-ledge, and decent living. The longevity is calculated based on the number of life expectancy at birth, the knowledge is
measured based on the average length of the school and the literacy rate of the population aged 15 years old and upward, and the decent living is measured by the expenditure per capita based on the Purchasing Power Parity in rupiah. IPM is measured by the range of values between 0-100.
The labor variable is the number of people aged 15 years old and upward who work to obtain or help to earn income/profit for at least one hour in a row, working during the past week, which measured in units of soul per year.
The agglomeration is the concentration of economic activity in the region. In this research the agglomeration is in proxy by the number of large and medium industries that exist in the region and is calculated in units in a certain year.
The data used in this research is a panel or pooled data, which is a combination of time series and cross section data. Time series data in this research is the observation time of the research from 2004 - 2013. The dummy variable in this research is to indicate the variation among the regions. As a guide to draw up a dummy variable is the number of categories minus one, (Kuncoro, 2001: 45), because there are seven districts and cities, five regencies and two cities, so the number of dummy variables in this model is 7-1 = 6; the model in this research is:
Q = f (PP, INV, IPM, AGM, TK) (1)
Because Q is PDRB(GRDP), so:
PDRB = f (PP, INV, IPM ,GM, TK) (2)
The econometrix for equation (2) is as follows:
PDRBit = α0i + α1PPit+ α2INVit+ α3IPMit +
To use the linear empirical models of the equation, it is derived by using the log in order to obtain the following equation:
Ln PDRBit = α0it+ α1 Ln PPit +
α2 Ln INVit+ α3 IPMit+ α4 Ln AGMit +
A5 Ln TKit (4)
which i = 1,2,3,…,6 is a region of regencies/ cities in West Pantura, Central Java.
n unit cross section t = 1,2,3,…,6 is the variables researched (PP, INV, IPM ,AGM and TK) regions in regencies/cities in West Pantura, Central Java.
t = series. 1,2,3,…,10 is the series of year, from 2004 to 2013.
The condition is because the purpose of the analysis of the regional economic growth factors is to determine the influence of the factors that affect the increase in the Gross Regional Domestic Product (GRDP) of the above equation.
LnPDRBit = α0it + α1LnPPit+ α2LnINVit +
α3LnIPMit + α4LnAGMit + α5LNTKkit +
α6D1it + α7D2it + α8D3it + α09D4it +
α10D5it + α11D6it +µit (5) in which:
PDRB : Gross Regional Domestic Product PP : Government Expenditure
INV : Investment
IPM : Quality of Human Resources AGM : Agglomeration
TK : Labor
D1 : 1 for Batang Regency 0 for other regions D2 : 1 for Pekalongan Regency
0 for other regions D3 : 1 for Pemalang Regency
0 for other regions D4 : 1 for Tegal Regency
0 for other regions D5 : 1 for Brebes Regency
0 for other regions
D6 : 1 for Pekalongan City 0 for other regions
µ : Disturbance error
This research aims to analyze the growth of the GRDP in the West Pantura Areas of Central Java with factors that theoretically could affect the growth. These factors are: Government Expenditure (PP), Investments (Inv), Quality of Human Resources (IPM), Agglomeration (AGM) and Labor (TK)
The Regression Equations using the dummy variables become;
LnPDRBit = α 0it+α1LnDAUit +α2LnPPit+α3 Ln
INVit +α4 IPMit + α5LnAGMit +
α6LNTKkit + α7D1it + α8D2it + α9D3it +
α10D4it + α11D5it + α12D6it + µit (5).
The above model wants to know how large the factors of economic growth such as the General Allocation Fund, the Government Expenditure, the Investment, the Quality of Human Resources, the Agglomeration, and the Labor affect the GRDP growth in the West Pantura Areas of Central Java. The analysis tool used is the panel data regression model that is conducted with the help of Eviews 6 programme.
RESULTS AND DISCUSSION
1. Regression of data panel with
Common Effect model
The Common Effect regression model is a simple model, so it can be used as an estimator. The results still need to be tested with other estimation models.
Table 3. Estimation Result of Common Effect Model.
Variable Coefisien Std.
Error t-Statistic Prob.
(1) (2) (3) (4) (5)
LN PP 0.641957 0.121165 5.298208 0.0000
LN INV -0.099743 0.047393 -2.104604 0.0392
IPM 0.065210 0.014222 4.585168 0.0000
LN AGM -0.067321 0.039828 -1.690289 0.0958
LN TK 0.358165 0.086560 4.137746 0.0001
Source: Eviews Processing Data
The Regression Equation Model is as follows: PDRB = 0.641957 LnPP - 0.099743Ln INV +
0.065210 IPM - 0.067321 LnAGM + 0.358165 LnTK + α7D1it + α8D2it + α9D3it +
α10D4it + α11D5it + α12D6it + µt ( 6)
The model above gives information that the variables of PP, IPM, TK have the positive coefficient, while the variables of INV and AGM have the negative variables. This model does not use a dummy variable to resolve the differences among the independent varia-bles.
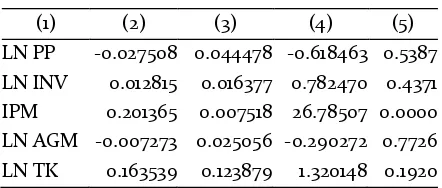
2.Data panel regression with Fixed Effect
Model
Table 4. Estimation Result of Fixed Effect
Model
Variable Coefisien Std. Error t-Statistic Prob.
(1) (2) (3) (4) (5)
LN PP -0.027508 0.044478 -0.618463 0.5387
LN INV 0.012815 0.016377 0.782470 0.4371
IPM 0.201365 0.007518 26.78507 0.0000
LN AGM -0.007273 0.025056 -0.290272 0.7726
LN TK 0.163539 0.123879 1.320148 0.1920
Source: Eviews Processing Data
The above model gives information that the variables of INV, IPM, and TK have the positive coefficient, while the variables of PP and AGM have the negative variables.
The equation of Fixed Effect Model becomes:
PDRB = -0.579494 -0.027508 Ln PP+ 0.012815 Ln INV+ 0.201365 IPM - 0.007273 Ln AGM + 0.163539 Ln TK + α7D1it + α8D2it +
α9D3it + α10D4it + α11D5it + α12D6it + µt (6)
Equation 6 is an equation model using the dummy variables as an estimator of the equation. When the dummy variables of each regency/city are equation above will be:
PDRB = -0.579494 -0.027508 Ln PP+ 0.012815 Ln INV+ 0.201365 IPM - 0.007273 Ln AGM + 0.163539 Ln TK + -0,058226D1it +
0,025435D2it + 0,459970D3it + 0,203972D4it +
1,264933D5it - 1,005198D6it + µ (7)
3. Data panel regression with Random
Effects Model
Table 5. Estimation Result of Random Effect
Model
Variable Coefisien Std. Error t-Statistic Prob.
(1) (2) (3) (4) (5)
LN PP -0.019971 0.044226 -0.451558 0.6531
LN INV 0.021327 0.016206 1.316005 0.1929
IPM 0.195675 0.007425 26.35479 0.0000
LN AGM -0.015658 0.024749 -0.632674 0.5292
LN TK 0.488815 0.101596 4.811375 0.0000
Source: Eviews Processing Data
The general equation of Random Effect Model will be:
PDRB = -4.553018 - 0.0199718 LnPP + 0.021327 LnINV + 0.195675 IPM - 0.015658 LnAGM + 0.488815 LnTK+ α7D1it + α8D2it + α9D3it +
α10D4it + α11D5it + α12D6it + µt (8)
PDRB of Tegal City = -4.553018 - 0.0199718 LnPP + 0.021327 LnINV + 0.195675 IPM - 0.015658 LnAGM + 0.488815 LnTK+ - 0,067359D1it - 0,026812D2it + 0,283099D3it -
0,000299D4it + 0,960014D5it– 0,655815D6it +
µt . (9)
4. Selecting Data Panel Regression
Model
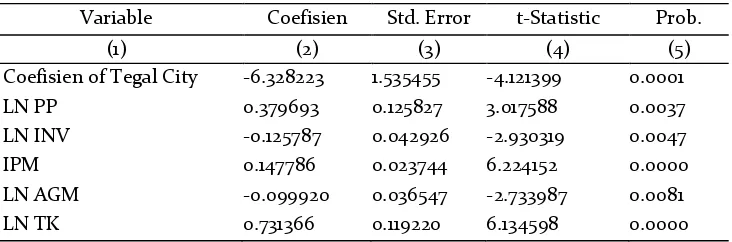
a. The significance testing between the Common Effect and Fixed Effects models. This testing is conducted by the Chow test by determining previously the hypothesis to be tested, as follows:
H0 : Common effect model is better than fixed effect model
H1 : Fixed effect model is better than common effect model
The equation of this model will be:
PDRB = 6.328223 + 0.379693 lnPP 0.125787 lnINV + 0.147786 IPM -0.099920 lnAGM + 0.731366 lnTK +
α7D1it + α8D2it + α9D3it + α10D4it +
α11D5it + α12D6it + µt (10)
The testing of Chow test indicates that the significance value of the F test of 0.0000 is far below 0.05. The decision is to reject Ho. The conclusion of this Chow
test is that the fixed effect model is better than the common effect model (Table 6).
Because the fixed effect model is better than the common effect model, it is necessary to test whether the random effect model is better than the fixed effect model (Hausman Test).
b. The significance testing between the Fixed Effect model and the Random Effect model.
From the Hausman test, the significance value of Chi square is 0, 0000 less than 0.05. Then the conclusion is the fixed effect models are better than the random effect model.
5. Classical Assumption Criteria Test
The autocorrelation test is also conducted by using the D-W, which is by comparing the value of Durbin Watson (D-W) of the calculation result with table of Durbin Watson. The value of Durbin Watson table on this model (k = 6 and n = 70) is 1.230
dl and du 1.786, so that the criteria used is: if
du (1.786) < d <4-du (4-1.786), there will be no autocorrelation. From the result of the regression it is known that the value of Durbin Watson is 1.954201, so that in this model it can be concluded that there is no symptoms of autocorrelation (Table 7).
Table 6.Estimation Result of Crossection Model (CE VS FE)
Variable Coefisien Std. Error t-Statistic Prob.
(1) (2) (3) (4) (5)
Coefisien of Tegal City -6.328223 1.535455 -4.121399 0.0001
LN PP 0.379693 0.125827 3.017588 0.0037
LN INV -0.125787 0.042926 -2.930319 0.0047
IPM 0.147786 0.023744 6.224152 0.0000
LN AGM -0.099920 0.036547 -2.733987 0.0081
LN TK 0.731366 0.119220 6.134598 0.0000
Table 7. Comparison of Value of Durbin Watson Model
No. Types of Regression Durbin- Watson
1. Common Effect Model 0.406112
2. Fixed Efect Model 1.613706
3. Random Effect Model of Weighted Statistics 1.239414
4. Random Effect Model of Unweighted Statistics 0.012755
5. Chow Test (Common Effects VS Fixed Efect) 0.348783
6. Uji Hausman (Random Effects VS Fixed Efect) 1.613706
7. Cross - section SUR , Weighted Statistics 1. 909938
8. Cross - section SUR , Unweighted Statistics 1.549086
Source: Eviews Data Processing
The multicolinierity test is conducted by the auxilary regression among the independent variables. If the value of R2 of auxilary regression among the independent variables is smaller than R2 in the regression of primary model (Common Effect Model, Fixed Effect Model, Random Effect Model, and also other models (Chow Test, Hausman Test, and Cross-section SUR), there will be no multicolinierity on the model.
In Table 8 below it is known that the overall value of R2 on the auxilary regression among the independent variables is not greater than the value of R2 of 0.998220 on the regresion of primary model (Fixed Effect Model). It can be concluded that there is no multicolinierity on the model.
From the results of the regression that has been conducted with the Common Effect Model, the Fixed Effect Model, the Random
Effect Model, the Chow Test, the Hausman Test, and the Cross- section SUR, it is known that several independent variables give the positive influence on the dependent variables, but there are also the independent variables that give no positive influence on the dependent variables even they have negative value. The independent variables influence the GRDP. The estimacy result of the regression is certainly consistent with the theory that underlies this research about the economic growth.
6. Regression Equation of Panel Data
The Model of Regression Equation of Panel Data is formed as follows.
GROWTH = - 0.415469 + 0.005022*lnPPit + 0.010887*lnINVit + 0.195439*IPMit - 0.012075*lnIAGMt + 0.153604*lnTKit (11)
Table 8.Comparison of Value of R2
No Types of Regression Value of R2
1. Common Effect Model 0.866411
2. Fixed Effect Model 0.993736
3. Random Effect Model 0.977016
4. Chow Test (Common Effects VS Fixed Efect) 0.894430
5. Hausman Test (Random Effects VS Fixed Efect) 0.993736
6. Cross- section SUR , Weighted Statistics 0.998095
7. Cross - section SUR , Unweighted Statistics 0.993654
From the estimation on the model above, it can be obtained that the function of the economic growth through the GRDP for each regency and city in the West Pantura Areas of Central Java is as follows:
PDRB = - 0.415469 + 0.005022*lnPPit + 0.010887*lnINVit + 0.195439*IPMit - 0.012075*lnIAGMt + 0.153604*lnTKit - - 0.063391D1 + 0.035020D2 + 0.446893D3 + 0.196691D4 + 1.233343 D5 - 0.975733 D6 (12)
In the above equation it is known that the slope coefficient value for each regency and city in the West Pantura Areas of Central Java is similar, while the intercept coefficient value is different. It cannot be separated from the approach used in the analysis tool of data panel that is by the approach of Fixed Effect Model (FEM) or Least Square Dummy Variable (lSDV) by assuming that the dummy variables are used to capture the information of the difference between spaces, so that the slope coefficient value among the regencies and cities in the West Pantura Areas of Central Java will be constant, but the intercept value will vary among the regencies and cities in the West Pantura Areas of Central Java West or between spaces.
Equation 12 is an equation model that uses the dummy variables as an estimator of equation. If the dummy variables of each regency/city are included in the regression model, the equation above will be;
PDRB = - 0.579494 - 0.027508 LnPP + 0.012815 LnINV + 0.201365IPM - 0.007273 LnAGM + 0.163539 LnTK + - 0,058226D1it +
0,025435D2it + 0,459970D3it + 0,203972D4it +
1,264933D5it - 1,005198D6it + µt (13)
Based on equation 12, the independent variable influence of the government expen-diture on the model will obtain a value of
0.005022. Of the obtained value it is known that the independent variables of the government expenditure give a very little influence on the GRDP and the economic growth in the West Pantura Areas of Central Java. Or it will just give an influence of 0.005 percent of GRDP of the West Pantura Areas of Central Java from every increase of 1 percent of the development expenditure or the capital expenditure of local government development.
The variable of labor after the regression on the model obtains a value of 0.153604. Of the value that has been obtained it is known that the independent variable of labor bring the positive influence on the GDDP in the West Pantura Areas of Central Java amounted to 0.153 percent of each increase of 1 percent of the labor in the West Pantura Areas of Central Java. The variable of investment on the model obtains a value of 0.010887. Of the value that has been obtained it is known that the variable of investment give the positive influence on the GRDP in the West Pantura Areas of Central Java of 0.010887 percent of each increase of 1 percent of investment in the West Pantura Areas of Central Java. As the important variable in the theory of the economic growth, it seems that the influence is still relatively small in the West Pantura Areas of Central Java.
The numbers obtained through the regression indicate that the West Pantura Areas of Central Java have not become the prima donna for the investors who will invest in Central Java Province.
the AGM variable after the regression is -0.012075; this value is smaller than the t table of 60.55425, so the AGM variable is not significant at the 5 percent of confidence level. But although there is no partial influence, the AGM variable still gives an influence on the dependent variables simul-taneously so it cannot be ignored in analyzing the economic growth in the West Pantura Areas of Central Java.
Of the value that has been obtained it is known that the AGM variable still gives relatively a small influence on the increase in the GRDP in the West Pantura Areas of Central Java. The small influence of the AGM variable proves that the industrial sector as a whole is still a sector with a small role in the formation of the value of GRDP of the West Pantura Areas of Central Java. It cannot be separated from the pattern of the economy of the West Pantura Areas of Central Java that is still agrarian, except Pekalongan City and Tegal City that have become the centers for the West Pantura Areas of Central Java, and besides that, Pekalongan City and Tegal City practically have no agricultural areas because of their small administrative areas so it is not surprising if the agricultural sector in the two cities has no gross additional value role of the total GRDP obtained.
CONCLUSION
The GRDP and the rate of economic growth cannot be separated from the factors that theoretically can influence it. The effort to determine the factors that significantly affect the GRDP and the growth rate is important to do because it will determine the direction of policy that will be taken. The more precision to know the determinants of the growth is, the greater the opportunity to achieve the high economic growth rate will be.
Based on the result of processing, it is known that the four coefficients of the significant variables have the significant positive value on any increase or decrease in the amount of GRDP in the West Pantura Areas of Central Java, although there is a coefficient that gives a little value that is DAU. Of these four factors, the investment factor brings an influence on the GRDP with a coefficient of 0.013066. This value indicates that any increase (decrease) of the quantity of total investment of one unit (million) can increase (decrease) the economic growth rate of 0.013066 assuming there is no change in other factors (ceteris paribus). This value indicates that the condition of the investment level in the West Pantura Areas of Central Java is still low.
The factor of the quality of human resources gives an influence on the GRDP in the West Pantura Areas of Central Java with coefficient of 0.199316 assuming there is no change in other factors (ceteris paribus). This value indicates that any increase of 1 point of IPM number will increase the value of GRDP to 0.199316. Thus IPM affects the GRDP level achieved in the West Pantura Areas of Central Java.
The labor factor can influence the GRDP in the West Pantura Areas of Central Java with coefficient value of 0.165086 assuming there is no change in other factors (ceteris paribus). This value indicates that any increase of 1 point will increase the economic growth rate of 0.165086. Thus is the capacity of the human resource quality factor in influencing the formation of GRDP.
achieved in the West Pantura Areas of Central Java.
The calculation result of the factor of General Allocation Fund (DAU) gives the value of 0.009572. The small value indicates that the DAU variable in the West Pantura Areas of Central Java has not given a strong influence yet on the GRDP as well as a the factors of economic growth in the West Pantura Areas of Central Java.
The agglomeration in this case denoted by the AGM (agglomeration) has a coeffi-cient value of -0.013514. The agglomeration factor gives no influence on the GRDP in the West Pantura Areas of Central Java. This proves that in general the economic activity in the West Pantura Areas of Central Java is still agrarian.
The capability of the quality of human resources in influencing the GRDP in the West Pantura Areas of Central Java proves the importance of improving the human development index in achieving the high economic growth rate. The lack of attention of the local government of the West Pantura Areas of Central Java in the quality of human resources is proved by the low value of the IPM obtained. The policies of the local government of the West Pantura Areas of Central Java should pay more attention to this sector by making the braver policies such as increasing the budget allocations for education or health, eradicating the illiteracy or pursuing the policies that have an impact on increasing the purchasing power of the society in the West Pantura Areas of Central Java.
Making the policies that can increase the employment participation rate or lower the unemployment rate and increase the levels of productivity is for example by creating a program of economic activities that are labor
intensive. Besides, it also requires any action that can affect the level of labor productivity so that the production capacity can be increased. Such actions may be taken by any policy such as the training of ability/skill, the efficiency of production management, and many others.
The low level of investment proves that the general condition of the West Pantura Areas of Central Java is less attractive to the investors. The policies that can improve the value of investment must be made so that the investment factor will increase its role in the regional economic growth. The policies include the deregulation of the local regula-tions concerning the investments, giving good advice and providing good infrastruc-tures so that the West Pantura Areas of Central Java will be interesting for the investment. Improving the capability of the local government expenditure factor in the West Pantura Areas of Central Java will influence the rate of regional economy growth.
Improving the capability of the local government expenditure factor in influenc-ing the level of economic growth is by increasing the ratio of development capital expenditure allocation to the total of regional expenditure.
agriculture sector to the industrial one. Among the policies that can be taken is by building and maintaining the industrial centers, training and craft education, or by making policies that facilitate the society in obtaining the capital or loans for running the economic activities in the industrial sector.
Improving the employability of the graduates of Vocational High School (SMK) in their respective areas should be conducted to overcome the competition of human resources in the world of work, which demands the reliable and proficient human resources in the workplace.
REFERENCES
Badan Pusat Statistik, 2014. Statistika Indonesia 2009-2013.Provinsi Jawa Tengah.
Badan Pusat Statistik (BPS), 2015 Jawa Tengah Dalam Angka 2009-2014. Provinsi Jawa Tengah.
Badan Pusat Statistik. 2014. Produk Domestik Regional Burto Kabupaten/Kota di Jawa Tengah 2004-2014. Badan Pusat Statistik.2014. Jawa Tengah dalam Angka
2014. BPS Propinsi Jawa Tengah.
Badan Pusat Statistik. 2014. Statistik Keuangan Peme-rintah Propinsi Jawa Tengah dan Kabupaten/Kota di Jawa Tengah Tahun 2014.BPS Provinsi Jawa Tengah.
Bautista, Alejandro Diaz. 2000. Convergence and Economic Growth in Mexico, Frontera Norte, Volume. 13, No. 24 July-December 2000. San Diego: California University.
Hunt, Shelby D. 2011. Sustainable Marketing, Equity, and Economic Growth: A Resource-Advantage, Economy Freedom Approach. Journal of The Academy of Marketing Science 39: 7 – 20.
Karlsson. 2009. Foreign Firms and Chinese Employ-ment. Wiley Online Journal ICSEAD Vol 32 Issue 1
John Wiley & Sons.
Kumar Gaur, Achal. 2010. Regional Disparities in Economy Growth: A Case Study of Indian States. Paper Prepared for the 31st General Conference of the International Association for Research in Income and Wealth.
Kuncoro, Mudrajad. 2001. Metode Kuantitatif: Teori dan Aplikasi Untuk Bisnis Dan Ekonomi. Yogya-karta: UPP AMP YKPN.
Kuncoro, Mudrajad. 2004. Pertumbuhan Ekonomi dan Ketimpangan Antar Kecamatan di Kabupaten Banyumas 1993-2000. Jurnal Ekonomi Pemba-ngunan Vol. 8 No. 2, Desember 2003 Hal: 97 – 110. Melnyk, Leonid. 2014. The Impact of Foreign Direct
Investment on Economic Growth: Case of Post Communism Transition Economies. Problems and Perspectives in Management. Volume 12, Issue 1. Marshall-Arrow-Romer /MAR, 1987. Ekternalitas
Dinamis Theory .New York: John Wiley & Sonc, INC.
Rahman, Zia Ur. 2014. Impact of Foreign Direct Invest-ment on Economic Growth in Pakistan. Journal of Economics and Sustainable Development Vol.5, No.27, 2014.
Ramirez, A., Gustav Raniz & Frances Steward. 1998.
Economic Growth and Human Development, Working Paper Series. Yale: University of Yale. Saragih. 2003. Pengaruh Jumlah Penduduk, PDRB, dan
Jumlah Industri terhadap Pendapatan Asli Daerah Propinsi DIY. Yogyakarta: UNY.
Sbergami. 2002. Agglomeration and Economic. Growth: Some Puzzles. HEI Working Paper No: 02/2002.
Graduate Institute of International.
Sugiarto, 2000. Jurnal Dinamika Struktur Ketenagaker-jaan di Pedesaan Jawa Barat. Pusat Penelitian Sosial Ekonomi Pertanian dan Badan Penelitian dan Pengembangan Pertanian Bogor.http://www. plugin-(3).20socasugiarto-dinamika%20struktur% 20ketenagakerjaan(1)/
Sutarno & Mudrajad Kuncoro. 2003. Pertumbuhan Ekonomi dan Ketimpangan Antar Kecamatan di Kabupaten Banyumas 1993-2000. Jurnal Ekonomi Pembangunan Vol. 8 No. 2, Desember 2003 Hal: 97 – 110.
Yuliani, T., & Saragih, N. (2014). Determinan Pem-bangunan Manusia di Kabupaten/Kota Provinsi Jawa Tengah. JEJAK: Jurnal Ekonomi Dan Kebijakan, 7(1).