Automated Story Selection for Color
Commentary in Sports
Greg Lee, Vadim Bulitko, and Elliot A. Ludvig
Abstract—Automated sports commentary is a form of auto-mated narrative. Sports commentary exists to keep the viewer informed and entertained. One way to entertain the viewer is by telling brief stories relevant to the game in progress. We present a system called the sports commentary recommendation system (SCoReS) that can automatically suggest stories for commentators to tell during games. Through several user studies, we compared commentary using SCoReS to three other types of commentary and show that SCoReS adds significantly to the broadcast across several enjoyment metrics. We also collected interview data from professional sports commentators who positively evaluated a demonstration of the system. We conclude that SCoReS can be a useful broadcast tool, effective at selecting stories that add to the enjoyment and watchability of sports. SCoReS is a step toward automating sports commentary and, thus, automating narrative.
Index Terms—Artificial intelligence, automated narrative, infor-mation retrieval.
I. INTRODUCTION
S
PORTS broadcasting is a billion dollar industry. Most pro-fessional sports are broadcast to the public on television, reaching millions of homes. The television experience differs in many ways from the live viewing experience, most signifi -cantly through its commentary.Much research has been done into the importance of com-mentary during sports broadcasting. When watching a game on television, “ the words of the commentator are often given most attention” [10]. The commentary has the effect of drawing the attention of the viewer to the parts of the picture that merit closer attention [16], an effect calleditalicizing[3]. Commen-tary can also set a mood during a broadcast. A commentator who creates a hostile atmosphere during a broadcast often makes the viewing experience more enjoyable for the viewer [6]. The de-scriptions given in a broadcast are so useful that fans often bring
Manuscript received September 21, 2012; revised March 30, 2013; accepted June 10, 2013. Date of publication July 30, 2013; date of current version June 12, 2014. This work was supported by the Natural Sciences and Engineering Re-search Council of Canada (NSERC) and by the International Council for Open Research and Open Education (iCORE).
G. Lee was with the Department of Computing Science, University of Alberta, Edmonton, AB T6G 2E8 Canada. He is now with the NICHE Re-search Group, Dalhousie University, Halifax, NS B3H 3J5 Canada (e-mail: [email protected]).
V. Bulitko is with the Department of Computing Science, University of Al-berta, Edmonton, AB T6G 2E8 Canada (e-mail: [email protected]).
E. A. Ludvig is with the Princeton Neuroscience Institute, Princeton Univer-sity, Princeton, NJ 08540 USA (e-mail: [email protected]).
Color versions of one or more of thefigures in this paper are available online at http://ieeexplore.ieee.org.
Digital Object Identifier 10.1109/TCIAIG.2013.2275199
radios to live games in order to listen to the interpretations of the commentators [24]. Also, some sporting venues now support a handheld video device that provides the spectator with in-game commentary [30].
The purpose of commentators is to help the viewer follow the game and to add to its entertainment value. One way to add entertainment to a broadcast is to tell interesting, relevant sto-ries from the sport’s past. The sport of baseball is particularly suited to storytelling. Baseball is one of the oldest professional sports in North America, existing since 1876. This longevity provides a rich history from which to draw interesting stories. The more popular commentators are known as “storytellers” [33], as they augment the games they call by adding stories that connect baseball’s past to its present. One of these “storytellers,” Vin Scully, has been commentating for Brooklyn/Los Angeles Dodgers games since 1950 and has been voted the “most mem-orable personality in the history of the franchise.”
A typical baseball game lasts about three hours, but contains only ten minutes of action, where the ball is live and something is happening on the playingfield. This leaves two hours andfifty minutes of time where little is happening on the playingfield, and it is the job of the commentators to entertain the viewer. This downtime is a good time to tell stories [31]. Baseball is also known for being a statistically rich league, and being able to match statistics from the current game state to a past situation in baseball adds to the commentators’ ability to entertain the viewer.
To illustrate, consider the case where one baseball team is trailing by four runs in the ninth inning. As this is not a partic-ularly interesting situation, it may be a good time for a story. An appropriate story might be that of the Los Angeles Dodgers, who on September 18, 2006, were also trailing by four runs in the bottom of the ninth inning. The Dodgers hit four consecu-tive home runs to tie the game. The broadcast team could tell this story to the viewer, because the situations are similar. Thus, what is needed is amappingfrom a game state (a particular point in a game) to an appropriate story.
Sports storytelling is a form of narrative discourse. Narra-tive discourse is a creaNarra-tive activity that involves relaying a se-ries of events in an interesting and entertaining manner. It is a recounting of contingent events from the past with one or more main characters. Automating narrative discourse is a chal-lenging problem for AI and a subject of much recent research [36]. Our work focuses on one aspect of computational nar-rative—that of selecting the narrative components to include based on the current context. We feel the solution supplied here provides an important tool to the larger problem of computa-tional narrative.
Our hypothesis is that sports story selection can be automated with AI. Specifically, we set out to test whether an AI approach can be developed that maps game states to relevant stories, thereby significantly increasing audiences’ enjoyment of the broadcast. To achieve this goal, we develop an AI system that tells stories in the context of baseball. The sports commentary recommendation system (SCoReS), equipped with some scored examples of story-game state pairs, learns offline to connect sports stories to game states. This learned mapping is then used during baseball games to suggest relevant stories to a (human) broadcast team or, in the absence of a broadcast team (e.g., in a sports video game), to autonomously output a relevant story to the audience. In the case of suggesting stories to commentators, SCoReS is an example of human–computer interaction [9], as it is a computer system that communicates to humans information that will improve their performance.
This research makes the following contributions to com-putational narrative. First, we formalize story-based sports commentary as a mathematical problem. Second, we use ma-chine-learning methods and information retrieval techniques to solve the problem. This solution is for the specific domain of sports story selection, but is also general enough to be used in other domains involving story selection. Third, we implement the approach in the domain of baseball, evaluate the resulting AI system by observing feedback from human participants, and show that it is effective in performing two separate tasks: 1) au-tomating sports commentary, and thus auau-tomating narrative in a special case; and 2) assisting human commentators. That is, we show that our combination of information retrieval techniques is able to map previously unseen baseball game states to stories in a sufficiently effective manner to improve the enjoyability of baseball broadcasts, increase interest in watching baseball, and suggest stories to professional commentators that they would tell during a live game.
This paper is an extension of [21]. Beyond the above addi-tions of describing the connection to narrative discourse and SCoReS contributions to AI, it provides full detail on each com-ponent of the SCoReS algorithm and features used in experi-ments. It also provides a detailed example displaying the oper-ation of SCoReS, a full related research section, and a complete list of parameters and results for the experiments. Finally, the future research and applications sections have been expanded, including the addition of possible solutions to challenges faced thus far in the development of SCoReS.
The rest of the paper is organized as follows. First, we describe color commentary in detail, and formulate the problem of mapping sports game states to interesting stories. This is followed by a review of research related to story-based com-mentary. Next, we describe information retrieval techniques in detail and describe our approach to mapping game states to sto-ries. This approach combines information retrieval techniques designed to rank stories based on a given game state, and others that ensure the higher ranked stories are indeed relevant to said game state. We then describe empirical work performed to choose a story ranker and use this ranker to select stories for baseball broadcasts. The quality of the story mapping is evaluated with user studies and demonstrations to professional sports commentators. We conclude with a discussion of lessons
learned, future research and applications, and a summary of the contributions of this paper.
II. PROBLEMFORMULATION
Commentating in sports generally involves two people—a play-by-play commentator and a color commentator. Play-by-play commentating involves relaying to the audience what is actually happening on thefield of play. Beyond reporting the actions of the players as they happen, the play-by-play commen-tator typically mentions such facts as the score of the game, up-coming batters and statistics for the teams and players involved in the game. Color commentary, on the other hand, is much more subjective and broad, with the purpose being to add entertain-ment (i.e., “color”) to the broadcast. This can be done in several ways, as we describe below.
After a play is over, color commentators tend to analyze what has happened beyond the surface. For instance, if a player swings awkwardly at a pitch and misses, the color commen-tator may point out that the reason for the hitch in his swing is that he has an ankle injury and is unable to plant his foot when swinging. This gives the viewer some extra information beyond what he or she can see, or is told by the play-by-play commentator.
Yet another manner in which the color commentator adds to a broadcast is by giving background information on the players involved in the game. Whereas play-by-play commentators can provide a player’s statistics, color commentators tend to add more personal information about a player, possibly including their own interactions with that player. Passing on their exper-tise in the sport at hand is one more way color commentators add to the broadcast.
Another rich aspect of color commentary is storytelling, which is our focus. Effective storytelling in sports broadcasts involves telling a story that is interesting to the audience, and that is related to what is actually happening in the game being broadcast. While play-by-play commentators are generally trained journalists, color commentators are typically former professional athletes or coaches. As former members of the league being shown, they are thought to bring a level of exper-tise to the broadcast. Because they actually played or coached in the league, color commentators tend to tell stories from their own experiences in the game. This gives the audience a
firsthand account of snippets of baseball history, which can be quite entertaining. Unfortunately, color commentators do not have firsthand knowledge of most of baseball history. Their knowledge of stories, however vast for human beings, is still limited relative to the total set of baseball stories available and they cannot necessarily connect the stories they do know to the game state at hand. This is where AI can be of assistance. Com-puters can both store many more stories than a human brain as well as quickly compute the quality of a match between each story in the library and the game state at hand. The problem we are addressing in this paper is thefinding and matching of interesting stories as live commentary to a sports game.
III. RELATEDWORK
sto-ries to nonsports video games (Section III-A), and others deliver live play-by-play commentary, with some added color (Section III-B). None of the existing work delivers story-based color commentary to a live game.
A. Storytelling in an Unpredictable Environment
Narrative generation explicitly attempts to automate story-telling by having computers create a story with an entertaining plot and characters. The ability to generate effective narrative is important in different applications, such as entertainment, training, and education [28], and this area has been studied for over 20 years [14]. There has been much work on automated storytelling in nonsports video games [29]. Some systems gen-erate or adapt a story due to actions taken by the player, creating a so-called interactive drama. Automated story director (ASD) [27] is an experienced manager that accepts two inputs: an exemplar narrative that encodes all the desired experiences for the player and domain theory that encodes the rules of the environment. As the player can influence the narrative, ASD adapts the examplar narrative to ensure coherence of the story and a feeling of agency for the player. These adaptations are preplanned based on the domain theory. Systems such as ASD actively change the course of the game based on user actions. As a commentary system cannot alter what happens in a live sports game (real or video game), these systems are not directly applicable to our problem.
Human commentators try to weave a narrative with a coherent plot through unpredictable sports games [31]. Plot is a difficult narrative dimension for the broadcast team, as they do not know what the end result of the game will be until it concludes. They can, however, attempt to predict what will happen and begin to build up a plot thatfits with the predicted ending. This brings into play different themes that the broadcaster can choose to follow, and he or she can follow more than one at a time (hedging his or her bets, so to speak). In the broad scheme of narratives, the range of themes spans all of human experience. In baseball, these themes are limited, and they include: spirit, human interest, pity, games-manship, overcoming bad luck, old-college-try, and glory [31], [7]. Matching game states and stories thematically (or categori-cally) can be used to help gauge similarity between the two, and we investigate this in our approach.
B. Automated Commentating in Sports
StatSheet [2] and Narrative Science [11] automatically write previews for sports games that have not yet happened, and maries about sports games that have already happened. For sum-maries, they are provided with statistics from a completed game and compose a narrative about the game, with the goal being to provide an interesting summary of game events. For previews, they are provided with statistics from past games, and compose a preview for the game that should entice the reader to watch said game. Neither Statsheet nor Narrative Science operates with live game data and both are unable to solve our problem of providing live stories during a game. They may, however, provide an addi-tional potential database of stories about past games to augment our current system.
Modern commercial sports video games typically employ professional broadcast teams from television to provide com-mentary for the action in the game. This involves prerecording
large amounts of voice data that will be reusable for many different games. As an example, a clip to the effect of “Now that was a big out!” could be recorded and used in multiple situations where one team was in dire need of retiring a batter or a runner. Recorded clips often use pronouns (i.e., “he” and “they”) so that they are not specific to any particular player or team. This makes the commentary generic, which reduces the amount of recording required, as recording voice data can be time consuming and expensive. Unfortunately, generic commentary is less exciting to the audience. We would like our AI system to deliver colorful commentary tailored to the current game by mapping the current game state to a story chosen specifically for said game state.
TheMLB: The Show[32] suite of games is popular among baseball video games [15]. Recorded clips of Matt Vasgersian of the Major League Baseball (MLB) network act as the play-by-play commentary while Dave Campbell of ESPN’s Baseball Tonightis the color commentator. Most of the color commentary involves analysis of what has happened on thefield and indirect suggestions to the player as to how to improve their play. As far as we have seen, there is no storytelling in these games. The problem we are trying to solve, automated story selection for sports, could provide an additional angle to the color commen-tary in these games.
InMLB 2K7[1], another prominent baseball video game, Jon Miller and Joe Morgan (formerly ofESPN: Sunday Night Base-ball) provide the play-by-play and color commentary, respec-tively. There is at least one instance of relating a game state to a story from baseball’s past, occurring when a third strike is dropped by the catcher and he has to throw tofirst base to record the out. Here, Miller reminds us of a 1941 World Se-ries game where Mickey Owens committed an error on a sim-ilar play, changing the course of the series. There appear to be a very limited number of stories told in the game, however, and a single story is used repeatedly. The mapping of the game state to the story appears to be hand-coded and based on just one fea-ture (a dropped third strike).
Robot World Cup Soccer (RoboCup) is a research testbed involving robots playing soccer [17]. There is also a RoboCup simulation league, where the games are not physically played, but are simulated on a computer. Both the physical and sim-ulation leagues provide researchers with a standard testbed in which to evaluate their AI strategies for various goals. In this context, previous work in automated commentary has focused primarily on automated play-by-play commentary. Byrne, Rocco, and MIKE [5] are three systems that produce automated play-by-play commentary for RoboCup simulator league games. The three systems obtain their data from the Soccer Server [17], which summarizes the gameplay’s main features—the player locations and orientations, the ball loca-tion, and the score. Each system generates natural language templates,filling in player and team names where appropriate, then uses text-to-speech software to verbalize the derived com-mentary. Dynamic engaging intelligent reporter agent (DEIRA) is a similar system to Byrne, Rocco, and MIKE, as it performs the same task, but in the sport of horse racing.
storytelling. That is, these systems tackle a problem that is different from what our work is aiming to solve—they auto-mate factual commentary with some bias added, but do not implement color commentary via stories. Our system could be used in conjunction with each of these automated play-by-play systems to create fully automated commentary, featuring both play-by-play and color.
Within its live online game summaries, MLB uses a system called SCOUT [18] that provides textual analysis of the cur-rent game. The viewer is shown information such as the type of pitches thrown during an at-bat and the tendencies of the batter with respect to the pitcher. While SCOUT provides some color, it is mostly a statistical summary and currently does not tell sto-ries. Our system could extend SCOUT by adding stories to MLB online game summaries.
Freytag and MacEwan [13] identify afive-stage pyramid of dramatic structure: exposition, rising action, climax, falling ac-tion, and denouement. Rhodeset al.[26] describe a system that follows this pyramid and adds dramatic commentary to sports video games by using language with different levels of emo-tional connotation depending upon the game situation. Values for the different motifs (themes) [7] are stored, as well as a vocabulary for each that changes as their level of intensity in-creases. Each theme has a set of actions that can occur in the game that either increase its intensity (Freytag’s rising action) or decrease its intensity (Freytag’s falling action). One theme within the system is “urgency,” with some level 1 phrases being “looking shaky” and “fortune not on their side,” and level 3 phrases being “doomed” and “beyond salvation.” Lexicalized tree-adjoining grammar is used to generate comments. While drama is added to the commentary with this program, it is an augmentation to the play-by-play commentary more than an ad-dition of color commentary. Our system could further augment the dramatic commentary by adding relevant stories. Using this dynamic as a feature could also help choose which stories are most relevant to the grand narrative arc.
IV. PROPOSEDAPPROACH
In this section, we present an AI approach to solving the problem of delivering story-based color commentary to a live baseball game. We start by framing the problem as an infortion retrieval problem (Secinfortion IV-A). We then describe the ma-chine-learning techniques used (Sections IV-B and IV-C) and
finally combine these techniques in Section IV-D.
A. Information Retrieval Framework
We approach the problem of automated story selection in sports as an information retrieval (IR) problem. In the context of sports, the game state for which we are seeking an appro-priate story is treated as the query, while the candidate stories returned by the system are the documents. Our system’s goal then is, given a game state, to return to the user a ranked list of stories, based on how appropriate they are for the game state. We assume that the game state is available live, as is the case for MLB [23]. We also assume that a database of stories has previ-ously been collected.
Thus, the problem is to retrieve stories most appropriate for game states during live sports broadcasts. Once a story database
has been obtained, a system must learn to match the stories to game states. The broader the story database, the more likely an appropriate story can be found that matches any given game state. As “being interesting” is an informal and subjective mea-sure, we evaluate the quality of the mapping by incorporating the selected stories into a simulated broadcast and test the en-joyment of viewers and the interest of professional commenta-tors.
To compare stories to game states, we extract features from both, such as the score, the teams involved, and what type of action is happening on the field (e.g., a home run). Formally, the game state is a vector of numeric features: . To illustrate, binary feature may be 1 if in game state there is a runner on first base. Integer feature can be the current inning. Similarly, a baseball story can be described with a vector of numeric features: . Binary feature can be 1 if the story involves a runner onfirst base and integer feature can be the inning number mentioned in the story. The task is then to map
to a relevant and interesting .
The match quality between a game state
and story is scored
on afive-point integer scale ranging from 0 for a completely inappropriate match to 4 for a perfect match. Thus, the problem is, given a game state , to retrieve a story of the highest possible match quality .
B. Training Data
We solve this problem by using IR techniques and machine learning. Rather than separately feeding the game state and story features to IR algorithms, we make the connection between cor-responding features more explicit. A similarity vector is com-puted for a game state specified by feature vector and a story specified by feature vector . Each component of vector is the result of comparing one or more features of to one or more relevant features of . Logical connectives are used to compare binary features. For instance, to match the runner onfirst base features of and , the biconditional over the corresponding
features is used: . For
nonbi-nary features, feature-specific functions are used. For instance, when comparing the current inning number and the inning number involved in a story , the similarity feature is cal-culated as , where values closer to 1 indicate a closer pairing of inning features. Another example is the mar-quee matchup feature valued between 0 and 1. It indicates how well the story and game state match in terms of a strong hitter and a strong pitcher being involved. This feature is calculated by combining several statistical features for the batter and the pitcher in with a story category feature in [20].
The similarity vector indicates how related and are, but does not provide a scalar value. What is needed is a way to map to —thefive-point-scale quality of the match between and . Machine-learning techniques are used to create this mapping from training data .
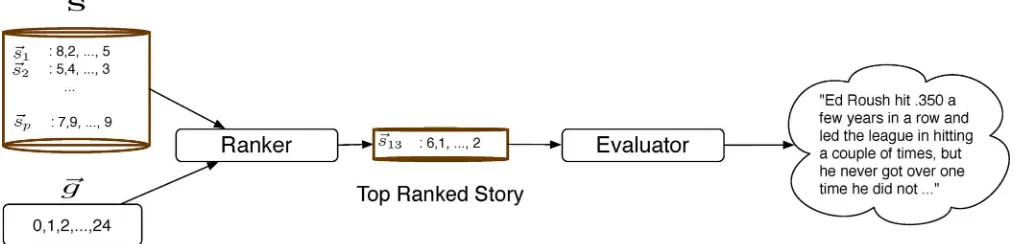
To build this training data set, a set of game state vectors is taken to form a set of similarity vectors for all and all story vectors from our
Fig. 1. SCoReS chooses a story to output to a commentator.
vector is then labeled with the ground-truth value of the quality of match between the corresponding game state and the story. Mathematically,
is the similarity vector for and . For simplicity’s sake in the rest of the paper, we refer to as the story library rather than the story vector library and as the game state library, rather than the game state vector library. Also, as game states and stories are the equivalent of queries and documents in this work, we will use the former terms in the rest of the paper.
C. SCoReS Offline
IR algorithms are generally divided into three groups: point-wise, pairpoint-wise, and listwise [22]. Pointwise algorithms are re-gression and classification algorithms, with mean squared error (MSE) typically used as an error function. Pairwise algorithms perform an incomplete ordering on the data. Listwise algorithms make direct use of IR metrics to search for a good ranking of documents.
Our approach to selecting stories for game states is a hybrid approach that uses a listwise algorithm to rank stories and a pointwise algorithm to evaluate the top-ranked story. This two-step process involves a “ranker” and an “evaluator,” as shown in Fig. 1. In this section, we describe the offline training and creation of the two elements of SCoReS, and then describe the online operation in detail (Section IV-D).
1) Machine Learning a Ranker: For the ranking algorithm, we adapted AdaRank [35], a listwise algorithm based on Ad-aBoost [12]. AdaRank forms a “strong” ranker by iteratively selecting and combining “weak” rankers. A weak ranker uses a single component of the similarity vector to rank (i.e., sort) the training data . Each weak ranker has a “vote” on thefinal ranking, based on how its ordering of over the training data was scored according to a chosen IR scoring metric.
SCoReS AdaRank (Algorithm 1) accepts as input a set of training data , the number of game states in , an IR scoring function , the number of weak rankers to compose the strong ranker , and the number of tie-breaking features to use . In line 1, SCoReS AdaRankfirst partitions by its constituent games states. This is done because stories can be meaningfully sorted by the match quality values only for a given game state. The ground-truth rankings are then calculated (line 2) for possible use in evaluating weak rankers (line 12). All weights are initialized to (line 3) as all game states are initially equally important. The main ranker and its corre-sponding confidence values are initialized to be empty sets
(line 4). The set of feature combinations to be considered for use in weak rankers is calculated based on the number of features in each in , and the number of features to use for tie-breaking (line 5).
Algorithm 1:SCoReS AdaRank.Input: : training data; : number of game states; : IR scoring function; : number of iterations; : number of tie-breaking features.Output: : ranker.
1: partition by game state:
2: sort each by values, yielding ground truths 3: initialize weights to 1
4: initialize ranker and weak ranker confidences to 5: get all combinations of length from
6: foreach iteration up to do 7:
8: foreach combination in do
9: if then
10: for do
11: sort by , yielding 12:
13: ifmean then
14: mean
15:
16: add to 17: calculate 18: add to 19: update
TABLE I
UNORDEREDTRAININGDATA FORSCORES ADARANK
TABLE II
THEORDERING OF AFTERBEINGSORTED BYFEATURECOMBINATION . RANDOMTIE-BREAKINGWASNECESSARY FOR GAMESTATE2 (BETWEENSTORIES1AND2)
ranker (line 16) and and are updated (lines 18–19) as in [35]. The data are reweighted after each iteration so that game states for which stories have been poorly ordered are given more weight (line 19).
As a small, concrete example, let be normalized discounted
cumulative gain (NDCG) [35], , and . Let
the similarity vectors in consist of the following features: the runner onfirst base feature , the strikeout feature , the inning feature , and the marquee matchup feature . The
first two are binary: they are 1 if both the story and game state involve a runner onfirst base (or both involve a strikeout), and 0 otherwise. The marquee matchup and inning features are com-puted as previously described. Table I shows possible training data split into its three constituent game states. The weight of each game is initially set to 1/3. The best feature combination for thefirst iteration is —the runner onfirst base fea-ture to be used as the main sorter, with the strikeout feafea-ture as a tiebreaker. Sorting by this feature combination yields the or-derings shown in Table II. Assuming we consider the top three ranking positions relevant, the NDCG scores for each game state
in this ordering would be (0.97, 0.59, 0.89), with weighted mean (as all weights are equal).
The weak ranker for this iteration would thus be and would not be considered as a main sorter in weak rankers in later iterations (as it is the main sorter here). is calculated with the following formula (from [35]):
where is the vector of match qualities for the ordering of game state by , and is the vector of match qualities for the ground truth. for this iteration would thus be 1.13. The weights for each game state are then updated with the following formula (from [35]):
giving the new .
On the second iteration, game state 2 has more weight, as the weak (and main) ranker failed to sort it as well as it did game states 1 and 3. This leads to
, and thus main ranker
and . After normalizing, .
This means the weak ranker using the inning feature to sort and the marquee matchup feature to break ties gets 53% of the vote for ranking , and the runner onfirst base feature combined with the marquee matchup feature tiebreaker gets 47% of the vote for the ranking output by SCoReS AdaRank.
2) Machine Learning an Evaluator: Though the ranker output by SCoReS AdaRank provides a ranked list of stories, it does not provide a value for for these stories. Thus, while there is always a top-ranked story for a game state, SCoReS AdaRank provides no indication as to how “good” the top-ranked story is. We added an evaluator to provide an estimate of . The evaluator can then be used as a threshold to ensure the top-ranked SCoReS AdaRank story is worth telling. In principle, it is possible to use the evaluator on its own to rank stories. The reason we do not do this is because of its point-wise nature; it uses MSE as a scoring metric, which treats each datum equally: there is no preference with respect to accuracy toward the top of a ranked list. Thus, the accuracy at the bottom of the ranked list is regarded as being as important as the top of the list, making using the evaluator as a ranker less desirable than the ranker–evaluator combination.
D. SCoReS Online
Our SCoReS system thus consists of a ranker (learned by SCoReS AdaRank) and an evaluator (learned by a pointwise algorithm) as shown in Algorithm 2.
Algorithm 2:SCoReS.Input: : game states for a live game; : our story library; : ranker from SCoReS AdaRank;
: weak ranker confidences for ; : evaluator; threshold for evaluator.
3: create , comparing to
4: rank with and
5: top-ranked story 6: if
7: output to broadcast team (or viewer)
SCoReS processes each game state in a given (novel) game (line 1). If the current game state is appropriate for a story we create similarity vectors of and each story in (line 3). Generally, any game state is appropriate to suggest a story to human commentators, but in the case of SCoReS operating au-tonomously (as in video games), we limit the number of stories output to the viewer by only allowing stories to be told after an appropriate “downtime” (typically 10–20 pitches). The sim-ilarity vectors are sorted with the ranker and confidences learned by SCoReS AdaRank offline (line 4). The top-ranked story is extracted in line 5 and then scored by the evaluator in line 6. If the story passes the provided threshold , and SCoReS is operating autonomously, the story is output to the viewer (line 7). If a broadcast team is using SCoReS, the top few stories can be output.
V. EMPIRICALEVALUATION
To evaluate the quality of SCoReS, we conducted a series of empirical studies where we asked potential users to eval-uate the system. We examined several possible applications of SCoReS: providing generic commentary, adding stories to ex-isting commentary, picking context appropriate stories, and as-sisting professional commentators to select stories. These re-sults are a more comprehensive exposition of the rere-sults pre-sented in [21].
We conducted several user studies to evaluate whether SCoReS improved broadcast quality in any of these applica-tions. Thefirst user study was conducted to ensure commentary was beneficial within our game library before we even tried to improve said commentary. Subsequent user studies tested whether adding stories to a broadcast within our game library helps and whether intelligently selecting stories based on the game context works better than simply adding any story to the broadcast. A demonstration of the SCoReS system to profes-sional commentators was also carried out. Their feedback is an estimate of whether SCoReS can be successfully deployed in a professional broadcast setting.
These experiments evaluated SCoReS in both its modes of operation: as an autonomous commentary tool within the user studies, and as an assistant to a human color commentator in the interviews with professional commentators. In the user studies, we inserted the top-ranked story from SCoReS into video clips from actual baseball games. We chose to use actual games because watching clips from a video game would likely not be interesting to the participants, inducing boredom. Note that improving commentary from actual games appears to be a harder problem than improving sports video game commentary, as commentary in video games is prerecorded and generic, whereas commentary during an actual game is tailored to that particular game.
TABLE III
THESTORY ANDGAMESTATECATEGORIESUSED INOUREXPERIMENTS
In order to build training data for SCoReS, wefirst down-loaded MLB game statistics from MLB’s XML site [23], with permission from MLB. For all experiments, the game state and story features were kept constant. The feature vector for each game state included statistics such as the score, the inning, the date, the teams involved, and various statistics for the current batter and pitcher (such as home runs and wins). Statistics for the previous pitch’s batter and pitcher were also present because stories are often told in reference to an event preceding the cur-rent game state. Details are found in [20].
One hundred and ten stories were gathered fromRob Neyer’s Big Book of Baseball Legends[25],Baseball Eccentrics[19], andWikipedia. Stories ranged in year from 1903 to 2005. An example of a story fromRob Neyer’s Big Book of Baseball Leg-endsis the following, concerning a matchup between two base-ball stars Greg Maddux and Jeff Bagwell in the 1990s:
“Leading 8-0 in a regular-season game against the As-tros, Maddux threw what he had said he would never throw to Jeff Bagwell, a fastball in. Bagwell did what Maddux wanted him to do—he homered. So two weeks later, when Maddux was facing Bagwell in a close game, Bagwell was looking for a fastball in, and Maddux fanned him on a changeup away.”
This story would have a high match quality with game situa-tions that involve a large difference in scores (eight runs in the story) and a matchup between star players. Feature selection and categorization of the stories were done by hand. Story features were similar to game state features, but also included the cat-egory. Using our baseball expertise, and based on the features available from MLB’s XML site, we chose the ten categories listed in Table III. While these categories are not those used in other work, we thought they were appropriate given the avail-able data (i.e., it would be difficult to categorize a game state as “the Lucky Break Victory” as in [31] without video of the game, using only selected statistics).
TABLE IV
RANKERPRODUCED BYSCORES ADARANKWITH4400 TRAININGDATA
matchup, great statistics for batter or pitcher, bad statistics for batter, bad statistics for pitcher, opening of inning, important games from history, bigfinish, blow out, and home run hitter in a one-run game. Other similarity features scaled between 0 and 1 included balls, strikes, outs, inning, run difference, and month. We refer the reader to [20] for complete detail on the feature vectors, as the full sets of game, story, and similarity
features totaled , providing SCoReS with
what we believed would be a sufficient number of features to choose stories.
A. Choosing a Ranker
In order to choose a rankerand an evaluator for SCoReS, we performed a leave-one-out cross-validation experiment. Training data consisted of 40 randomly selected game states from the 2008 MLB season and the 110 stories gathered from various sources. At each cross-validation fold, 4290 data (39 game states 110 stories) were used for training, while 110 data (1 game state 110 stories) were used for testing. The same story database was used in training and testing. Candidate evaluators were trained on and then used within SCoReS at each fold.
For IR scoring metrics , we considered the following: NDCG, mean average precision (MAP), winner takes all (WTA) [35], expected reciprocal rank (ERR) [8], and return score (RS), a metric that simply returns the match quality of the top-ranked story. We tested the cross product of this set
of scoring metrics and . We
also tested higher values of with a reduced set , including the cross product of the full set of scoring metrics
and , and the cross product of the full set of
scoring metrics and .
Cross validation chooses the set of parameters that is best at predicting the score of unseen game state–story pairs. The best performing instantiation of SCoReS had a decision tree as the evaluator. The best set of parameters for AdaRank found using
this process was NDCG . To choose the
actual ranker for SCoReS, we provided all 4400 training data to SCoReS AdaRank. This produced the ranker shown in Table IV.
This combination of ranker and evaluator output stories that averaged a 3.35 match quality. Stories were only output for 23 of the 40 folds, because in 17 folds, the evaluator (decision tree) deemed the story chosen by SCoReS AdaRank to be of
insuf-ficient quality to output. As a comparison, a perfect selector (based on the ground-truth labelings, done by hand by a domain expert) would output stories with a 3.7 average match quality, outputting a story for all 40 folds. The decision tree, operating
on its own, output stories that averaged a 2.3 match quality, out-putting a story for all 40 folds. Thus, it does not provide as good a ranking as the ranker, but does provide a scalar value within the hybrid approach that is used as a threshold to deter-mine which stories are output by SCoReS.
These experiments show that SCoReS performs well with re-spect to outputting a story with a high match quality, which is one of the goals of the system. Related metrics for evaluating SCoReS are the enjoyment of viewers watching games con-taining commentary augmented by SCoReS and how useful pro-fessional commentators think SCoReS would be to them while they are commentating on live games. To evaluate SCoReS in these ways, we made the transition from cross-validation ex-periments to user studies and interviews with professional com-mentators.
B. User Studies
The true measure of success for SCoReS is how viewers per-ceive the stories it selected in the context of the game. We con-ducted two user studies to test whether commentary improves a broadcast, whether inserting stories into a broadcast makes it more enjoyable, and whether the added stories need to be in the proper context to add to the broadcast. Each user study involved participants watching video clips from two AAA (minor league) baseball games: the July 15, 2009, AAA All-Star game between the International League and the Pacific Coast League, and the April 7, 2011, game between the Buffalo Bisons and Syracuse Chiefs. Each study involved three different types of commen-tary, depending upon which hypothesis we were testing. Each video clip was between three and six minutes in length, and they were always shown in chronological order. The order of the commentary, however, varied. After each clip, participants answered questions related to their enjoyment of the clip. At the end of the session, participants completed a background ques-tionnaire.
1) User Study I—The Need for Commentary: In thefirst user study, we compared “SCoReS commentary” to two different types of commentary. For “no commentary,” we removed the commentary from the broadcast, and left the crowd noise.1The
“original commentary” had voiceovers for the original profes-sional commentary, with no stories inserted or present in the original commentary. Voicing over the commentary was neces-sary as we needed to insert stories into some types of commen-tary, and, for consistency, needed the stories read in the same voice as the other commentary. Otherwise, any difference in preference might reflect a preference for certain voices, and not for the addition of the selected stories. The “SCoReS commen-tary” contained a story selected by our system.
We recruited 16 participants from the local community. To measure the quality of the different types of commentary, we evaluated participants’ answers to the eight questions listed in Table V. For both games, each participant saw one clip each with “original commentary,” “SCoReS commentary,” and “no commentary.” Thus, each participant saw six video clips in total.
1The crowd noise was artificial as we could not remove commentary without
TABLE V
USERSTUDYQUESTIONSASKED TOPARTICIPANTS INUSERSTUDY1. PARTICIPANTSWEREASKED TORATEEACHQUESTIONFROM
1TO7 (STRONGLYDISAGREE–STRONGLYAGREE)
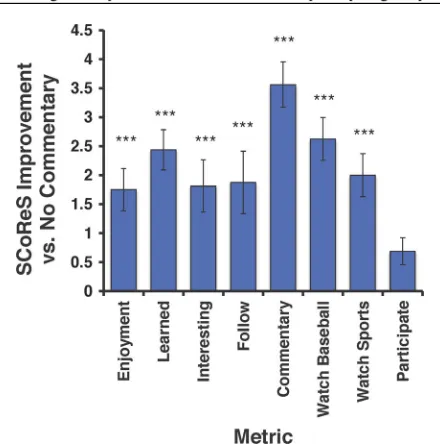
Fig. 2. Mean ( standard error of the mean) difference between “SCoReS commentary” and “no commentary.” *** indicates .
TABLE VI
PARAMETERS FORUSERSTUDYI
For this experiment, SCoReS was trained on 35 game states and 88 stories (3080 data), as we did not yet have our full training data.
The parameters for this experiment are shown in Table VI, with the ranker being that shown in Table VII. Jim Prime, who did the play-by-play for this study, is an author of several baseball books, including Ted Williams’ Hit List, a book he coauthored with Ted Williams of the Boston Red Sox [34]. SCoReS had a database of 88 stories from which to choose stories for each game state. Fig. 2 shows that “SCoReS com-mentary” ranked significantly higher than “no commentary” across all metrics.
Given the a priorihypotheses that “SCoReS commentary” would outperform other forms of commentary, a one-tailed t-test was used to check for significance in the results of all experiments. After correcting for multiple comparisons with a Holm–Sidak adjustment, “SCoReS commentary” ranked significantly higher than “no commentary” across all metrics
TABLE VII
THERANKERPRODUCED BYSCORES ADARANKWITH3080 DATA
except “Viewing this clip made me more interested in par-ticipating in sports.” There were no significant differences between “SCoReS commentary” and “original commentary” in this experiment.
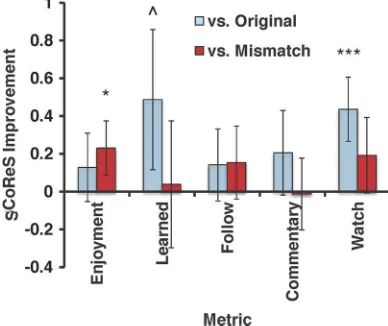
2) User Study II—Baseball Fans Prefer SCoReS: Having collected evidence that commentary itself adds entertainment to a game broadcast, we changed the user study format, re-placing “no commentary” with “mismatch commentary.” For “mismatch commentary,” we inserted a story in the same place as we would with SCoReS, but instead of the story being se-lected for that game state, it was actually a story chosen by SCoReS for a different game state, in the other game the par-ticipant saw. This manipulation kept the story pool consistent across the conditions, thereby controlling for the overall level of interest.
User Study II differed further from User Study I in the fol-lowing ways. An extra clip was added before the clips of in-terest because pilot data indicated that thefirst clip in a sequence was always rated more poorly. Participants were screened with the question “Are you a baseball fan?” As baseball fans actually enjoy baseball games, we hypothesized that they would be likely to notice differences in commentary. Also, SCoReS is built to improve the enjoyment of a sport for a fan. If someone does not enjoy a sport to begin with, it may be difficult to change his or her mind. SCoReS had access to the full 4400 training data, and output the ranker shown in Table IV. Parameters for this study are given in Table IX. Len Hawley, the play-by-play com-mentator for the Acadia University Varsity Hockey (Wolfville, NS, Canada) team did the play-by-play reading for these ex-periments. Clip ordering was counterbalanced across subjects, ensuring that each type of commentary appeared in each chrono-logical position the same number of times for each game.
Fig. 3. Mean ( standard error of the mean) difference between “SCoReS commentary” and original commentary” or “mismatch commentary.” *** in-dicates ; * indicates ; indicates .
TABLE VIII
QUESTIONSASKED TOPARTICIPANTS INUSERSTUDYII
TABLE IX
PARAMETERS FORUSERSTUDYII
we believe this is to be expected as eliminating commentary al-together should reduce enjoyment more than altering said com-mentary. Questions 6–8 from Table VIII are omitted from the graph as the questions were irrelevant to the “original commen-tary” case. Note that while there were no significant differences between “original commentary” and “SCoReS commentary” in User Study I, where there was no screening for baseball fans, there were significant differences in User Study II, where base-ball fans were targeted.
C. Interviews With Commentators
In this study, we demonstrated SCoReS to professional com-mentators. To evaluate the potential usefulness of SCoReS, we
first asked them, “Would you be interested in a system that sug-gests interesting stories during a game?” Then, we demonstrated SCoReS to the commentators, delivering three stories for four different clips. After each clip, we asked, “Would you tell any of the suggested stories?” The commentators could answer based on a synopsis, or choose to see the full story text. After the full
demonstration we asked, “Would you be interested in this par-ticular system?” The ranker used within SCoReS to choose sto-ries for the demonstration was the same as therankerused in the second user study (Table IV).
The four commentators were Mark Lee and Kevin Weekes, a play-by-play and color commentator team for the Canadian Broadcasting Corporations’s (CBC’s)Hockey Night in Canada
program; Dan Robertson, play-by-play commentator for var-ious sports (including baseball) for Eastlink Television; and Len Hawley, the play-by-play commentator for Acadia University Hockey.
All four commentators said they thought a system such as SCoReS would be a useful tool to have at their disposal. When asked about SCoReS itself, they all answered that it would be a great tool not only for baseball, but also for other sports, with a few tweaks. In particular, stories would need to be kept short for hockey broadcasts, which is a faster paced sport.
Among the four clips shown to each commentator, a story suggested in two of them would have been told by Mark Lee and Kevin Weekes. They offered several other insights as well. First, even if the stories suggested are not appropriate at the time of suggestion, once commentators have seen them, they can keep the stories in mind in case they are relevant later. As Mark Lee pointed out, on the two occasions he did not choose to tell a story, SCoReS suggested stories with a bor-derline match quality to the current game state, but if the game state were to change slightly, the match quality could become high enough for the story to warrant telling. Second, a system such as SCoReS would need to be completely integrated into a broadcast, and not simply used by the commentating team. This would allow the producers to add imagery to the broad-cast, relevant to the story that the commentators choose to tell. Third, while commentators do know many stories about the sport being broadcast, there are too many different parts of the game they must monitor and process in order to properly broad-cast the game that they often cannot think up stories on their own. Thus, SCoReS can be beneficial to the broadcasters not only in terms of suggesting stories they do not know, but also in terms of stories they do know, but would not have thought of and connected to the current game state. Last, while older stories may seem less relevant to younger viewers, they are ac-tually quite relevant to viewers who watched games at the time the stories took place. Thus, SCoReS can help keep the interest of several generations of sports fans by connecting a sport’s past to its present.
VI. DISCUSSION ANDCONCLUSION
We have shown that SCoReS has a statistically significant positive influence on the sports viewing experience across several metrics. National commentators Mark Lee and Kevin Weekes were particularly positive about the system, suggesting its appeal for a broad audience. This indicates that imple-menting SCoReS in professional commentating may lead to a better viewing experience.
A. Lessons Learned
Participants in the user studies were recruited from subject pools, and study participation made up a part of their grade. Thus, they did not watch the video clips at a time of their choosing, as opposed to a fan watching on television. A more effective way of evaluating SCoReS would be to have baseball fans evaluate the system at a time of their choosing, when they are interested in watching baseball. We think that testing on a large focus group of appropriately targeted individuals in the right setting would produce a more robust result.
Viewing three to six minute clips of games can make it
dif-ficult for a participant to gain context in the game, and thus make it difficult to appreciate an appropriately placed story. An ideal setup for SCoReS evaluation would be to have participants watch longer stretches of baseball games, so that they could better gauge whether a particular story should be told at a par-ticular time.
Professional commentators generally state why stories they are telling are relevant, to give context to the story. This did not happen during the user studies, because we believed this would have biased participants’ answers to some of the questions. In hindsight, it may have been possible to state why a story was being told by mentioning the game features that led to the story’s selection, for both the “SCoReS commentary” stories and the “mismatch commentary” stories.
SCoReS was trained on data from MLB games, but due to footage availability issues the user studies and demonstrations to professional commentators involved AAA games. Training and testing SCoReS on the same professional sports league should help improve the performance of the system as the team match features can use the exact teams playing instead of matching to affiliated teams as they do now (e.g., matching the Buffalo Bisons to their MLB affiliate, the New York Mets).
Despite these challenges, SCoReS was able to achieve sig-nificant improvements in overall enjoyment and increasing in-terest in watching baseball, and we surmise that, in a more re-alistic future deployment, SCoReS would further improve the entertainment value of sports broadcasts. Identifying these chal-lenges and the ways to overcome them is one of the contribu-tions of this project, and we hope these will be used by future researchers.
B. Future Research
In the future, we would like to augment SCoReS with base-ball facts, in addition to stories. These facts would be shorter bits of information from baseball’s past that could be told quickly. Also, the system would benefit from an automated bot to per-form several tasks. The bot could mine the web looking for rel-evant stories, providing SCoReS with an ever-growing set of
stories from which to choose. The bot could also automatically extract features from the stories itfinds, eliminating the need to do so by hand.
Adding more training data (both game states and stories) should also benefit SCoReS, by helping to create a more intelligent learner. A larger story database for SCoReS to choose from online should provide for a system with more
flexibility, making it more likely there is a story in the database relevant to each game situation encountered. Data labeling is a time-consuming process that could be performed by multiple individuals (rather than just one domain expert), possibly making use of such services as Mechanical Turk [4]. Another source of training data is stories that were actually told by professional commentators. These matches provide one “good” example of a story for a game state, but no negative examples, as the commentator may have considered other stories relevant as well, even if he or she did not tell them.
We would also like to expand the game state, story, and simi-larity feature sets, taking into account aspects of each that could lead to a better connection between a story and a game state. Physical observations such as player dispositions, weather con-ditions, and the volume in the stadium would provide a richer set of features from which to choose an appropriate story. These observations could also expand the set of game state and story categories given in Table III. Finally, in order to connect stories to each other and to a running theme in the game, we would like to add to the similarity feature vector both features of stories previously told in the game and a feature representing the cur-rent assumed theme. This would help create a running narrative during a game.
C. Future Applications
SCoReS offers many possible future applications along the lines of fully automated commentary. Combining SCoReS with the systems described in Section III (such as Byrne) would yield a completely automated commentating system. Sports video games could increase their story databases, and then use SCoReS to select between these stories during gameplay. Automated storytelling systems such as Statsheet and Narrative Science could use SCoReS to automatically add stories to their own automatic recaps of games.
SCoReS could also be used to create personalized color com-mentary. The viewing experience could be tailored to not just groups, but individuals, through web broadcasts. Features de-scribing the viewer could be input into the system, and sto-ries could be selected partly based on these features. Finally, SCoReS could be used for story selection in real-time strategy games such asStarCraftas they have their own sets of features and stories, and often contain commentary.
D. Conclusion
commentators. We believe this to be a contribution to thefield of AI with immediate practical applications.
ACKNOWLEDGMENT
The authors would like to thank Minor League Baseball for providing baseball footage; L. Hawley and J. Prime for helping with commentary; M. Lee, K. Weekes, D. Robertson, and L. Hawley for helping evaluate SCoReS; and Acadia University, Wolfville, NS, Canada (in particular B. Trofanenko) for helping with the user studies.
REFERENCES
[1] 2K Sports: MLB 2K7 2007 [Online]. Available: http://2ksports.com/ games/mlb2k7
[2] Statsheet, 2012 [Online]. Available: http://www.statsheet.com, [3] R. Altman, “Television/sound,” inStudies in Entertainment: Critical
Approaches to Mass Culture. Bloomington, IN, USA: Indiana Univ. Press, 1986, pp. 39–54.
[4] Amazon, “Mechanical Turk,” 2012 [Online]. Available: https://www. mturk.com
[5] E. Andre, K. Binsted, K. Tanaka-Ishii, S. Luke, G. Herzog, and T. Rist, “Three RoboCup simulation league commentator systems,”AI Mag., vol. 76, pp. 57–66, 2000.
[6] J. Bryant, D. Brown, P. Comisky, and D. Zillman, “Sports and specta-tors: Commentary and appreciation,”J. Commun., vol. 32, no. 1, pp. 109–119, 1982.
[7] J. Bryant, P. Comisky, and D. Zillman, “Drama in sports commentary,” J. Commun., vol. 27, no. 3, pp. 140–149, 1977.
[8] O. Chappelle, D. Metzler, Y. Zhang, and P. Grinspan, “Expected recip-rocal rank for graded relevance,” inProc. Conf. Inf. Knowl. Manage., 2009, pp. 621–630.
[9] A. Dix, J. Finlay, G. Abowd, and R. Beale, Human Computer Interac-tion. Englewood Cliffs, NJ, USA: Prentice-Hall, 1993.
[10] M. Duncan and C. Hasbrook, “Denial of power in televised women’s sports,”Sociol. Sport J., vol. 5, pp. 1–21, 1988.
[11] Narrative Science, 2012 [Online]. Available: http://www.narrative-science.com
[12] Y. Freund and R. E. Schapire, “A decision-theoretic generalization of on-line learning and an application to boosting,” inProc. Eur. Conf. Comput. Learn. Theory, 1995, pp. 23–37.
[13] G. Freytag and E. MacEwan, Freytag’s Technique of the Drama: An Ex-position of Dramatic ComEx-position and Art. Scott. Chicago, IL, USA: Foresman and Co., 1908.
[14] K. Hammond, R. Prather, V. Data, and C. King, “A provider-interac-tive medical record system can favorably influence costs and quality of medical care,”Comput. Biol. Med., vol. 20, no. 4, pp. 267–279, 1990. [15] IGN, “MLB12: The Show Review,” 2012 [Online]. Available:
http://ca.ign.com/games/mlb-12-the-show/
[16] E. Kennedy and L. Hills, Sports, Media and Society. New York, NY, USA: Bloomsbury Academic, 2009.
[17] H. Kitano, M. Asada, Y. Kuniyoshi, I. Noda, E. Osawa, and H. Matubara, “Robocup, a challenge problem for AI,”AI Mag., vol. 18, no. 1, pp. 73–85, 1997.
[18] M. Kory, “Out of leftfield: Scouting the scout,”Baseball Prospectus, May 7, 2012 [Online]. Available: http://www.baseballprospectus.com/ article.php?articleid=16835
[19] B. Lee and J. Prime, Baseball Eccentrics. Chicago, IL, USA: Tri-umph Books, 2008.
[20] G. Lee, “Automated story-based commentary for sports,” Ph.D. dis-sertation, Dept. Comput. Sci., Univ. Alberta, Edmonton, AB, Canada, 2012.
[21] G. Lee, V. Bulitko, and E. Ludvig, “Sports commentary recommenda-tion system (SCoReS): Machine learning for automated narrative,” in Proc. Artif. Intell. Interactive Digit. Entertain. Conf., 2012, pp. 32–37. [22] T. Liu, J. Wang, W. Zhang, and H. Li, “Listwise approach to learning to rank-theory and algorithm,” inProc. Int. Conf. Mach. Learn., 2008, pp. 1192–1199.
[23] Major League Baseball, “Live XML game summaries,” 2011 [Online]. Available: http://gd2.mlb.com/components/game/
[24] J. Michener, Sports in America. Robbinsdale, MN, USA: Fawcett Books, 1976.
[25] R. Neyer, Rob Neyer’s Big Book of Baseball Legends: The Truth, The Lies and Everything Else. New York, NY, USA: Touchstone, 2008. [26] M. Rhodes, S. Coupland, and T. Cruickshank, “Enhancing real-time
sports commentary generation with dramatic narrative devices,” in Proc. Int. Conf. Interactive Digit. Storytelling, 2010, pp. 111–116. [27] M. Riedl, A. Stern, D. Dini, and J. Alderman, “Dynamic experience
management in virtual worlds for entertainment, education, and training,”Int. Trans. Syst. Sci. Appl., vol. 3, Special Issue on Agent Based Systems for Human Learning and Entertainment, no. 1, pp. 23–42, 2008.
[28] M. O. Riedl, “Narrative generation: Balancing plot and character,” Ph.D. dissertation, Dept. Comput. Sci., North Carolina State Univ., Raleigh, NC, USA, 2004.
[29] D. L. Roberts and C. L. Isbell, “A survey and qualitative analysis of recent advances in drama management,”Int. Trans. Syst. Sci. Appl., vol. 4, Special Issue on Agent Based Systems for Human Learning, no. 2, pp. 61–75, 2008.
[30] FanVision, 2012 [Online]. Available: http://www.fanvision.com/ [31] M. L. Ryan, “Narrative in real time: Chronicle, mimesis and plot in the
baseball broadcast,”Narrative, vol. 1, no. 2, pp. 138–155, 1993. [32] Playstation, “MLB 09: The Show,” 2009 [Online]. Available: http://us.
playstation.com/games-and-media/games/mlb-09-the-show-ps3.html [33] C. Smith, Storytellers: From Mel Allen to Bob Costas: Sixty Years
of Baseball Tales From the Broadcast Booth. London, U.K.: MacMillan, 1995.
[34] T. Williams and J. Prime, Ted William’s Hit List. Chicago, IL, USA: Masters Print, 1996.
[35] J. Xu and H. Li, “AdaRank: A boosting algorithm for information re-trieval,” inProc. Int. Special Interest Group Inf. Retrieval Conf. Res. Develop. Inf. Retrieval, 2007, pp. 391–398.
[36] R. M. Young, “Story and discourse: A bipartite model of narrative gen-eration in virtual worlds,”Interaction Studies, Social Behav. Commun. Biol. Artif. Syst., vol. 8, no. 2, pp. 177–208, 2007.
Greg Leereceived the Ph.D. degree in computing science from the University of Alberta, Edmonton, AB, Canada, in 2012.
He is a Postdoctoral Researcher with the NICHE Research Group, Dalhousie University, Halifax, NS, Canada. He is interested in the personalization of presented information, as well as machine learning, automated storytelling, and artificial intelligence in general.
Vadim Bulitkoreceived the Ph.D. degree in com-puter science from the University of Illinois at Ur-bana-Champaign, Urbana, IL, USA, in 1999.
He is an Associate Professor at the Department of Computing Science, University of Alberta, Ed-monton, AB, Canada. He is interested in building the strong artificial intelligence as well as understanding intelligence and cognition in humans and animals. He specializes in real-time heuristic search, AI in computer games including interactive narrative, and cognitive processes and models.