INTERRELATIONSHIP BETWEEN SMALL SCALE AND LARGE
SCALE INDUSTRY WITHIN THE INDONESIAN
CULTURAL AND ART
Sobarsa Kosasih
Lecturer of Economic Faculty, Trisakti University Jl. Kiyai Tapa Grogol Jakarta 11440, Phone : 021-5663232 ext 8336
ABSTRACT
The purpose of this paper is to report the result of a study aimed at the interrelationship between small scale indusry (SSI’s) and large scale industri (LSI’s) in Indonesia. The role of the SSI’s absorbed 83,6 million workers (Bapenas, 2005) is very important but its survival could be linked with its input and its output. As Indonesia occupied by more than 300 etnics, it is very possible if the SSI’s survival is linked to Indonesia cultural and art. Data were collected from around 200 companies that have linkage with almost the whole Metallurgical Industries in Indonesia both the large and the small one. System approach and multiple regression were used to analysis the relationship between the SSI’s and the LSI’s. The survival of the SSI’s and LSI’s has no different in concept, but in practice, they may not be met as the different ability to coordinate production factors. communication between them has yet to be the method for exchange information. The government’s role which previously predicted has a strong influence to this cooperation appear very weak. The study indicates that the interrelationship between the LSI’s and the SSI’s is very possible if the Indonesian economy is developed based on tourist industry. The study based on the data collected within metallurgical industry might be less representative to reflect the relationship between the LSI’s and SSI’s throughout industries. This study has contributed to develope an interrelationship between the SSI’s and the LSI’s based on sistem approach which involve the cultural environment.
INTRODUCTION
Indonesia had entered globalization era in Asean Free Trade Association (AFTA) 2003 and next 2020 in Asia Pacific Economic Cooperation (APEC). Along before entering this era, many experts question to Indonesian readiness, as any product resulted by Indonesian will compete with that of
the other countries. In that competitive environment, markets are no longger local but international
(Lummus et al., 2005). This question is directed to Indonesian related to the products that are going to
be competed especially manufacturing products. So far, Indonesia is also facing the other complicated
problem regarding with social gap. Scientists considered that this problem is a consequence of
government policy (especially in Orde Baru era) that has created disparity opportunity in economic
development. This policy then created various kinds of social problems that all of it has a source
on income distribution. Small Scale Industries (SSI’s) seems as an important role to overcome this
problem, as its operations are dispersed in rural.
In regard to globalization era, efficiency should be considered being the focus to get competitive power, and it should be achieved by cooperating among industries. To this, Interrelationship between the SSI’s and the LSI’s should be considered as a best way to achieve higher efficiency. It is proper if the government drives all elements thinking this interrelationship. Wade (1990) had investigated to
these companies’ relationship in Japan, South Korea, and Taiwan, and those countries are successful
performed to drive their industries.
National efficiency should be reflected by Indonesian products that have competitive power and able to compete in the international market. Since product as a result of many elements, the role of
managerial is also important to build this interrelationship. So, the interrelationship between the SSI’s
and the LSI’s is not only determined by the SSI’s product itself, but also by the role of managerial and
government.
H1: The higher the product quality resulted by the SSI’s, the stronger the inter-relationship between the SSI’s and the LSI’s.
H2 : The stronger the cooperation of top level management between the SSI’s and the LSI’s, the stronger the inter-relationship between them.
H3: The greater the degree of coordination by the government, the greater the degree of inter-relationship between the SSI and the LSI.
H4: The greater the degree of coordination by the government, the greater the degree of national
efficiency level.
This research is aimed at knowing the interrelationship between the SSI’s and the LSI’s in Indonesia in the field of metallurgical industry. This is an up stream industry to which its products would be destined to be one of the major material for heavy industry, automotive, electronic, train,
civil work. These products are resulted by the LSI’s. To this the LSI’s needs a lot of various types of
components that can be supplied by the SSI’s. The interrelationship between them is very possible
METHODS
Approximately, around 200 companies that have linkage with Metallurgical Industries which
represents almost the whole metallurgical industries in Indonesia, both the large and the small one
(BPS, 1996). In this research, concept of interrelationship is split into four main variables. Those
variables is analyzed becoming various kind of variables which is predicted have relation and support
to those main variables. Each then is changed into the other form and given an assignment to reveals
the attitude of respondent. This is arranged in the form of ranking from the smallest to the highest
score as its statement to given variable. By this ways, concept of interrelationship can be measured
quantitatively.
Besides the subjective measurement, that is the measurement of variables is based on the
respondent’s judgment, this concept is also based on the objective measures. Objective measurement
refers to the score of variable based upon valuation of documentation and observation upon the company. Those measurements are justified by both British and also American Scientists. British Scientists generally use the objective data, while American scientists generally prefer the subjective
data.
Data Processing
This research performed parametric method to test variables. The reasons are (1) Number of
variable is more than two, (2) Each variable are developed into continuous variables, (3) Data are
drawn from the large number (population), (4) Data are collected from empirical investigation. These characteristics enable the data are in condition with normal distribution which are able to fulfill the terms of parametric test in its investigation (Conover, 1980).
All variables predicted have relation to each other is plotted in a scatter diagram, so that the
relation between variables is known, both direction, magnitude, and shape of the relationship.
This relation will appear in the form of straight line, curve linear, parabolic, or the other curvature
dependent upon the characteristics of the relationship. Anyhow, not all variables’ values would fall
exactly within a line of regression, but it would be lied around it. The problem is how to draw the
regression line in order to represent all points scattered that shows the direction of the relationship.
There are some methods can be used to draw the regression line, from judgmental method until
the mathematical used. But among these, least square is the best method to estimate the regression
(Mirer, 1983). The logic behind of the method is that there is not straight line can completely represent
every dot in the scatter diagram, except perfectly correlation between those variables. By least square,
the line will be drawn mathematically and all dots scattered represent all variables values will be lied between the line. Is dependent variable really influenced by independent variable? It should be tested by way of hypothetical testing on regression line. This test would determine whether or not the slope of regression β is equal to zero. It would be tested by the t-student.
With significant level of α 0.05 or 5 %, conclusion of this test can be drawn. If the calculated value were larger than the critical value, null hypothesis would be rejected. It means that the
really influenced by independent (predictor) variables. Then association among variables would be tested by hypothetical test of correlation coefficient of unknown population. Whether or not all the independent variables either individually or simultaneously has affect to the dependent variable? It should be tested, whether the coefficients of partial regression β1; β2; ..; βn were equal to zero. This test will express how well the given independent variable affects to a dependent variable when
the others are controlled. This test would also unveil the possibility of multi co-linearity between
independent variables. The further test is simultaneous affect to the dependent variable which assume that all coefficients of multiple regression β1 + β2 + β3 +...+ βn = 0. Logically, if every coefficient of all independent variables is equal to zero, the variation of dependent variable could not be explained
by variation of all independent variables. This means that all independent variables have no effect
upon the dependent variable. If this were happened, the attempt to explain the effect all independent
variables upon a dependent variable would fail.
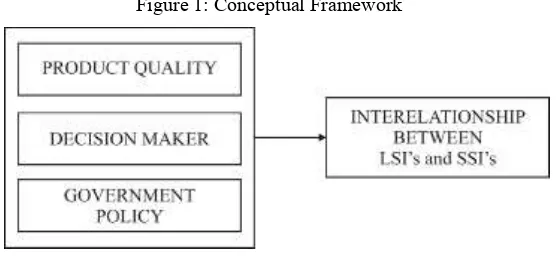
The major predictor variables used in this research are classified into three categories in terms of their sequence. These classifications are based on inference from empirical knowledge as well as conceptual and theoretical consideration that are Product quality (Qp), Decision-maker within the companies (Dm), and Government policy (Gp). These variables are classified into the independent variable, which would determine the interrelationship between SSI’s and LSI’s in Indonesia.
Figure 1: Conceptual Framework
RESULTS AND DISCUSSION
General
Based on criterion of BKPM, Industrial department, World Bank, and Committee for Economic Development (CED) of the U.S.A. show that the companies snared are classified into the SSI’s covers 70 %. 24% of them are classified into the MSI’s, and the rest are classified into the LSI’s. All companies above are joined together within Applindo Association. It also shows that almost all
companies categorized to the SSI’s are joined together within Aplindo, while the MSI’s and the LSI’s
are joined together within Giamm.
TheSSI’s have no specialization to produce product. 60,1% of them produce five kinds of product type, 24.8 % of them produces ten kinds of product type, and the rest produce more than 20 kinds.
It depends upon customer demand. Its operations to produce the products is not regularly but on and
The difference condition is found when looked over companies pooled within Giamm. 85% of the companies are owned by Chinese descent. Of the whole companies, 62 % of them cooperate with the foreign investment that have affiliation with the foreign companies especially in Japan, Korea, Taiwan and Singapore. This affiliation has effect to their production method, for instance they have foreign experts to control quality. Their product is also specialized and standardized which generally
related to components for automobiles such as radiators, fuel tanks, brakes, battery, cables, gaskets,
paints, glass, battery, tire and so on.
If looked at such illustration in which the SSI’s owned by the indigenous and the LSI’s and MSI’s owned by the Chinese descend, then compared with that of colonial era where Indonesia was still colonized. It seems the condition of business activity in Indonesia is not different. The SSI’s
known populace’s business is still in traditional manners and dominated by indigenous, while the MSI’s is still dominated by Chinese descent. The Chinese has ability to perform modern production methods and manage the larger business. Channel distribution is still dominated, even they are able to establish cooperation with the foreigners in the form of joint venture. They have been able to expand their business and grow up becoming large classified to the LSI’s. Yoshihara investigated that this cultural factor determines their business (Yoshihara,1989) seems has yet to change. As the cultural factor especially in language, foreign investors from Japan, South Korea, Taiwan, and Singapore are please to contact with the Chinese than the indigenous in their business.
Company Productivity
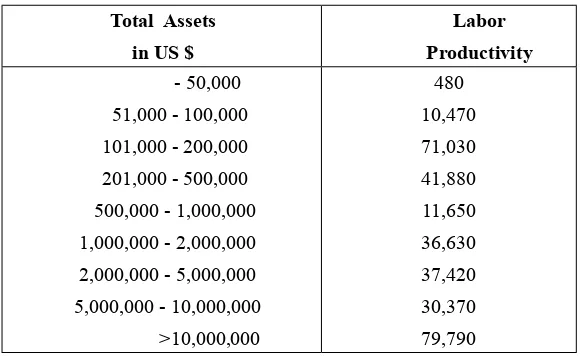
In regard to this productivity, the data shows a tendency that the larger the company is the
higher the productivity (see Table 1 and 2). As productivity is determined by many things, such as
management style, technological used, input and output side and so on. So, the larger the company
the better the productivity indicates that the larger company (1) has a better management, (2) has
better technology, (3) has ability to provide the input required continuously, (4) has accessibility to
the market.
Many management scientists such as Taylor (Scientific Management), Gulick and Urwick (Administrative management), Woodward (Industrial Organization), Thompson (Organization),
Monk, Schroeder, Haizer (Operations Management) have offered the opinion that interdependency of input, transformation process, and output, are created via causality. This causality clarifies that if one of component can do nothing, the others have no meaning anymore. Productivity resulted is
determined by materials, equipment, method, and employee (Kume, 1985). All these components
have to be available in adequate terms, in quantity, in quality and in time. When one of them is not
Table 1 : Company’s Productivity based on Questionnaire
Table 2 : Company’s Productivity Based on Giamm Directory Total Assets
Testing by scatter plot showed that 25 variables have effect to productivity. But after looking over the coefficient correlation, those variables are reduced becoming six variables. After testing by multiple regression, histogram with normal tendency, and model fit with 5% confidence level, those six variables confidently affect to the productivity. It is pointed out by the value of F-test = 12.907 is more than the value of F-table = 2.45. This effect is also showed by the t-student, which pointed out that all variables are simultaneously effect on the productivity. Yet, although six variables predictor correlate to the productivity (R = .626), these variables is merely able to explain 39,22 per cent (R2
Table 3 : Intercorrelation on Indices of Workers’ Productivity Q.22 Q.26 Q.27 Q.31 Q.35 Q.42 Q.53 Q.22 1.0000
Q.26 -.0034 1.0000
Q.27 -.0249 -.2610 1.0000
Q.31 .4109 .2700 -.1906 1.0000
Q.35 .2694 .1277 -.1070 .4329 1.0000
Q.42 -.0558 -.1254 -.0343 -.1804 .0765 1.0000
Q.53 .1033 .0760 .1143 -.1647 -.1778 -.0315 1.0000
Table 4 : Multiple Regression of Workers’ Productivity
Multiple R .62629 R Square .39224 Adjusted R Square .36185 Standard Error 1.00906
Table 5 : Analysis Variance of Workers’ Productivity
DF Sum of Squares Mean Square Regression 6 78.85474 13.14246 Residual 120 122.18463 1.01821 F = 12.90747 Signif F = .0000
Table 6 : Variable on Workers’ Productivity
Variable B SE B Beta T Sig T Q. 22 .321296 .071549 .338145 4.491 .0000 Q. 26 .108116 .040406 .202812 2.676 .0085 Q. 27 -.010778 .009408 -.085620 -1.146 .2542 Q. 35 .160236 .042434 .291202 3.776 .0002 Q. 53 -.037701 .017654 -.158758 -2.136 .0347 Q. 42 -.003272 .001426 -.166308 -2.295 .0235 (Constant) 3.307533 .640345 5.165 .0000
Quality of Product
Product quality has many definitions, and almost every scientist involved with it such as Feigenbaum (1991), Juran (1980), Ishikawa (1993) and the other scientists give different definitions. There is no clear definition (Schroeder, 1995), but all of them finally agree that quality of a product has to be viewed from two sides namely from producer side and consumer side (Ritzman, 1990).
From the producer’s viewpoints, quality is associated with designing and producing a product to
meet customer needs. From customer’s viewpoints, quality is often associated with value, usefulness,
or even price (Schroeder, 1995). Since a product is started from an idea till conveying it to customer,
from producer’s viewpoints, quality might be divided into three activities. Those are (1) Quality of
design, (2) Auality of conformance, and (3) Quality of marketing.
From the consumer side, product quality is viewed as a whole of its characteristics such as
performance, features, reliability, serviceability, durability, esthetic, and in perceived quality. In this
aspect. In order to fulfill the customer’s needs, quality has to have five characteristics. It covers (1) Technological related to strength and hardness; (2) Psychological related to taste, beauty, and status; (4) Time-oriented related to reliability and maintainability; (4) Contractual related to guarantee provisions; (5) Ethical related to courtesy of sales personnel, and honesty.
Measurement showed that productivity of the LSI’s is better than that of the SSI’s. This difference
is caused by the reality that the ability of the LSI’s is higher than that of the SSI’s either on input side,
transformation process, or on output side. Although their views on product quality have the same
point, but they have different in their ability to coordinate all production factors.
Table 8 : Intercorrelation of Indices of Product Quality
Q.21 Q.19 Q.22 Q.30 Q.38 Q.45 Q.47 Q.21 1.0000
Q.19 .6209 1.0000
Q.22 .4182 .2733 1.0000
Q.30 .3342 .2119 .3326 1.0000
Q.38 .1840 -.1409 .0494 .0946 1.0000
Q.45 .2491 .1558 .1984 .1265 .1161 1.0000
Q.47 -.0660 .0352 -.0400 .1127 .0928 .1656 1.0000
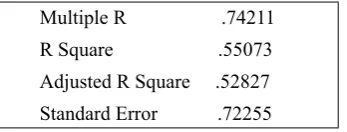
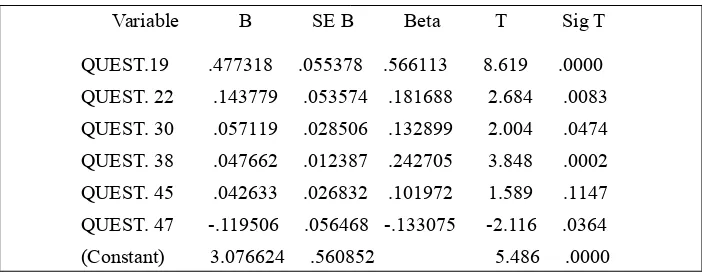
Like company’s productivity, product quality is also influenced by many variables. Statistical tests on 25 variables predicted showed that they have effect to product quality, but coefficient correlation reduced them becoming six variables. Those variables are significant with F-test, namely (1) Worker productivity, (2) Supplier delivery, (3) Equipment, (4) Operating procedure, (5) Supplier’s
supporting, (6) Management meeting. As company’s productivity, all variables supportive are nearly the same, even its relation is stronger, e.g. R = .7421. Yet, it is still low in which just 55 percent (R2 =
.5501) of total variation of product quality can be explained by the regression model (see Table 8).
Its seems, the point of view on the concept of quality between the SSI’s and the LSI’s is similar but
in practice, they may not be met as the different measurement. This is because the workers, supplier
delivery, equipment, operating procedure, cooperate with supplier, management skill that has effect
to the quality is different. The quality coveted by the customer has yet to create interrelationship
between the SSI’s and the LSI’s as their quality has yet to meet in practice.
Table 8 : Multiple Regression of Product Quality
Multiple R .74211
R Square .55073
Adjusted R Square .52827
Table 9 : Analysis of Variance of Product Quality
DF Sum of Squares Mean Square Regression 6 76.79893 12.79982 Residual 120 62.64989 .52208 F = 24.51686 Signif F = .0000
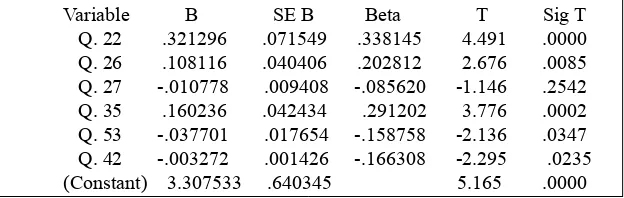
Table 10 : Variable on Product Quality
Variable B SE B Beta T Sig T
QUEST.19 .477318 .055378 .566113 8.619 .0000
QUEST. 22 .143779 .053574 .181688 2.684 .0083
QUEST. 30 .057119 .028506 .132899 2.004 .0474
QUEST. 38 .047662 .012387 .242705 3.848 .0002
QUEST. 45 .042633 .026832 .101972 1.589 .1147
QUEST. 47 -.119506 .056468 -.133075 -2.116 .0364 (Constant) 3.076624 .560852 5.486 .0000
Cooperation with Customer and Supplier
There are two types of cooperation that emerge between producer and customer, (1) At
organization level, and (2) At operational level (Thompson’s, 1967). First, refers to the strategic level
in which the owners or top level of management make a commitment. Second, refers to operational
activity in which the commitment of the strategic level is performed operationally. At strategic level, cooperation may appear in the form of (1) Contracting, (2) Co-opting, and (3) Coalescing.
In regard to this cooperation, almost all the SSI’s in Indonesia cooperate with their customer in the
form of subcontracting. This exchanging even might not be called as a subcontracting system, because when they received an order to make a product, it will finish after the product was delivered. It was also not performed routinely but on and off. No one of them cooperates by way of co-opting or coalescing.
Of all data collected, 18.9 % of respondent stated that they did not cooperate with customer. 54.3 %
cooperate by way of communication at owners level, and the rest did by way of communicating in
selling-buying events. But, of 54.3 % communication, not more than 10 % (or 9.4 %) of them carried
out by meeting routinely, and 33.9 % often. The rests was dispersed among sometimes (42.5 %) rarely
(12.6 %) and never (16 %). This condition is approximately the same as the cooperation with Supplier
that communication just placed at 44%, and just 10 % are carried out routinely. This is an indication that
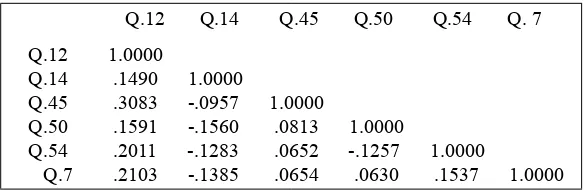
Multiple regression of those variables showed that coefficient determinant R2 = 29.2 which reflects
that just 29.2 % of total variation can be explained by regression model. This value is relatively small and unexpected, because it means that there are the other variables which have stronger influence the communication between the SSI’s and the LSI’s. The government’s role and the technological used previously predicted have a strong influence to this cooperation appear very weak.
Table 11 : Intercorrelation of Indices of Cooperation With Customer Q.12 Q.14 Q.45 Q.50 Q.54 Q. 7
Q.12 1.0000
Q.14 .1490 1.0000
Q.45 .3083 -.0957 1.0000
Q.50 .1591 -.1560 .0813 1.0000
Q.54 .2011 -.1283 .0652 -.1257 1.0000
Q.7 .2103 -.1385 .0654 .0630 .1537 1.0000
Table 12 : Multiple Regression of Cooperation With Customer Multiple R .54027
R Square .29190 Adjusted R Square .23085 Standard Error 1.79543
Table 13 : Analysis of Variance of Cooperation With Customer DF Sum of Squares Mean Square
Regression 10 154.14404 15.41440 Residual 116 373.93471 3.22358 F = 4.78177 Signif F = .0000
Table 14 : Variable on Cooperation with Customer
Variable B SE B Beta T Sig T
Q.14 .024022 .007588 .259129 3.166 .0020 Q. 45 .199560 .067077 .245284 2.975 .0036 Q. 50 .258414 .102913 .205925 2.511 .0134 Q. 54 .043451 .018559 .196230 2.341 .0209 Q. 7 .051605 .021677 .193823 2.381 .0189
When discussing with some owners and the leader of the association of SSI’s related to the
exchange information, the Researcher came to the conclusion that exchange information between the
SSI’s and the LSI’s almost nothing. Many of them even did not know whether or not their product
has a problem when the customers used it. They have no written data related to the product quality.
Many of them did not know what should they do to increase their product quality, as they had no data
to be based for improving product quality.
This condition contrasts with the MSI’s and the LSI’s that had been able to cooperate with
some foreign experts from Japan, Korea, or Taiwan companies. Those experts perform control over
product quality, giving production engineering and even managerial training. For instant quality
control, lathe worker, welding, metal handwork, casting, and so on.
The other cooperation is conducted by way of coalescing or joint venture. It performed the MSI’s
with the LSI’s from Japan, Taiwan, Singapore, Korean, even with European and American companies.
This cooperation is stronger than that of co-opting, because the big companies did not only send the experts but also invested their money. They generally joint ventures with the Chinese descent. They determine production control even the company policy. Routine meeting was performed in the form
of Daily Meeting, Weekly, even Monthly Meeting to discuss any problem related to the product
resulted.
Government Support
In regard to the government support, there are many factors that would be paid attention. Of fifteen variables predicted which potentially affect to government policy, just five variables that confidentially effect by F-test. Technological used, difficulties in selling, and material problem predicted have strong effect to the government policy were out of the equation. The resulting product
as an input-output relationship, and also the local material used by the company, were refused by t test. Just employee and total assets were confidentially received by both F test and t test. On the whole, all five variables give a weak contribution with R = 46.5 or (R2 = .216). This result showed
that the government policy has not significant affect to the company relationship, either on output side or on input side. Its mean that in practice, the coordination by government to all economic agents
in Indonesia was not effective.
The regulations create various understanding and many difficulties in operation as it has different criterion that made confuse both the SSI’s and the public servants. When the SSI’s wanted to establish
a business, they should expend various costs for getting to any licensing (Prawirokusumo, 1998).
On the other side, control over the LSI’s activities from government institutions almost nothing as corruption behaviors from government officials. Social control to correct unfair business was not developed even every opposition of government policy was always oppressed. Many natural
resources are processed without thinking its environment. The social gap between the rich and the
poor is very clear.
Without statistical test, it can be showed that efficiency of the LSI’s and the SSI’s in Indonesia is very weak. Its cause is low coordination from the government. Hypothesis that the greater the degree of coordination by the government, the greater the degree of efficiency, can be proven but in the opposite situation, that is the lower the degree of coordination by government, the lower the degree of efficiency.
So far, Indonesian has 44,6 million MSI’s and SSI’s (Bapenas, 2005) in various kinds of activity
such as transportation, metalurgical, handicraft, accomodation, hotel, restourant, and so on. These
MSI’s and LSI’s are able to absorp 83,6 million employment although they have many problems
within their organization. Indonesia has also been being faced to the unemployment problem which
problem seems to be very close with that of the SSI’s survival and growth. If the SSI’s and the MSI’s
problem can be overcomed, thus the unemployment problem can also be overcomed.
The uniqueness of Indonesian cultural
Indonesia has 17,508 islands with its beautiful seashores, sea gardens with many kinds of fish, active volcanoes, rich in flora and fauna and its rarest of animals. These islands are occupied by more than 300 etnic communities with its distinctive customs and cultures in traditional music, dances,
songs, architecture, mosques, temples, shrines and palaces, and a variety of cuisines. These islands
and its communities make Indonesia becoming the uniquiness country that can not be found enywhere
else in the world.
This uniquiness can be processed and packaged by the SSI’s and MSI’s becoming a product that
can be sold in the form of tourism industry. The raw material of the product should not be imported
and experts should not come from other countries. Everything is available from nature and culture
anywhere in the region of Indonesia. Its customers are tourists of both outside and domestic. They would be attracted and tempted to go climbing, go diving, go walking, go camping, go surfing, or just lay-down on the seashore to enjoy the natural beauty. They would also be attracted to test regional
cuisine, watching traditional music, buying the souvenir and or spend their night in a traditional
cottage.
By developing the tourism industry, the SSI’s, MSI’s, and even LSI’s would be driven to develop
any regional product. They would also be driven to create interrelationship as the product required
by Tourism Industry has lingkage each other, for instance entertainment, hotel and cottage, travel
agent, cuisine and the other. Those activities would involve skills and materials that grow up and derive from each region in Indonesia. It enable to the companies operate in an efficient condition as its materials and skills do not have to be imported.
Tourism industry needs proper infrastructure in the form of airports, roads, bridges, railways,
harbors, telecommunication, and the others facilities to convey tourists from the region to other
regions, from the island to other islands. This requirement creates the demand for products of heavy
industries to build those infrastructures. It then would drive kinds of business on land, on sea and
on air. Demand multiplier effect would also be created for the other supporting products that would
absorb a great deal of employees, which in turn create income distribution, and regional building. By
way of developing Tourism Industry the demand for the output of the SSI’s, MSI’s can be created
while input components have been availabe in each region of Indonesia. It can also creates the
interrelationship between the small and the large one.
CONCLUSION
This study examined the impact of product quality, communication, and government’s support,
to the interrelationship between the SSI’s and the LSI’s in Indonesia. Empirical evidence found in
output side, is weak although their views on product quality have the same point. Cooperation between the SSI’s and the LSI’s to reduce the uncertainty both at strategic level and operational level is very weak. Communication between them in the form of information exchange related to the product delivered or received has yet to be the method for the SSI’s and the LSI’s to develop their
interrelationship.
The government’s role which was previously predicted has a strong influence to this interrelationship appear very weak. Support to the SSI’s and control over the LSI’s conducted by the
Indonesian government is different with that of the developed countries. The developed countries
issued many regulations to control business monopoly and monitored closely by public. The
regulation even has been issued by the US in 1900, while in Indonesia the same regulation is issued
in 2003 (known as KPPU). Statistical test points out that the coordination conducted by government
to all economic agents in Indonesia was not effective.
In regard to the interrelationship, Indonesia has a strong basic resource viewed from its uniquiness.
It comes from 17,508 islands and more than 300 etnic communities that can not be found anywhere
else in the world. Those uniquiness can be processed and packaged by the SSI’s and MSI’s becoming
a product that can be sold in the form of tourism industry. The raw material and experts should not
be imported since is available from nature and culture anywhere in the region of Indonesia. Tourism
industry would create the demand for the products of both the small and the large one and that would be operated in an efficient condition.
REFERENCES
Anderson, M. and Sohal, A.S. (1996), “A study of the relationship between quality management
practices and performances in small business”,International Journal of Quality & Reliability Management, Vol. 16 No. 9, : 859-877.
Adam, Everett E.; Ebert, Ronald J. (1992), “Production and Operations Management: Concepts, Modul, and Behavior”, Fifth Edition, Prentice-Hall International Edition.
Conover, W.J. (1980), “Practical Non-parametric Statistics”, Second Edition, Texas Tech University, John Willey and Sons.
Ermakov, Victor, (1998),“Government Policy for Small and Medium Enterprises in the Russian
Federation”, An International Journal, No.3, Volume 6.
Foley K., Barton, R., Busteed, J and Sprouster, J, (1997), “Quality, Productivity and Competitiveness: The Role of Quality in Australia’s Social and Economic Development”, Wider Quality Movement Standard Australia, Strathfield.
Forker, L.,Mendez, D.,and Hershouer, I. (1997), “Total Quality Management in the Supply Chain: what is its impact on Performance?”, International Journal of Production Research, Vol 35 No 6, : 681-701.
Fiegenbaum, A.V. (1991), “Total Quality Control”, Third Edition, Mc.Graw-Hill, New-York.
Decision-Making Approach,” Third Edition, Dryden.
Heizer, Jay; Render, Barry, (1991), “Production and Operations Management”, Second Edition, Allyn and Bacon.
Hubner, Dahuta, (1998), “Institutional Support for Small Business in Poland : Lesson for Central and East European Countries”, An International Journal, No.3, Volume 6.
Ishikawa K., “What is Total Quality Control : The Japanese Way”, Prentice Hall, Englewood Cliff,
USA.
Juran, JM, (1980), “Quality Planning and Analysis”, Second Edition, Mc. Graw-Hill, New-York.
Kagami, Mitsuro, (1998), “Strategies for Competitiveness in Production : an East Asian Approach”,
An International Journal, No.1, Volume 6.
Kume, Hitoshi, (1985), “Statistical Methods for Quality Improvement”, The association for Overseas Technical Scholarship, Tokyo.
Lummus, Rhonda R.; Vokurka, Robert J.; Krumwiede, Dennis, (2005), “Improving Manufacturing:
The Enduring Vakue of Jit and TQM”, Some Managemen Journal.
Mirer, Thad W., (1083), ”Economic Statistics and Econometrics”, Macmillan Publishing Co., Inc.,
New York.
Musselman, Vernon A.; Hughes, Eugene H., (1981), “Introduction to Modern Business : Issue and Environment”, Eight Edition, Prentice-Hall.
Paramita, Budhi, (1977), “Organizational Structure in Indonesia”, Lembaga Penerbit FEUI.
Ritzman; Krajewski, (1990), “Operations Management: Strategy and Analysis”, Second Edition, Eddison-Wesley Publishing Company.
Reed, R., Lemark, D.J., and Mero, N.P. (2000), “Total Quality Management and Sustainable Competitive Advantage”, Journal of Quality Management, Vol.5 : 5-26.
Sing, Prakash J.; Smith, Alan F.R, (2004), “Relationship between TQM and innovation: an Empirical
Study”, Journal of manufacturing Technology Management, Vol.15, No 5 : 394-401. Sila, I., and Ebrahimpour, M., (2002), “An Isvestigation of Total Quality Management Survey Based
Research Published between 1989-2000: A Literatur Review’, International Journal of Quality & Reliability Management, Vol.19 No.7 : .902-970.
Samson, D., and Terziovski, M., (1999), “The Relationship between Total Quality Management
Practices and Operational Performance”, Journal of Operational Management, Vol 17 No. 4 : 393-409.
Schroeder, Roger G., (1993), “Operation Management : Decision Making in the Operation Function”,
Fourth Edition, Mc.Graw-Hill, New-York.
Soeharto Prawirokusumo; Johnson Tampubolon, (1992), “Perundang-undangan Untuk Usaha Kecil : the Low of the SSI in Indonesia”, Trade Department of Indonesia.
Thompson, James D., (1967), “Organizations in Action : Social Science bases of Administrative Theory”, Mc Graw-hill Book Company, London.