Vol. 7 No. 1, p 41 – 49 [email protected] ISSN: 1412-0070
*corresponding author: www.unklab.ac.id
Performance of State Banks in Indonesia: An Application of the
Three
–
Stage Banking Models
Marthen Sengkey*
Fakultas Ekonomi Universitas Klabat
The study employs the three-stage banking models to investigate the performance of 26 state banks in Indonesia from 1994 to 2004: Data envelopment analysis (DEA) results indicate that the average efficiency of state banks was' 38.3 percent and deteriorated when the financial crisis struck Indonesia in 1997. Using stochastic frontier analysis (SFA) method, findings suggest that, on average, banks obtained 62.8 percent efflciency. Findings also suggest that banks' technical inefficiency is affected significantly by government intervention, location and ownership. Finally, state banking performance was tested by correlating the DEA - and SFA models, and found no statistically significant correlation. Reported new findings of this paper are additions to banking efficiency literature.
Key words: DEA , state banks, Indonesia, performance, SFA
INTRODUCTION
Over the past two decades, the measurement of financial institution's efficiency using nonparametric frontier models has received considerable attention. Most of studies utilized data envelopment analysis (DEA) to measure bank's efficiency: see Athanassopoulos (1998), Zenios et al. (1999), Stoberck (1999), Jermic and Vujcic (2002), Chien (2004); Krishnasamy et al. (2004). Furthermore, the previous studies dealt mainly with financial indicators as their performance measures. Moreover, in economic and management literature, the performance of the financial institutions was examined separately using financial ratios, data envelopment analysis (DEA), and the stochastic frontier analysis, (SFA). Studies that combined two (2) of these three (3) models are rare, therefore, leaving the issue of linkages between these models in examining the financial institutions largely unanswered.
To examine the correlation of the results between DEA and SFA approaches, the Spearman rank correlation is used as a statistic tool. The combination of these two well-known methods for banking performance, supplemented by statistical approach in one study, is a gap in the existing banking literature. This is the first study to apply these combined general performance measurements on state-owned banks, Particularly in Indonesia. The purpose of this paper is to demonstrate the application of DEA and SFA in. evaluating the performance of regional development banks in Indonesia. In the remainder of the paper, a brief overview of the banking system in Indonesia is discussed in Section 2, DEA and SFA data and variables analysis are discussed in the methodology section 3, the empirical results in section 4, and finally the conclusion and future research in section 5.
Overview of the Banking System in Indonesia.
The Indonesian authorities give responsibility to the regional government a. flexibility to manage their own
wealth and potential resources to improve their income per capita and to" support the gross national product income. Based on the Law No. 19, 1960 (W No. 19 Prp tahun 11960) about the state company especially
banks, the central government releases it to the local government to operate without intervention by the central government in terms of improving the regional productivity and to manage the operation of their banks. Banks here means regional development banks (BPD), which are owned by the regional government. 13PA was established based on the Law No. 13, 1962, which stipulated the establishment of regional development bank in each province in Indonesia, serving as an intermediator to the investors in that area.
Indonesia's financial system stability relies heavily on the banking industry, covering of about 90 percent of total asset of the country's financial system. Indonesia's banking system is dominated by 13 large banks, including ten (10) recapitalization banks, which represent 74.8 percent of the total assets of banking industry. Therefore, ensuring the soundness of these large banks is the key in maintaining stability of banking, system and financial system (BI 2002).
Before the 1997 crisis, Indonesia evolved into five stages: (1) the rehabilitation period (1967-1973) to restore the economy from high inflation; (2) the ceiling period (1974-1983) where interest rates ceiling were applied; (3) the growth period (1983-1988) following banking deregulation of June 1983 removed the interest rate ceiling; (4) the acceleration period (1988-1991) following the impact of extensive bank reforms in October 1988; and (5) the consolidation (1991-1997) in which prudential banking principles were introduced including capital adequacy and bank ratings (Djiwandono, 1997; Batunanggar, 2002).
After the 1997 crisis, on November 16, 1997, the bank authority of Indonesia liquidated 16 private banks as the 1St round closures. In April 1998, ten (10) private banks were frozen (BBO) for the 2nd round
closures. For the 3`d round closures on March 13, 1999, 38 private banks were frozen. Other strategies made by the bank authority are bank take over and recapitalization. On April 4, 1998, seven (7) private banks had taken over (BTO) and on May 29, 1998, one (1) private bank had taken over for the I st round of take over. For the 2nd and 3`d rounds of take over on
private banks and two (2) private banks had been taken over .
Recapitalization for private banks accrued on April 21, 1999 and March 2000 for the 1st and the 4th rounds, where seven (7) and three (3) banks had been recapitalized, respectively. There were 12 regional development banks and four (4) state banks that had been recapitalized (BI, 2000). To date, Indonesia have 26 Regional Development Banks and are located in the capital city of each province. During the resolution of banking crisis, there are 12 out of 26 regional development banks that received injection of capital from the bank's authority. Fourteen (14) banks grouped in A category with CAR greater than 4 percent, eight (8) banks grouped in B category with CAR greater than negative twenty five percent but less then four percent (-25% <CAR< 4%), and the rest four (4) banks be categorized in level C with CAR less than -25 percent (BI, 2002). simultaneously, regardless of whether all the variables of interest are measured in common units (Sexton, 1986). DEA was originally introduced by Charnes et al. (1978) and is a non-parametric linear programming approach, capable of handling multiple inputs as well as multiple outputs. According to Kruger (2003), DEA is a local method in that calculates the distance to the frontier function through a direct comparison with only those observations in the samples that are most similar to the observation for which the inefficiency is to be determined.
Due to the consequence of the heavy intervention by the government in banking system in Indonesia as mentioned earlier, bankers may well have been prevented from operating at the optimal level in their operation. Therefore, technical efficiency in this study is calculated using the input-oriented variable returns to scale (VRS) DEA model. The envelopment form of the input-oriented of constant returns to scale (CRS) and VRS DEA model is specified as:
- each bank to the target or peer, y is the out put variable (loan) and x is the input variables (deposit, total expenses, fixed assets, and capital). The efficiency score will satisfy if the value of θ is less and equal than one.
Slacks. The piece-wise linear form of the non-parametric frontier in DEA can cause a few difficulties in efficiency measurement. The problem arises because of the sections of the piece-wise linear frontier which run parallel to the axes, which do not occur in most parametric functions (Coelli et al., 1998). Some authors argue that both the Farrell measure of technical efficiency (θ) and any non-zero input or output slacks should be reported to provide an accurate indication of technical efficiency of a firm in DEA major problems associated with the second stage linear programming (LP). The first and most obvious problem is that the sum of the slacks is maximized rather than minimized. Hence, it identifies not the nearest efficient point but the furthest efficient point. The second major problem associated with the second
– stage approach is that is not invariant to unit of measurement. To avoid the two problems above the multi-stage DEA method was used. Coelli, et al. (1998) stated that the multi-stage method involves a sequence of radial DEA models and hence is more computationally demanding that the first-stage and second-stage methods. However, the benefits of the approach are that it identifies efficient projected points which have input and output mixes as similar as possible to those of inefficient points, and that it also invariant to units of measurement. For a detailed explanation, see Coelli, et al., 1998.
Cobb-Douglas Stochastic Frontier Production.
SFA posits a composed error model where in efficiencies are assumed to follow an asymmetric distribution, usually the half-normal, while random errors follow a symmetric distribution, usually the standard normal (Berger et al., 1997). The following inputs minimization stochastic frontier model can be run:
( )
(4)
* , ( )-+ (5)
where yit denotes the output for the ith bank at tth
time period; xit denotes a (I *K) vector ovalue of inputs
and other appropriate variables associated with a suitable functional form (e.g., the Cobb-Douglas
model); β i a (K* 1) vec or of unknown calar
parameters to be estimated; the vits are random errors;
the uits are the technical inefficiency effect in the
model (Coelli, et al. 1998). In this study, uit is other
environmental variable that is not included in the input or output variables, which influence the result of technical efficiency score.
To evaluate the effects of government intervention, ownership, location and ABC classification described by the Central Bank of Indonesia, of the Indonesia's regional development banks on technical inefficiency, the uits are
technical inefficiency term. This random error variables capture the effect of external factors of production that are beyond the bank's control, i.e. government intervention, ownership, location and ABC classification of CAR prescribed by Central Bank of Indonesia represents the technical inefficiency term. Where u it is defined mathematically as:
(6)
where: z1it = represents the government intervention i
- th in the t -th year of observation; observation includes the government intervention. The computer program software known as Frontier 4.1 (Coelli, 1996) was used to find maximum likelihood estimates of a subset of the stochastic frontier production functions.
Spearman Rank Correlation Coefficient.
Spearman ranks correlation coefficient is used to assess the correlation between DEA the non parametric approach and SFA the parametric analysis. Webster (1992) stated that Spearman's rank correlation coefficient is used to assesses how well an arbitrary monotonic function could describe the relationship between two variables, without making any assumptions like in Pearson product-moment correlation coefficient (Pearson r). The value of correlation coefficient falls between -1 and 1, where the negative sign indicates that there is a negative correlation between the variables and positive sign indicates that there is a positive correlation between
Where: di is the difference between the rankings for each observation and n is the sample size of the observation (Webster, 1992). The quantity rs called the linear correlation coefficient, measures the strength and the direction of a linear relationship between the pairs of data. The value of rs is such that -1 ≤ rs≤ +1.
The + and – signs are used for positive linear correlations and negative linear correlations, respectively.
DATA AND VARIABLES
Data. This study uses a panel data set of 26 regional development banks in Indonesia from 1994 to 2004. The sample included all the regional development banks, owned by 26 provinces in Indonesia. The time period from 1994 to 2004 was selected based on the availability and completeness of the data for the audited financial reports. Regional
development banks are chosen because during the resolution of banking crisis, there are 12 regional development banks, which are recapitalized by bank authority. None of these banks is liquidated or taken over, though, some of these banks have CAR less than CAR of bank, which are liquidated and taken over. For example, a Regional Development Bank has CAR of -23.1 percent has not liquidated or taken over, compared with to the liquidated and taken over banks, which have CAR of -10.9 percent and -15.6 percent, respectively.
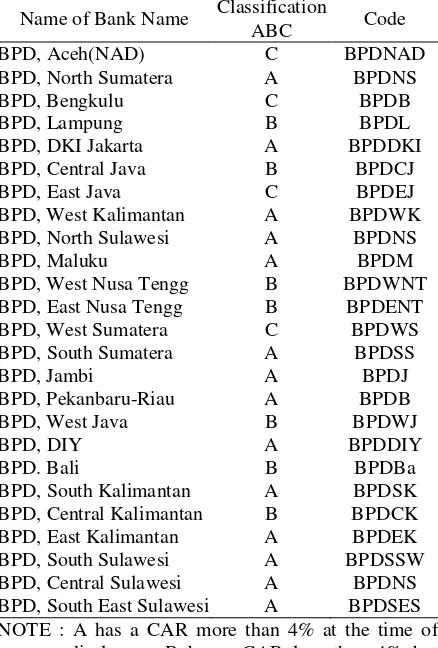
Table 1. Sample of Banks
Name of Bank Name Classification
ABC Code
BPD, Pekanbaru-Riau A BPDB BPD, West Java B BPDWJ
BPD, DIY A BPDDIY
BPD. Bali B BPDBa
BPD, South Kalimantan A BPDSK BPD, Central Kalimantan B BPDCK BPD, East Kalimantan A BPDEK BPD, South Sulawesi A BPDSSW BPD, Central Sulawesi A BPDNS BPD, South East Sulawesi A BPDSES NOTE : A has a CAR more than 4% at the time of
disclosure. B has a CAR less than 4% but greater than — 25% at the time of disclosure. C has a CAR less than — 25% at the time of disclosure.
financial intermediaries, banks' primary fimction is to borrow funds from depositors and lend these funds to others for profit (Colwell and Davis, 1992). From this perspective, deposits are "inputs" and loans are
"outputs." Furthermore, in addition to inputs and outputs, the study also has included the exogenous variables, that is, dummy variables in the SFA model. Dummy variables (Z) are government intervention, ownership, location of banks and ABC classification
prescribed by the Central Bank of Indonesia.
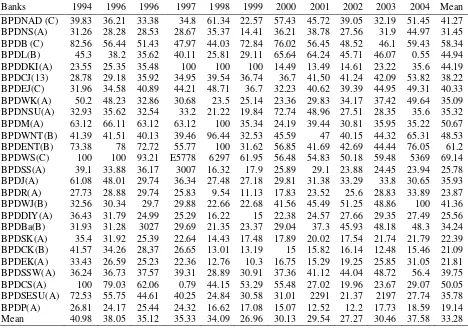
Empirical Results. DEA – Multistage (Input-Oriented VRS Model. The result of this study reveals that bank, which has the highest efficiency estimate score among the 26 banks is BPDWS, with a 69.14 percent, which means BPDWS could possibly reduce the usage of all inputs (deposit, operating expenses, capital and fixed asset) by 30.86 percent (1-0.6914) without reducing the current output. Trends of the efficiency score of BPDWS as follows: in 1994 and 1995 this bank had an efficiencyscore of 100 percent, which means that it did not incur input excesses. Even though, it showed a decline from 93.21 percent in 1996 to 53.7 percent in 2004, this bank still posted the
highest efficiency performance for the entire evaluation period.
BPDDKI posted an efficiency score of 100 percent from 1997 to 1998, however, this bank occupied the eighth rank in terms of efficiency estimate score due to its very low efficiency scores of 28.17 percent (1994-1996) and 27.35 percent (1997 - 2004). The banks that have the second and third ranks with a higher efficiency estimate score are BPDENT and BPDB with scores of 61.20 percent and 58.34 percent, respectively. Furthermore, there are only 46.2 percent among the 26 banks that have the efficiency score above the average mean of 38.3 percent.
Table 2.Summary of Efficiency Score (%) of Regional Development Banks in Indonesia for the Period (1994-2004)
Banks 1994 1996 1996 1997 1998 1999 2000 2001 2002 2003 2004 Mean BPDNAD (C) 39.83 36.21 33.38 34.8 61.34 22.57 57.43 45.72 39.05 32.19 51.45 41.27 BPDNS(A) 31.26 28.28 28.53 28.67 35.37 14.41 36.21 38.78 27.56 31.9 44.97 31.45 BPDB (C) 82.56 56.44 51.43 47.97 44.03 72.84 76.02 56.45 48.52 46.1 59.43 58.34 BPDL(B) 45.3 38.2 35.62 40.11 25.81 29.11 65.64 64.24 45.71 46.07 0.55 44.94 BPDDKI(A) 23.55 25.35 35.48 100 100 100 14.49 13.49 14.61 23.22 35.6 44.19 BPDCJ(13) 28.78 29.18 35.92 34.95 39.54 36.74 36.7 41,50 41.24 42.09 53.82 38.22 BPDEJ(C) 31.96 34.58 40.89 44.21 48.71 36.7 32.23 40.62 39.39 44.95 49.31 40.33 BPDWK(A) 50.2 48.23 32.86 30.68 23.5 25.14 23.36 29.83 34.17 37.42 49.64 35.09 BPDNSU(A) 32.93 35.62 32.54 33.2 21.22 19.84 72.74 48.96 27.51 28.35 35.6 35.32 BPDM(A) 63.12 66.11 63.12 63.12 100 35.34 24.19 39.44 30.81 35.95 35.22 50.67 BPDWNT(B) 41.39 41.51 40.13 39.46 96.44 32.53 45.59 47 40.15 44.32 65.31 48.53 BPDENT(B) 73.38 78 72.72 55.77 100 31.62 56.85 41.69 42.69 44.44 76.05 61.2 BPDWS(C) 100 100 93.21 E5778 6297 61.95 56.48 54.83 50.18 59.48 5369 69.14 BPDSS(A) 39.1 33.88 36.17 3007 16.32 17.9 25.89 29.1 23.88 24.45 23.94 25.78 BPDJ(A) 61.08 48.01 29.74 36.34 27.48 27.18 29.81 31.38 33.29 33.8 30.65 35.93 BPDR(A) 27.73 28.88 29.74 25.83 9.54 11.13 17.83 23.52 25.6 28.83 33.89 23.87 BPDWJ(B) 32.56 30.34 29.7 29.88 22.66 22.68 41.56 45.49 51.25 48.86 100 41.36 BPDDIY(A) 36.43 31.79 24.99 25.29 16.22 15 22.38 24.57 27.66 29.35 27.49 25.56 BPDBa(B) 31.93 31.28 3027 29.69 21.35 23.37 29.04 37.3 45.93 48.18 48.3 34.24 BPDSK(A) 35.4 31.92 25.39 22.64 14.43 17.48 17.89 20.02 17.54 21.74 21.79 22.39 BPDCK(B) 41.57 34.26 28,37 26.65 13.01 13.19 15 15.82 16.14 12.48 15.46 21.09 BPDEK(A) 33.43 26.59 25.23 22.36 12.76 10.3 16.75 15.29 19.25 25.85 31.05 21.81 BPDSSW(A) 36.24 36.73 37.57 39.31 28.89 30.91 37.36 41.12 44.04 48.72 56.4 39.75 BPDCS(A) 100 79.03 62.06 0.79 44.15 53.29 55.48 27.02 19.96 23.67 29.07 50.05 BPDSESU(A) 72.53 55.75 44.61 40.25 24.84 30.58 31.01 2291 21.37 2197 27.74 35.78 BPDP(A) 26.81 24.17 25.44 24.32 16.62 17.08 15.07 12.52 12.2 17.73 18.59 19.14 Mean 40.98 38.05 35.12 35.33 34.09 26.96 30.13 29.54 27.27 30.46 37.58 33.28
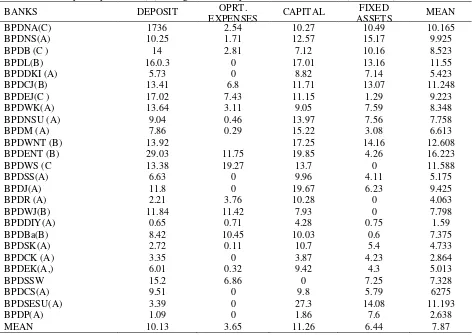
Input Slacks. In terms of deposit as an input, all banks incurred input slacks. Banks with a higher input slack have a lower efficiency performance. The result shows that the most inefficient bank is BPDENT, with the highest deposit slack of 29.03 percent. Otherwise, bank which has the lowest slack of deposit is BPDIY. Analytically, this bank needs only to reduce its deposit of 0.65 percent to be a 100 percent efficient.
The second input is operating expenses. This study found that there are eight (8) banks that do not need to reduce their operating expenses due to zero slack result. Those banks are the following: BPDL,
percent, and BPDJ of 19.67 percent.
The last input variable is fixed asset. There are two (2) banks that posted zero slack. Those banks are the following: BPDR and BPDWJ. BPDR occupied the third rank with the lowest slack in terms of deposit,
I
1 th rank in terms of operating expense slacks, and the
14th rank in terms of capital slacks. While BPDWJ has the 16th rank in terms of deposit slacks, the eighth (8th) rank in the highest slack in terms of operating expenses, and the sixth (6th) rank in the lowest slack in terms of capital. By using the DEA approach, the result shows that no bank in the sample has a consistent efficiency performance in terms of efficiency or inefficiency score.
The result of the DEA shows that, on average, the highest slacks of all input variables were posted by
BPDENT (12.68 percent) while the lowest slacks were posted by BPDIY (1.59 percent). BPDIY has managed to utilize efficiently its deposit, operating expenses, capital, and fixed assets to the production of loans (as an output): it calls fora reduction of all inputs by 1.59 percent only to become efficient. Furthermore, results imply that BPDENT needs to reduce 12.68 percent, on average, its input variables (deposit, operating expenses, capital, and fixed assets) to become efficient. However, the result shows that none of the banks incurred output slack, because the output slacks of all banks are zero. Thus, the presence of input slacks in deposit, operating expenses, capital and fixed assets did not effect to produce the loan as an output.
Table 3.Summary of Input Slacks (%) of Regional Development Banks in Indonesia (1994-2004)
BANKS DEPOSIT OPRT.
EXPENSES CAPITAL
FIXED
ASSETS MEAN
BPDNA(C) 1736 2.54 10.27 10.49 10.165
BPDNS(A) 10.25 1.71 12.57 15.17 9.925
BPDB (C ) 14 2.81 7.12 10.16 8.523
BPDL(B) 16.0.3 0 17.01 13.16 11.55
BPDDKI (A) 5.73 0 8.82 7.14 5.423
BPDCJ(B) 13.41 6.8 11.71 13.07 11.248
BPDEJ(C ) 17.02 7.43 11.15 1.29 9.223
BPDWK(A) 13.64 3.11 9.05 7.59 8.348
BPDNSU (A) 9.04 0.46 13.97 7.56 7.758
BPDM (A) 7.86 0.29 15.22 3.08 6.613
BPDWNT (B) 13.92 17.25 14.16 12.608
BPDENT (B) 29.03 11.75 19.85 4.26 16.223
BPDWS (C 13.38 19.27 13.7 0 11.588
BPDSS(A) 6.63 0 9.96 4.11 5.175
BPDJ(A) 11.8 0 19.67 6.23 9.425
BPDR (A) 2.21 3.76 10.28 0 4.063
BPDWJ(B) 11.84 11.42 7.93 0 7.798
BPDDIY(A) 0.65 0.71 4.28 0.75 1.59
BPDBa(B) 8.42 10.45 10.03 0.6 7.375
BPDSK(A) 2.72 0.11 10.7 5.4 4.733
BPDCK (A) 3.35 0 3.87 4.23 2.864
BPDEK(A,) 6.01 0.32 9.42 4.3 5.013
BPDSSW 15.2 6.86 0 7.25 7.328
BPDCS(A) 9.51 0 9.8 5.79 6275
BPDSESU(A) 3.39 0 27.3 14.08 11.193
BPDP(A) 1.09 0 1.86 7.6 2.638
MEAN 10.13 3.65 11.26 6.44 7.87
Stochastic Frontier Analysis. The Stochastic Frontier Analysis is used to examine the relationship between bank loans (output) and the following input variables: deposit, operational expenses, capital, and fixed assets. Moreover, it was used to test whether there is technical inefficiency effects to the production process on banks output of loan by the following firm's specific and environment variables: (1) government intervention, (2) ownership, (3) location, (4) ABC classification described by Central Bank of Indonesia.
Cobb-Douglas Stochastic Frontier Production. The Cobb-Douglas function is chosen over the
by the Central Bank of Indonesia.
The beta parameters indicate the association between banks' technical efficiency (TE) with the inputs variables of deposit, operating expenses, capital and fixed assets. This study found the constant estimated coefficient of input variables has a positive sign and statistically significant indicating that in general, there are fixed efficiency increase when banks used deposit, operating expenses, capital, and fixed assets to produce loan. The estimated coefficient of bank's deposit, operating expenses, and fixed assets have a positive sign and statistically significant indicating that the use of more deposits, operating expenses, and fixed assets increased significantly the efficiency of the banks to produce loan. It is consistent with the function of bank as intermediation, where bank collects fund from surplus side as a depositor and then invest that fund as a loan or other types of investment to get more earnings.
The operating expenses have a significant positive influence to the efficiency of the bank. This
result reveals that each dollar spends by the banks can increase its efficiency. It is contradiction with the theory that the higher operating expenses, the lower the operating income. Whereas, the result of this study shows that banks' capital has a significant negative relationship with the bank efficiency. It implies that less use of capital in bank's operation increases significantly the technical efficiency of the banks to produce loan. It contradicts with the requirement of the bank authorities of Indonesia, that increased loan should be back-up with the adequate capital to prevent bank failure. Finally, fixed asset in the efficiency function shows a significant positive relationship with the efficiency of banks to produce loan. It indicates that, the bank's productivity increases significantly when more fixed assets are utilized as an input. The result of this study is consistent with the theory, that the key profitability ratios in banking today are ROE and ROA. Finally, there are 54 percent among the 26 banks that have the estimate efficiency score above the average mean of 62.8 percent.
Note: * significant at 0.05
LR test of the one-sided error = 0.62945107E+02, with number of restrictions =6 (this statistic has a mixed chi-square distribution, number of iterations = 26(maximum number of iterations set at: 100, number of cross-sections = 26 number of time periods = 11, and tota number of observations = 286 The t-ratio, which is set at 5% level, with a critical value of 1.645 (see t- distribution table)
Furthermore, this study found that in general bank's technical inefficiency is affected by those four (4) environmental variables. The effect is negative and significant at 5 percent probability level. The government intervention to the banks has a significant negative effect on its technical inefficiency. The negative sign indicates that those banks without funds received from the bank authority are more technically efficient than those banks that received funds. This finding is in contradiction to the purpose of the government that by injecting funds, bank can improve their performance. A bank's roles and size are not the only determinants of how it is organized or how well it performs. Government regulation also has played a major role in shaping the needs and diversity of banking organizations that operates around the globe (Rose, 1996). Furthermore, the estimate coefficient in connection with ownership has the negative sign and significant at 5 percent probability level. This means that ownership has a statistically significant effect on technical inefficiency. The negative sign suggests that banks with less than 50 percent ownership are technically efficient.
The ownership consists of central government, province government, municipal government and others. Fifty (50) percent ownership means a bank is owned by the province government. The banks that have less than 50 percent ownership are technically efficient compared with banks that have a percentage of more than 50 percent ownership. The result indicates that the increase in the percentage of ownership decreases the efficiency of the bank. The result is consistent with some articles, that the ownership of the financial institutions has the influence over the productivity of the organization. Fama. and Jensen (1985), and Mayers and Smith (1986, 1988) argue that firms with alternative ownership structures are different in their operations and particularly in their cost of productions. Moreover, the estimated coefficient of location is negative and
statistically significant at 5 percent level. It indicates that those banks that located outside West Region of Indonesia are more technically efficient. Moreover, the result shows that the estimate for the 7 -parameter is close to unity (.98); that is very high, meaning that much of the variation in the composite error term is due to the inefficiency component (Coelli, 2005). Thus, result indicates that the technical inefficiency effect has a significant impact on bank loans.
The average technical efficiency of 62.42 percent is obtained using the estimated stochastic Cobb Douglas model. It indicates that on average, banks produce 62.42 percent of loans that could be produced theoretically with the combinations of inputs (deposit, operating expenses, capital and fixed assets) by a technically efficient bank. Moreover, it implies that the regional development banks have to increase their loans by 37.58 percent to be 100 percent efficient.
The Correlation between DEA and SFA Efficiency Results. The Spearman rank correlation coefficient (Rank) is used to determine whether there is
a significant difference between DEA efficiency rank and SFA efficiency rank (Berger and Humphrey, 1997). They stated that some studies found significant different relationship between the findings of different techniques, while others find strong relationships. The test of independent sample, paired sample, and Spearman rank correlation are computed through Statistical Program for Social Sciences (SPSS) version 11.5.
The study found that the correlation between SFA and DEA is r 0.242. Using the two-tailed test at 0.05 level, the result shows that there is no significant rank correlation between SFA and DEA. The result of this study is still consistent with the result of study by Bauer et al. (1998) when they evaluated the performance of 683 US banks over the 12-period 19771988. They found that the average rank-order correlations between the parametric and non parametric methods is only 0.098. Moreover, some ariable Parameter Coefficient T-ratio
Part A: Frontier function
Constant β0 12.1173 189.82I99
*
Ln (Deposit) β1 0.14549948E-06 1.7387*
Operating Expenses β2 0.52035317E-05 9.8764*
Capital β3 -0.14759086E-06
-20305891*
Fixed Assets β4 0.73013060E-05 3.99605*
Part B: Inefficiency model
Constant δ0 -5.0376 -2.9983*
Government intervention Δ1 -14.4212 -33167*
Ownership δ2 -5.0376 29984*
Location δ3 -1.2474 29558*
ABC classification δ4 -1.2468 -15349
Part C: Variance parameter
–
σ2
γ 0.9800 10.9959
3.9135* 144.7125 Log-likelihood ratio
Total No of Observations
286 0.6242
studies suchFerrier and Lovel (1990), Eisenbeis, Ferrier and Kwan (1997), and Resti (1997) were compared the DEA and SFA approaches. They found that fairly close average efficiencies generated by two approaches.
Table 5. Spearman Rank Correlation Coefficient between SFA and DEA percent to 69.14 percent. From this approach, BPDWS is the most efficient with the highest average estimate efficiency level. score of 69.14 percent and has the lowest average input inefficiency of 30.86 percent. On the other hand, BPDP has the lowest average efficiency score, which is 19.14 percent with the highest average input inefficiency of 80.86 percent. In general, the efficiency scores of all banks showed a decline when the financial crisis struck the Asian region in 1997.
Another significant contribution of DEA model is a possible explicit determination of bank's excesses in input resources and also output deterioration for the first time in Indonesian development banks. Among four input variables, capital has the highest average input slack of 11.26 percent followed by deposit, fixed assets and total operating expenses with the average input slacks of 10.13 percent, 6.44 percent, and 3.65 percent, respectively. For the capital variable, BPDSES has the highest input slack of 27.30 percent that calls fora reduction of 27.30 percent of the capital used without reducing the output. Overall, bank that has the highest weighted mean of the input slack for all variables is BPDENT, with the mean value of 16.223 percent. On the other hand, bank with the lowest weighted mean of the input slack for all variables is BPDIY, with the value of 1.59 percent.
SFA findings suggest that those banks, which did not receive funds, from the bank authority are more efficient than those banks that received funds. Likewise, banks that are owned less than 50 percent by the province government, located outside West of Indonesia, and classified as BC level in terms of CAR are more efficient as well. Moreover, the more used of deposit, total operating expenses and fixed asset increased the efficiency of the banks performance. Otherwise, the more use of capital as an input reduces the efficiency performance of the banks. Statistically, the study found that there is no significant rank correlation between the parametric (SFA) and non-
parametric (DEA) models. The result of this study affirmed the results obtained by Bauer et al, (1998), Ferrier and Lovel (1990), Eisenbeis, Ferrier and Iowan (1997) and Resti (1997) for the banking performance in other parts of the world.
The new evidence found in the Indonesian regional banks is another new empirical contribution to the banking efficiency literature. New original findings of this study can also provide a starting point for further investigation on performance, efficiency and productivity for other banks or industries by using different models of DEA and SFA, and results will be further validated by the aid of other statistical tools aside from tests used in this study. Significantly, results of this study contribute significantly to theoretical modeling of performance (efficiency and productivity) extensively in the banking sector as evident in the Indonesian state banks.
REFERENCES
Athanassopoulos, Antreas D.(1998). Nonparametric frontier models for assessing the market and cost efficiency of large-scale bank branchNetworks. Journal of Money, Credit, and Banking. 30 (2), 172-192
Batunaggar S., (2002). Indonesian Banking Crisis Resolution. Lessons andThe Way Forward, Banking Crisis Resolution Conference, CCBS,Bank of England, London 9 December 2002
Bauer, P. W., A. N. Berger, G. D. Ferrier, and D. B. Humphrey. (1997).Consistency conditions for regulatory analysis of financialinstitutions: A comparison of frontier efficiency methods. Workingpaper 02-97, Federal Reserve Financial Services, Washington, DC.
Berger, Allen N and Humphrey, David. (1997). Efficiency of financialinstitutions: international survey and directions for future research.European Operational Research. 98,175-212.
Charnes, A.; Cooper, W. W.; and Rhodes, E. (1978). Measuring the efficiency of decision making units. European Journal of Operational Research. 2, (6), 429-444.
Chien-Ta Ho' Dauw-Song Zhu. (2004). Performance
measurement of Taiwan's commercial banks. International Journal of Productivity and Performance Management. Bradforcl:- 53 (5/4425.
Coelli, T J. (1996a). A guide to FRONTIER version 4.1: a computer program for frontier production function estimation. CEPA Working Paper 96/07, Department of Econometrics, University of New England, Armidale, Australia.
Coelli, Tim., Rao, Prasada. D.S. and Battese, George E. (1998), An Introduction to Efficiency and Productivity Analysis. Kluwer Academic Publishers, Dordrecht.
Djiwandono, J. Soedradjat (1997) 'The Banking Sector in Emerging Markets: The Case of Indonesia' Bulletin of Indonesia Economic Studies.
Eisenbeis, R.A., Ferrier, G.D. and Kwan S. 1997. The Normativeness of Linear Programming andEconometric Efficiency Scores: An AnalysisUsingUS BankingData,Bureau of Business and Economic Research. University of Arkansas working paper.
Golany, B. and Storbect, J E. (1999). A data envelopment analysis of the operational efficiency of bank branches. Interfaces. Linthicum: May/Jun 1999.Vol.29, Iss. 3; pg. 14, 13.
Fama, Eugene F. and Jensen, M.C. (1985). Organizational forms and investment decisions. Journal of Financial Economics, 14, 101109.
Ferrier, Garry D. and C. A. Knox Lovell. (1990). Measuring Cost Efficiency in Banking: Econometric and Linear Programming Evidence. Journal of Econometrics. 46, 229-45.
Jermic, Igor and Vuicic, Boris (2002). Efficiency of banks in Croatia: A DEA approach, Comparative Economic Studies. Flushing: Summer 2002. Vol. 44, Iss. 213; pg-169, 25 pages.
Krishnasamy, Geeta., Alfieya Hanuum Ridzwa, Vignesen Perumal (2004). Malaysian Post Merger Banks' Productivity: Application of Malmquist Productivity. Managerial Finance. Patrington: 30(4), 63-75.
Kruger, Jean J. (2003). The global trends of factor
productivity: Evidence from the nonparametric Malmquist index approach Oxford: Apr. 2003. Vol. 55, Iss. 2; pg 265. Mayers, D. and Smith, Clifford W. Jr. (1988)."
Ownership Structure, Across Lines of Property-Casualty Insurance, " Journal of Law and Economics, 31, 2, 351-373
Resti, A. (1997). Evaluating the cost-efficiency of the Italian banking system: What can be learned from the joint application of parametric and non-parametric techniques. Journal of Banking and Finance. 21, 221-50.
Rose, Peter S. (1996). Commercial Bank Management, Third Edition, Irwin United State of America.
Sexton, T. R., Silkman, R. H., & Hogan, A.(1986). Data envelopment analysis: Critique and extensions. In R. H. Silkman (Ed.), Measuring efficiency: An assessment of data envelopment analysis. Publication no. 32 in the series New Directions of Program Evaluation, Jossey Bass, San Francisco. Sherman, H. D. and Ladino, G. 1995, "Managing
bank productivity using data envelopment analysis (DEA)," Interfaces, Vol. 25, No. 2, pp. 60-73.