27-28 November, 2017
at Thuyloi University, Vietnam
UGSAS-GU & Thuyloi University
–
The 5th International Workshop 2017
–
Recent Progress in Agriculture and Water Management in Asia
–
Contents and Program of the 5th International Workshop 2017
Start
time
Session
Speaker/Chair Person
Title
Page
8:30
Registration
9:00
Session 1
Chair: Assoc. Prof. Onishi, T.,
Gifu U
Welcoming and Introductory Session
9:00
Prof. Senge, M., Dean of
UGSAS, Gifu U
Declaration of Opening
9:10
Prof. Nguyen Quang Kim,
Rector of TLU
Welcome Address
9:20
Prof. Hiramatsu, K., Adviser in
charge of International
Affairs, UGSAS, Gifu U
Internationalization activities in
UGSAS-GU
9:30
Assoc. Prof. Nguyen Canh
Thai, Vice Rector of TLU
[Keynote Speech]
Disaster management
and dam safety issues
Tea Break
10:20
Session 2
Chair: Assist. Prof. Noda, K.,
Gifu U
Scientific Presentation on Irrigation
Facilities
10:20
Assoc. Prof. Nishiyama, T.,
Gifu U
Analysis of the strength of rock
foundations for the safety of dams
1
10:35
Assoc. Prof. Nguyen Cao Don,
TLU
Discharged Flow from the Effluences of a
Thermal Power Plant
5
10:50
Mr. Chihara, E., Sanyu
Consultant
A study for Water Stops Installed Outside
of Galleries on Deformable Ground
9
11:05
Assoc. Prof. Nguyen Thu Hien,
TLU
A Study on the Operation Procedure of
South Nghe An Hydraulic System for
Irrigation under Water Shortage
Conditions
13
11:20
Assoc. Prof. Onishi, T., Gifu U
How the water distribution pattern to
paddy plots will change by an adjustment
of weir height - trial simulation
–
17
11:35
Q&A
12:00
Photo Session
and Lunch Break
Date: Nov 27th- 28th 2017
Venue: Room 5, K1 Building - Thuyloi University (TLU)
Address: 175 Tay Son Str, Dong Da District, Hanoi, Vietnam
Start
time
Session
Speaker/Chair Person
Title
Page
13:30
Session 3
Chair: Assoc. Prof. Don, TLU
Scientific Presentations by Students and
alumni of IC-GU12
13:30
Mr. Tran Duy Quan, Gifu U&
Thuyloi U, PhD student
Research on cause of KE 2/20 REC dam
failure in Vietnam from view point of
hydraulic fracturing
19
Mr. Muto, K., Gifu U, MS
student
Characteristics of denitrification in an
agricultural drainage channel
25
13:45
14:00
Ms. Dinh Lan Phuong, PhD
candidate of TLU
Alternate Wet and Dry irrigation
technique
–
an adaptable solution to
climate change for rice cultivation in the
Red River Delta, Vietnam
29
14:15
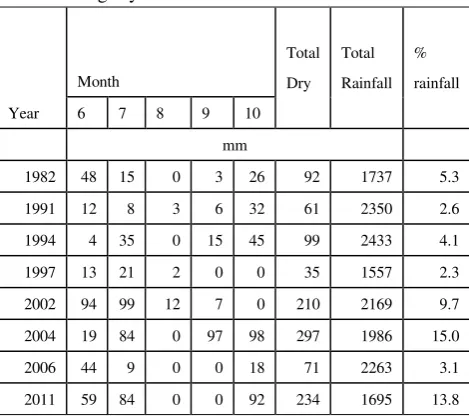
Dr. Afandi, Lampung U
Water Management along the Year -A
case Study in Pineapple Plantation under
humid tropical climate of
Indonesia-35
14:30
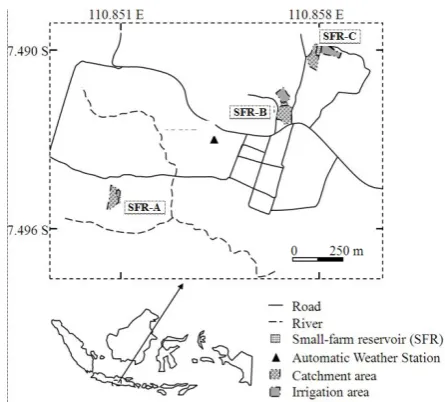
Prof. Dwi Priyo Ariyanto,
Sebelas Maret U
Sediment Trap using Small Farm
Reservoir in Rainfed
41
14:45
Q&A
15:10
Tea Break
15:30
Session 4
Chair: Assoc. Prof. Hien, TLU
Scientific Presentations on Water
Management and Agriculture
15:30
Assoc. Prof. Iida, T., The
University of Tokyo
[Keynote Speech]
Recent water
management technology of rice
cultivation in Japan and our future
research needs
45
16:00
Assis. Prof. Noda, K., Gifu U
Co-design of adaptation to Climate
Change with the current strategy in the
water management sector in Thailand
–
A
concept for multi-criteria
analysis-47
16:15
Dr. Nguyen T. Hang Nga (TLU)
Energy use efficiency of integrated
rice-duck farming in a selective area of Ha
Nam province, Northern Viet Nam
49
16:00
Prof. Shakil Uddin Ahmed,
Dhaka U
The effect of Deficit Irrigation on
Root/Shoot ratio, Water Use Efficiency
and Yield Efficiency of Soybean
57
16:45
Q&A
17:10
Prof. Nakano, K., Vice Dean of
UGSAS
Closing
18:00
MOC: Assoc. Prof. Nguyen
Canh Thai, TLU
Banquet
Analysis of the strength of rock foundations for the safety of dams
○Tatsuro NISHIYAMA
(Faculty of Applied Biological Sciences, Gifu University)
SUMMARY
In the present paper, the direct shear of rock masses was analyzed with a set of plaster model tests and a finite element analysis for the safety of dams. The plaster model tests simulated the direct shear tests which are actually carried out for in-situ rock masses in order to obtain the shear strength of dam foundations. Failures progressively occurred throughout the process of the tests. The cracking patterns depended upon the normal stress range; and therefore, the strength appeared in different ways according to the normal stress range. In the cases with macroscopic discontinuities, the strength of the discontinuities affected the shear strength much more than the strength of the material itself. Such strength was explained properly with the theoretical strength of the materials, including the weak planes. In the finite element analysis, the appearance and propagation of cracks were accurately obtained. As the next step, further progress in the stress analysis of direct shear is desired.
Introduction
Engineers who are engaged in the work of agricultural dams in Japan have recently encountered two new phenomena: the first is the appearance of damage to dams after their long-time use, and the second is severe damage to dams occurring after well-known huge earthquakes. Great efforts have of course been made to counteract these problems; however, there are many difficulties which cannot be treated sufficiently with the existing knowledge and techniques. Moreover, such difficulties are not always new. What is necessary for engineers now is not only to break new grounds, but also to make up for the problems which have remained unsolved for years. One of these problems is identifying the mechanisms of the direct shear of the materials, including rock masses.
The shear strength of the rock foundations of large dams was recognized after the famous Malpasset Dam Break in 1959. Since then, in-situ tests (International Society for Rock Mechanics (1974)) have been carried out at many dam sites to measure the shear strength of rock masses. Certainly, the resultant resistance has been measured and the results of such tests have been available for use in the design of dams.
However, the mechanisms of shear failure have not been explained, particularly according to the fundamental Mohr’s theory. To understand the strength that appears in the shearing process, the process must be solved theoretically. This is also important for interpreting the
cause of failures in actual cases.
This paper reports the results of experiments which were carried out to clarify the failure mechanisms and the results of the numerical analysis simulating the experiments.
Problems
Figure 1 shows diagrams of the in-situ tests used to obtain the strength of rock foundations. Firstly, a block is shaped for loading, and an inclined force is imposed on it incrementally under the desired constant normal force. Then, the block is forced to separate from the rock foundation. The resultant maximum tangential force per unit area, namely, the shear stress, on the base of the block which is treated as the anticipated shear plane, is regarded as the shear strength of the rock mass under consideration.
A failure like that in the above-mentioned tests, where the shear of a particular plane is forced, is called direct shear. With such a failure, the shear strength is related to the normal force per unit area, namely, the normal stress, and the relation is treated as a linear function which is known as the famous Coulomb’s criterion.
Coulomb’s criterion of the material, if both of them are appropriate for the material under consideration. However, it is known that Mohr’s envelopes for rocks and rock masses are curvilinear (Hoek (1983)).
In addition, Mohr’s envelopes show failure planes in a particular direction at any failure. Such failure planes offer good interpretations in cases under simple pressure, like in triaxial tests, which are often performed for geomaterials. However, such good interpretations cannot be obtained in cases of direct shear where the shear of a particular plane is forced because the directions of the simple compressional stress, namely, principal stress, are unknown. In-situ rock shear tests are conducted under exactly such conditions.
Plaster Model Tests
To simulate the in-situ rock shear tests, a set of plaster model tests was carried out. Each plaster model had a block part, to be loaded, and was shaped into a flat form in order to observe cracks throughout the loading process. The models were set to be inclined and adjusted to the loading apparatuses in each case for actual operations (Fig. 2).
Figure 3 shows the crack sequences observed in three test cases. All of the cases were divided among these three typical cases. The first type, shown in Fig. 3(a), was obtained under lower normal stress. Firstly, a tensile crack initiated and propagated forming a curved path. Then, a few small cracks appeared at the center of the block base, marking the peak of the shear stress, namely, the shear strength, at the same time. Those small cracks were diagonal to the block base. The second type, shown in Fig. 3(b), was obtained under middle normal stress. The features of the cracking process and the appearance of strength are almost the same as those of the first type, except that the tensile crack did not appear for this type. The third type, shown in Fig. 3(c), was obtained under higher normal stress. The deep zone seemed to be highly Normal stress σ and shear stress τ are given as
σ = (FN + FI sin θ) / A, τ = FI cos θ / A
on the anticipated shear plane. The maximum value for τ and the corresponding value for σ are used to determine the strength. Initial normal stress σn is given
as
σn = FN / A .
After performing the test several times, all of the results are arranged into Coulomb’s criterion.
Fig. 1 Schematic diagram of the in-situ rock shear tests.
x y
Fig. 2 Brief description of the set-up of the model tests. The plaster model is shown in gray. The block part to be sheared is set as being inclined.
Plaster model
x y
σN = 0.625 MPa σN = 1.25 MPa σN = 7.5 MPa
(a) (b) (c)
Fig. 3 Crack sequences observed in three cases of the plaster model tests.
1
2
3
1
2
3
1
2
compressed and widely crushed. Even after being severely crushed, the block seemed to be pressed and rubbed strongly against the foundation part.
Figure 4(a) shows the strength obtained in all the cases. The black points are for the ordinary intact models. The features of the distribution of those points are correspond to that of the crushed material.
The second type was also reported in past research done on concrete structures (Kaneko et al. (1993)), and seems to be similar to the common damage found on actual structures or grounds. Tensile cracks, like those of the first type, are occasionally observed at actual dam sites. The results of the third type seem to be similar to actual crush zones.
The other points in color in Fig. 4(a) show the results for the models which had layered discontinuities, like those shown in Fig. 6(c). The strength of the discontinuities affected the shear strength much more than the strength of the material itself. Such strength can be properly explained by the theoretical strength of the materials,
including the weak planes (Jaeger and Cook (1976)).
Numerical Analysis
As mentioned above, the fundamental theory of the failure of rocks and rock masses is essentially related to the stress in the materials. However, it is exceedingly difficult to obtain such stress values for actual materials. Therefore, another stress analysis is necessary to explain the failure mechanisms in the above-mentioned experiments.
In this study, an analysis of the crack initiation and propagation by the finite element method is performed. At present, the analysis cannot be completed satisfactorily; however, the numerical computation is able to realize a good simulation of the crack initiation and propagation in the actual experiments.
Fig. 4 Shear strength: (a) Results of the model tests; (b) Results of the computation.
Material strength ordinary triangular element; (b) An enhanced element including an interface Γ (Bolzon (2001)).
(a) (b)
(c) (d)
Fig. 6 Results of the finite element analysis: (a) Discretization for the intact model. The normal force was imposed on the node enclosed with a circle. The inclined force was imposed on the node marked with a circle and a triangle, as the incremental displacement; (b) Results for the intact model, σN =
0.625 MPa, whose results for the actual experiment are shown in Fig. 3(b); (c) Cracks on the actual layered model, ψ = 45°; (d) Results for the same case as (c).
To simulate the cracks, enhanced finite elements, each of which includes an interface (Bolzon (2001)), were adopted, as seen in Fig. 5. Initially, the incremental computation was started with ordinary finite elements for every case, and the elements whose stress values reached the material strength were replaced with enhanced elements. The simple contact analysis was done on the interfaces in the enhanced elements, and also on the outer boundary and the initial discontinuities if given. Figure 6(a) presents a discretized model of the intact plaster model.
Figure 6(b) shows one of the results of the finite element analysis for the plaster model. The crack distribution is similar to the corresponding actual results shown in Fig. 4. Furthermore, Fig. 6(d) shows one of the results for the layered model and corresponds to the actual results shown in Fig. 6(c). They are also similar to each other. Figure 4(b) shows the strength obtained through the finite element analysis. Compared with Fig. 4(a), the strength of the intact models was entirely computed as the lower value; however, the shape of the row of points is similar to that in Fig. 4(a). On the other hand, the strength for the layered models seems to be similar to that in Fig. 4(a). It is desirable that details on the procedure for the crack appearance and crushed material be improved. Thereafter, as the next step, the stress analysis itself should be enhanced by an examination of the obtained stress values.
Conclusions
From the results of plaster model tests, which simulate the direct shear tests for in-situ rock masses, the
following conclusions can be drawn.
- Failures occurred progressively throughout the process of the tests, and it was found that the cracking patterns depended upon the normal stress range. The strength appeared in different ways according to the normal stress range.
- The strength of the discontinuities affected the shear strength much more than the strength of the material itself. Such strength was accurately explained by the theoretical strength of the materials, including the weak planes.
Furthermore, a finite element analysis for the appearance of cracks and their propagation was developed for the simulation of the plaster model tests. As a result, the appearance of cracks and their propagation, as well as the stress relaxation caused by them, were obtained correctly. In the next step, further progress is needed for a stress analysis of the direct shear.
References
1) Bolzon G (2001) Formulation of a triangular finite element with an embedded interface via isoparametric mapping. Computational Mechanics, 27: 463–473. 2) Hoek E (1983) Strength of jointed rock masses. Géotechnique, 33(3): 185–223.
3) International Society for Rock Mechanics Commission on Standardization of Laboratory and Field Tests (1974) Suggested Methods for Determining Shear Strength.
4) Jaeger JC and Cook NGW (1976) Fundamentals of Rock Mechanics. 2nd ed. London, Chapman and Hall Ltd.
DISCHARGED FLOW FROM THE EFFLUENCES OF A THERMAL POWER PLANT
Nguyen Cao DON (
グエンカオドン)
1,* and Nguyen Thi Minh Hang
21 Faculty of Water Resources Engineering, 2 Faculty of the Environment, Thuyloi University (WRU)
175 Tay Son, Dong Da, Hanoi, VIETNAM Email: [email protected]
ABSTRACT
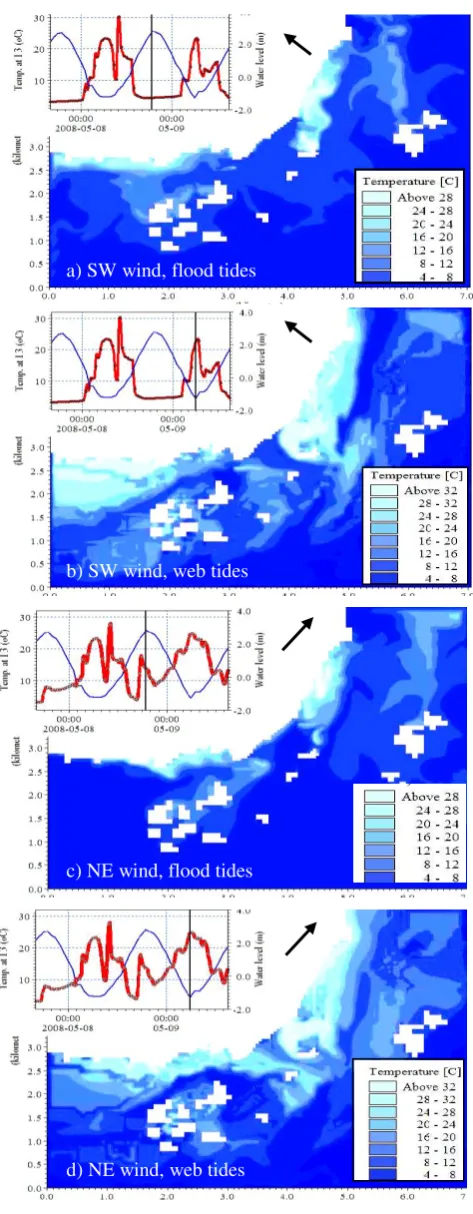
Prediction of the transport of effluent discharged from the outfalls of thermal power plants to coastal waters is an important task in coastal environment and related areas, not only to operation and design of the plant but also to living systems due to changes in water temperature. In this study, the hydrodynamic characteristics of water flow and heat transport in a tidal flat of Vietnam were studied using a numerical hydrodynamic heat transport model. The model was calibrated with observed data and it well reproduced water level, salinity and seawater temperature. We found that the tidal currents and winds play an important role in the dynamics of water temperature in the tidal flat area.
INTRODUCTION
This study was carried out for effluents of the Cam Pha thermal (coal-fired) power station, which is located on the shore of Bai Tu Long Bay, northern Vietnam (Fig. 1). The power station consists of three plants, two existing ones (CP1, CP2 with outfalls O1, O2 respectively) and one (CP3, with influent I3 and outfall O3) to be constructed. The plants will be using seawater from the bay for cooling pur-poses. Based on thermal specifications for these plants, there is a need to conduct a research on how thermal efflu-ents affect the ambient water on the bay and on the influent of CP3 in order to fix its location. There is a number of op-erating scenarios; however, we here considered only the case when all plants are working together.
METHOD AND MODEL SETTING
The transport equation for salinity or temperature is of the form:
1 ( )
( i )
j j
S S
D SS
t x x
(1)
in which S– is the concentration of salinity or temperature;
Di - the dispersion coefficient in the i-direction, which is dependent on grid size and the computing time step, and SS
- the source/sink term. The dispersion of salinity and tem-perature is assumed to be proportional to the effective eddy viscosity with the factor of proportionality being1/T, the dispersion factor;
Tis the Prandtl/Schmidt number. Val-ues of Tgreater than one imply that diffusive transport is weaker for salt/temperature than for momentum.In this study, MIKE 3 model (DHI, 2003), a modeling tool, was newly set up for the study area. The model con-sists of two main modules: a hydrodynamic module and an advection-dispersion module. The bathymetry data were constructed based on a local map with some modification to the shoreline because of land reclamation activities tak-ing place in the area.
Fig. 1 Map showing location of the study area
al., 2007). The area of interest is approximately 7.0 x 6.0 each time integration of the advection dispersion equation. The advection-dispersion equation is solved at each time step following the time integration of the hydrodynamic equations. The turbulence is modeled in terms of an eddy viscosity and a bed shear stress. The eddy viscosity can dy-namically be specified by means of the mixed
k-/Smagorinsky formulation with a standard k- model in the
vertical and a Smagorinsky formulation in the horizontal (Don et al., 2007; MIKE3, 2001).
RESULTS AND DISCUSSION
Calibration of the model focusing on choosing parame-ters was achieved through trial and error for water level, sa-linity and water temperature. Figure 2 plots the computed sea water levels (lines) against the observed ones (dots). The simulated tidal levels have a good agreement with the observed ones. The errors (mean absolute error, relative mean square error, mean error) are approximately 1% of the water depth at this location, indicating that a good esti-mation has been obtained.
Figure 3 shows a comparison of computed salinity and the observed one. Overall, the computed salinity follows well the observed data. At low tides, salinity levels were over estimated due to the effects of air and water
tempera-ture. Extremely low surface salinity occurred during web tides. Calibration of the model for water temperature how-ever was not done because of there were no observed data as long as the plant is in operating conditions. From the above results, we newly found that the thermal plants will contribute small impacts to the seawater levels and salinity concentrations in the local bay.
Effect of winds
In the bay, winds are significant, which cause large var-iations in the water properties by advecting the waters on- and offshore, and strongly influence the direction of flow circulation. Therefore winds contribute great effects to the distribution of seawater temperature. The optimal condi-tions for input of this coastal water are NE and SW winds, which are driving forces for current waters to run up and along the shoreline.
The wind friction originates from the vertical shear term assuming a balance between the wind shear and the water above the sea surface, CW - the wind drag (friction) coeffi-cient = 0.0026 for moderate and strong winds, is the den-sity of water.
The effects of northeastern (NE) wind and southwestern (SW) winds to seawater temperature at I3 are plotted in Fig.
-2.0
Fig. 2 Variation of computed seawater levels (lines) vs. the observed ones (dots)
4. When the southwestern wind is dominant, the effluents of O2+O1 will also make water temperature at the influent I3 (Fig. 4a, b) to increase by 15%. The “Thermal Flume and Mixing Zone” can be determined based on the size and spatial distribution of the thermal plume resulting from the outfall discharges. The size and spatial distribution of the mixing zone tend to vary considerably from time to time.
When the northeastern wind is dominant, the effluents of O2+O1 will induce more change in water temperature at the influent I3 (Fig. 4c, d). The cooling water flume from CP2+CP1 will tend to move to the southwestern part along the shore. This will induce water temperature at I3 to in-crease up to 35% , especially at low tides (Don, 2008).
CONCLUSIONS
In this study, the effects of thermal effluents in the am-bient water on the bay and on the influent I3 were ad-dressed using a numerical model that simulates the hydro-dynamics of water flow and the dispersion-advection of density currents. We found that winds play an important role in spatial distribution of the water cooling flumes. SW winds will induce a higher water temperature in comparing to NE winds. The location of the effluent I3 (300m from O3) should be chosen so as to be less thermal influence from the effluent sources, while not being separated from the plant. However, it is recommended that such a location of I3 should be selected based on a more detail study in or-der to minimize the construction cost while also increasing the heat dispersion efficiency.
REFERENCES
Don, N. Cao (2008). Heat transport from the outfall of Cam Pha thermal power plant. Unpublished report.
Don, N. Cao, Araki, H., Yamanishi, H., K. Ohgushi, Hang, N. T. Minh, and Tokunaga T. (2007). Sediment transport and short-term sedimentation processes in the tidal flats of the Ariake Sea, west coast of Kyushu, Ja-pan. Journal of Coastal Research, SI 50, pp. 837-841. DHI (2003). MIKE 3: Scientific Documentation. Estuarine
and Coastal Hydraulics and Oceanography Hydrody-namic Module.
a) SW wind, flood tides
b) SW wind, web tides
c) NE wind, flood tides
d) NE wind, web tides
A study for Water Stops Installed Outside of Galleries on Deformable Ground
CHIHARA Eiji *1, NISHIYAMA Tatsuro,*2ISHIBASHI Shinji*1
*1Sanyu-Consultants Inc, 35-16 Daikancho, Higashi-ku Nagoya-City Japan *2Fuculty of Applied Biological Science Gihu University Yanagito 1-1 Gihu City Japan
Abstract
In Japan, it is defined to construct a concrete gallery when construct a fill dam with a height of 30 meters or more. However, in softer foundation ground, deformation of the foundation may occur. At the joints of the
galler-ies, deformation of the foundation ground concentrates on itand the risk of hydraulic destruction by Infiltration
water around the joint will increases. Here, I will introduce a water stop made by new ideas, installed on the out-er circumfout-erence of the gallout-ery, developed to prevent Infiltration watout-er.
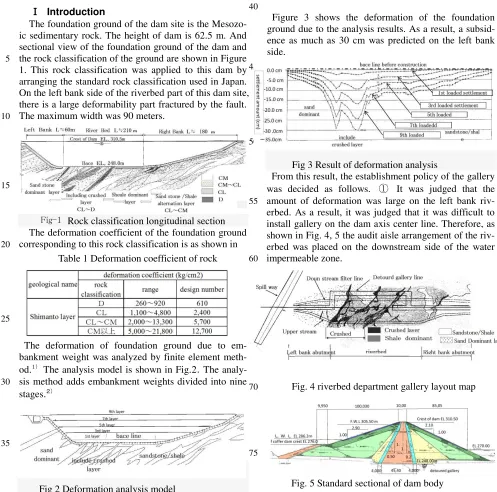
Ⅰ Introduction
The foundation ground of the dam site is the Mesozo-ic sedimentary rock. The height of dam is 62.5 m. And sectional view of the foundation ground of the dam and the rock classification of the ground are shown in Figure 5
1. This rock classification was applied to this dam by arranging the standard rock classification used in Japan. On the left bank side of the riverbed part of this dam site, there is a large deformability part fractured by the fault. The maximum width was 90 meters.
10
15
Fig-1 Rock classification longitudinal section
The deformation coefficient of the foundation ground corresponding to this rock classification is as shown in 20
Table 1 Deformation coefficient of rock
25
The deformation of foundation ground due to em-bankment weight was analyzed by finite element meth-od.1) The analysis model is shown in Fig.2.The analy-sis method adds embankment weights divided into nine 30
stages.2)
35
Fig 2 Deformation analysis model
40
Figure 3 shows the deformation of the foundation ground due to the analysis results. As a result, a subsid-ence as much as 30 cm was predicted on the left bank side.
45
50
Fig 3 Result of deformation analysis
From this result, the establishment policy of the gallery was decided as follows. ① It was judged that the amount of deformation was large on the left bank riv-55
erbed. As a result, it was judged that it was difficult to install gallery on the dam axis center line. Therefore, as shown in Fig. 4, 5 the audit aisle arrangement of the riv-erbed was placed on the downstream side of the water impermeable zone.
60
65
Fig. 4 riverbed department gallery layout map 70
75
Ⅱ
Problem of gallery joint caused by
ground deformation concentrates on the joint of the gal-lery. As shown in Fig. 6, the deformation shape of the joint is openings, gaps, and its composite shape.
10
Gap opening gap and opening
fig-6 Joint deformation overview 15
In this dam, FEM analysis including joint elements was performed to estimate the gallery joint deformation. As a result of the analysis, it became clear that the gal-lery deforms greatly toward the deformable ground. The analysis result is shown in Fig-7. At the lower left abut, 20
it was predicted that a maximum opening of 10 mm would occur outside the gallery joint. Also, opening of several mm was predicted for several joints.
25
30
Fig. 7 Diagram of gallery joint deformation analysis
Ⅲ Gallery joints structures
Figure-7 shows a typical gallery joint struc-ture.3)Various ideas are made at the gallery joint for the
35
purpose of preventing water leakage towards inside of the gallery and dealing with local deformation etc.
40
45
Fig. 8 Diagram of gallery joint detail
① water stop; double water stop structure inside 50
and outside. Strong against high pressure water pres-sure.
② Joint grouting: After completion of the embank-ment construction works, mortar grouting is performed between double water stop preventing the water stop 55
deformation due to water pressure.
However, when the deformation becomes large, in the portion indicated by the arrow shown in Fig. 9, a gap is generated outside the outer water stop, and it is impossi-ble to deal with it from the inside of gallery. Then it will 60
result in extremely dangerous situation in water shield-ing materials against upstream to downstream infiltra-tion.
65
Fig. 9 Gap formed during joint deformation 70
75
80
Fig.10 Opening formed between joints deformation on the top of the gallery joint
In the gallery bottom part, after the embankment con-struction, the main curtain grout and the water imper-meable grout of the auxiliary curtain grout are con-85
structed. However, if the joint dislocation or opening due to the base deformation occurred after the embank-ment construction work, voids occurred at the top edge and the foundation ground contact surface as shown in Fig-10. As a result, there is a greater risk of progressive 90
destruction due to soil particle flow through the void made by opening deformation. In this way, the wa-ter-stop of the fill dam gallery constructed on great de-formable foundation ground, is insufficient to deal with inundation only to the inside.
95
1. Development of water stop installed Outside of the gallery
.
Against the above problem, we have developed water stop structure by new ideas as followings.
① It is necessary to have a new idea of a water stops 100
that wraps the released space caused by displacement and opening .
②In addition, a buffering backup rubber (B = 500 t = 25 mm) for backing up the plastic deformation of the main water stops, was arranged outside of water stop. 105
開き 10mm Opening 10mm
Opening 10mm
5
10
Fig. 11 Explanation of outside water stop structure
③ As shown in Fig. 12, construction was carried out with primary concrete preceded by side walls and bot-15
tom so as to absorb irregularities of the rock surface. The backup rubber and the outer water stop were set there, and the main body concrete was constructed.
20
25
Fig. 12 Explanation of outside water stop detail
Since the outer water stop and the backup rubber are of two kinds of rubber structures, the connection surface was bonded with asphalt urethane rubber that is softer 30
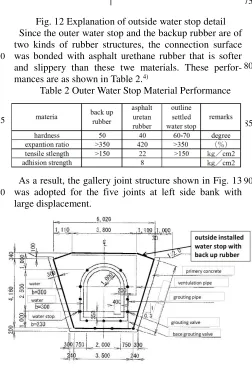
and slippery than these twe materials. These perfor-mances are as shown in Table 2.4)
Table 2 Outer Water Stop Material Performance
35
As a result, the gallery joint structure shown in Fig. 13 was adopted for the five joints at left side bank with 40
large displacement.
45
50
Fig.13 gallery Joint section with new type water stop
Ⅳ
Performance check test1. Pressure test 55
Performance confirmation against water pressure after completion of dam construction was carried out with the equipment shown in Fig.14。In the test, firstly, two pieces of the concrete device has been set in the state of a gap 45 mm, and being set in the state of opening 15 60
mm. Next, an assumed water pressure of 6 kg / cm 2 was applied from the inside, and it was confirmed that there was no decrease in internal pressure during the test period.
65
70
Fig.14 Outline of pressure test 75
2. Construction confirmation test
The construction site of this joint type is constructed at the inclined slope part. On the other hand, the water stop has many projections, and when vibrator work per-formed excessively the air separated from the concrete is 80
likely to accumulate. We have already confirmed this in the indoor casting test. Then we conducted onsite tests so that construction could be carried out safely. As for the test the same scale of the gallery, two pieces of a 1 m section concrete block including a joint was constructed. 85
In the field test, concrete was casted from the lower part. And in the construction of the top part, stopping the vi-brator work, the water stop was turned up toward the center part and the separated air was eliminated. After that we added additional concrete, and finally we con-90
firmed that we can push the water stop into the concrete by manual strike. Photo 1 shows that, after the test, the concrete block was cut with a concrete cutter, and it was confirmed that the protrusion of the water stop was surely being put into the concrete without air.
95
100
Photo 1 Casting test Specimen after cutting 105
Ⅴ
Construction works and behavior moni-toringMeasurement of gallery joint behavior, and observa-tion against infiltraobserva-tion water along gallery joint were planned as follows. The opening and the gap of the joint 5
of the gallery were monitored from the inside of gallery by many joint meter. On the top of gallery, pore pressure gauge was placed at upstream and downstream to ob-serve infiltration water along the gallery joint.
Ⅵ
Monitoring result 10At the joints, where the deformation prediction has been done, predicted opening, and gap were occurred. The maximum opening was 7 mm in the width confirmed from inside of gallery. From this, it is assumed that at the outer
circumfer-15
ence, the opening of the gallery is assumed to be 10 mm. And it was judged to be the same as the initial prediction. Water storage was started af-ter the dam construction was completed, but in the internal observation, no leakage trace, nor
20
free lime the joint was confirmed. In addition, no
abnormality was found in the pore pressure gauge installed at the upstream and downstream of the top of the audit corridor. From these observation results, it was judged that the water stops installed outside of 25
gallery is functioning normally.
About 10 years have passed since then, no abnormality is recognized. From this result, it is judged that the newly developed water stop contributes to the hydraulic safety of gallery joint of the dam constructed on the de-30
formable ground.
Reference
1) Japanese Ministry of agriculture forestry fisheries, Design stand-ards of Fill Dam PⅡ-149 ,
2) Same as above PⅡ-150イ FEM analysis including gallery 35
by joint elements.
3) Same as above PⅡ-150(4) Joint instruments and stop water treatment
4) ASTM D412 Standard Test Methods for Vulcanized Rubber and Thermoplastic Elastomers—Tension
A Study on the Operation Procedure of South Nghe An Hydraulic System for Irrigation
under Water Shortage Conditions
○
Nguyen Thu HIEN
,
Tran Dung TIEN
(Faculty of Water Resources Engineering, Thuyloi University
)
SUMMARY
The South Nghe An hydraulic system has been upgraded with a new Nam Dan sluice to replace the old one to meet the irrigation requirement for 22,500 ha with the probability of 85%. The water is taken from the Lam River through Nam Dan sluice. However, in recent years, due to the effects of climate change and human activities, the water levels in Lam River tends to decrease considerably. This greatly affects the ability of taking irrigation water for agriculture.
In this paper, MIKE 11 model was applied to compute the abilities of taking water to the system and the hydraulic regime in the system with 12 water shortage scenarios (different flow regimes with minimum water levels of the Lam River at the upstream of the sluice below design water level). The computed results show that for some cases, both new Nam Dan sluice and the old one should be operated together in order to increase water taking ability to the system. Different operation options were computed corresponding to the scenarios to determine the appropriate operating procedures to increase the amount of water taken through the sluices to improve the irrigation water supply under water shortage conditions in the study area.
Introduction
South Nghe An Hydraulic System has one main sluice, the Nam Dan Sluice (old), built in 1936-1939 to take water from the Lam River for water supply and navigation in districts Nam Dan, Hung Nguyen, Nghi Loc, Vinh and Cua Lo town. The sluice has been working for quite long time (more than 70 years). Moreover, recently the cultivated area increases (from 18,000 ha to 22,500 ha) and the water requirement expanded for other sectors such as aquaculture and industry... So that the capacity of the old sluice could not be satisfied the water requirement of the region. Therefore, in 2008, a new Nam Dan sluice project was approved to replace the old one.
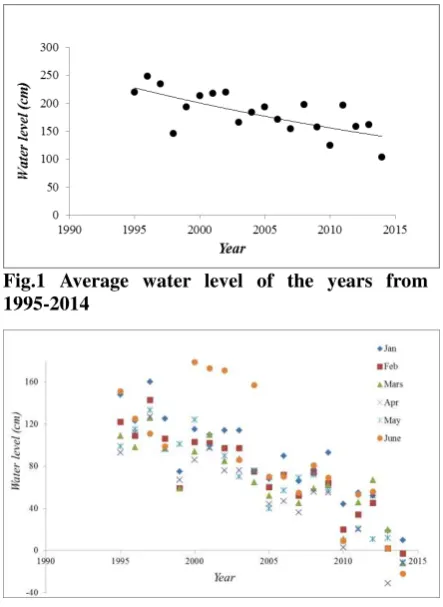
The new Nam Dan sluice was designed to supply water for the South Nghe An area. The designed water level of + 0.833m was calculated from water level data series (1960-2000) to ensure to supply water with frequency of 85%. However, currently hydrological data at Nam Dan station from 1995 to 2014 show that the water level of Lam River tends to decrease significantly. Fig. 1 shows the average water level for the years from 1995 to 2014. Fig. 2 shows the monthly minimum water levels in the dry season. The observed data show that from 2008 to
2014 the minimum water level decreased significantly, from + 50cm down to -20cm. This trend considerably
Fig. 2 Monthly minimum water level of the years from 1995-2014 in dry season
affects the water supply to the South Nghe An system. Therefore, under the water shortage conditions in order to increase the capacity of taking water from the Lam River to the system, the old Nam Dan sluice is proposed to be operated together with the new one in case the new one cannot take enough water to the system.
In this paper, several scenarios of water shortages (when the upstream water level is smaller than the designed water level) with different operation options in the dry season (Winter-Spring crop) were simulated. From that, appropriate operations are recommended to increase the capacity of taking water to the irrigation system, in order to reduce water shortage situation in the region.
Method
In order to solve this problem, Mike11 model (DHI, 2007) was applied to calculate the hydraulic regime of Nam Nghe An irrigation system. The MIKE 11 model developed by DHI Water & Environment is a one-dimensional hydrodynamics, water quality and sediment transport model in river systems, canals with structures (dams, gates, pumps ...) reservoir and canal ans structure operations... This model is a very good tool to help decision makers for design, management and operation of hydraulic systems.
Hydraulic scheme of South Nghe An system
The South Nghe An irrigation system has the following of the gates and lock is -1,30m. The new Nam Dan sluice is designed with 3 gates, with the width of b = 5m each and a navigation lock with the width of B = 7.0m, the inverts of the gates and lock is -1,40m. The system consists of 4 main canals (Thap, Gai, Cam and Khe Cai) and grade 1 canals with the length of 130 km. Inside the system, irrigation procedure is operated by pumping stations. Water is pumped from the main canals and grade 1 canals. The geometry data and the operation data of pumping stations of the system are provided by the South Nghe An Irrigation and Drainage Company. Fig. 3 illustrates the hydraulic scheme of South Nghe An Nam in Mike 11.
Upstream boundary is the water level Z (t) of Lam River at the upstream of the old and new Nam Dan sluice gates.
In dry season, Nghi Quang, Ben Thuy drainage sluices are closed (South Nghe An Irrigation Drainage Company, 2008). Therefore, for this study the downstream boundaries are closed boundaries. Other boundaries are internal boundaries at pumping stations in the system.
Model calibration and verification
The model was calibrated by adjusting roughness coefficients using observed data at some locations on the system from April 14, 2015 to April 21, 2015. Figure 4 shows that the measured and computed water levels at the upstream of the 4A pumping station are quite closed to each other. The difference between the computed and measured water levels ranges from 0 to 7cm. The Nash-Sutcliffe coefficient is 96%.
The calibrated parameter set is verified for the period 6th June 2015 to 16th June 2015. Fig. 5 shows the observed
and computed water level at the 4A pumping station. From the figure it can be seen that the computed water levels are closed to the observed ones with The Nash-Sutcliffe coefficient of 0.78.
0.0 500.0 1000.0 1500.0 2000.0 2500.0 3000.0 3500.0 4000.0 4500.0 5000.0 5500.0 6000.0 6500.0 7000.0 7500.0 8000.0 8500.0 9000.0 9500.0 [meter]
[meter] Standard - Hydraulic scheme of South Nghe An system.res11
NHANH NDAN CU
KENH HOANG CAN KENH HOANG CAN KENH HOANG CAN KENH HOANG CAN KENH HOANG CAN
KENH HOANG CAN KENH HOANG CAN KENH HOANG CAN KENH HOANG CAN
Fig.3 Hydraulic scheme of South NgheAn system
[meter] Time Series Water Level Water Level Computed WL at P.S 4A External TS 1
Observed WL at P.S 4A
Scenarios and operation options
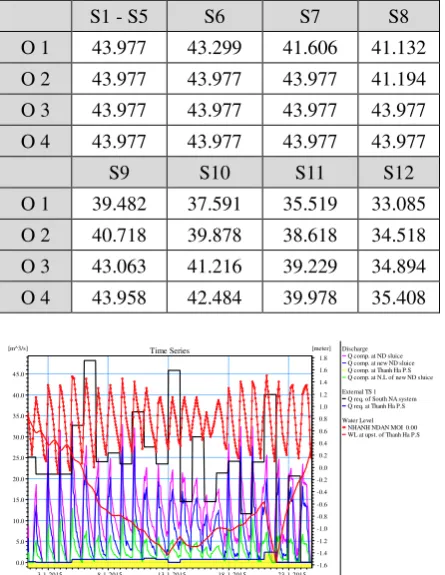
Operation procedure is considered under different conditions of water shortage. 12 scenarios were computed corresponding to the stage hydrographs of the Lam River at the location of the new Nam Dan sluice with the lowest water levels ≤ + 0.83m (design water level ) (see Table 1).
For each scenario, there are the following operation options:
- Option 1 (O1): only the new Nam Dan sluice gates are
opened (completely or partly open);
- Option 2 (O2): the new Nam Dan sluice gates and navigation lock are opened (applied when option 1 is not satisfied );
- Option 3 (O3): the new Nam Dan sluice gates and navigation lock are opened and combined with the old Nam Dan sluice gates (applied when option 2 is not satisfied );
- Option 4 (O4): Same as option 3 with a combination of alternating irrigation inside the system (applied when option 3 is not satisfied).
It is noted that Nam Dan sluice gate(s) are operated to take water to the system and Nam Dan gates are closed when water levels of the Lam River was lower than the water level of the Thap Canal (downstream of the gates).
Simulation time:
According to the local cultivation, there are 3 main crops in the area (winter-spring crop, summer-autumn crop and winter crop). Of which, winter-spring crop has most gravitationally from the Lam River through the Nam Dan sluice(s). Lam River's water level is affected by tides, especially in the dry season. The data show that the level fluctuation in water level from 45 cm to 160 cm, particularly, in dry season, the influence of the tide significantly affects to the ability of taking water through the Nam Dan sluices to the system.
Figure 6 shows the simulated stage hydrograph at some locations in the system corresponding to the scenario 1 and the operation option 1. The figure shows that in winter-spring crop duration, the water levels from in January (3rd - 23rd January) in the system are very low
because this is highest water demand for land preparation and sowing. Therefore, this duration is most difficult time to ensure water requirement and is chosen to discuss for operation options in this paper.
Table 2 shows the total water requirement of the system and the total water volume can be taken through the Nam Dan sluices under different scenarios and options. Total water demand for the period from 3/1 to 23/1 is 43.977 mil. m3(Water resources engineering institute , 2017). The
results show that though the discharge requirement of the system in this duration is not properly satisfied but for Scenarios S1 to S5, the new Nam Dan sluice can get enough the total volume to the system. For scenarios 6 and 7, it needs to open also the navigation lock to increase the capacity of taking water. 6-6-2015 8-6-2015 10-6-2015 12-6-2015 14-6-2015 16-6-2015
-0.50
[meter] Time Series Water Level Water Level Computed WL at P.S 4A External TS 1
Observed WL at P.S 4A
Fig.5 Computed and observed water levels at the 4A pumping station (model verification)
3-1-2015 23-1-2015 12-2-2015 4-3-2015 24-3-2015 13-4-2015 3-5-2015 23-5-2015 0.20
For Scenario 8, when the water level in Lam River is very low, if only the new Nam Dan sluice gates and lock are operated, the total water volume cannot take enough water for this duration. Therefore, it is necessary to combine the old one to increase the amount of water taken into the system (operation options O3). The results show that for this case when two sluices operated together the total water volume taken to the system satisfied the water requirement for this duration. Fig. 7 illustrates the discharges flow to the system when both the sluices gates and locks are operated.
From Table 2, it also can be seen that for scenarios S9 to S12, even both sluices and navigation locks are operated, the total water volume is not satisfied the water requirement. And for these conditions, alternating irrigation method should be applied to reduce the effect of water shortage and regulate the requirement discharges.
Conclusion
In this paper, MIKE 11 model was applied to study operation procedures for Nam Nghe An irrigation system in water shortage conditions (water levels are lower than designed water level). 12 scenarios with different operating options were considered. The computed results
show that, in order to improve the ability of taking water to the system in water shortage conditions in many cases it is necessary to operate both Nam Dan sluices combined with alternating irrigation method.
It is also recommended that in very serious water shortage conditions (for example for scenarios S9 - S12), besides applying the proposed operation procedure, some other solutions should be considered such as applying modern irrigation technology to save water, regularly maintaining the hydraulic system (canals, structures, pumping
stations…), applying new crops with high drought
2) South Nghe An Irrigation Drainage Company (2008). Decision on supplementary operation procedures for the headwork sluices Nam Dan, Ben Thuy, Nghi Quang. 3) Vietnam standards (TCVN 8412:2010). Hydraulic structures – Guideline for setting operation procedure. 4) Water Resource Engineering Institute (2017), Water requirement computation for Nam Nghe An region. Table 2 The total volume of water taking through
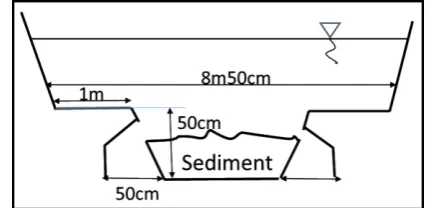
Nam Dan sluices with different scenarios and Q comp. at new ND sluice Q comp. at Thanh Ha P.S Q comp. at N.L of new ND sluice External TS 1
Q req. of South NA system Q req. at Thanh Ha P.S Water Level
NHANH NDAN MOI 0.00 WL at upst. of Thanh Ha P.S
How the water distribution pattern to paddy plots will change by an adjustment of weir
height - trial simulation -
○
Takeo ONISHI
,
Kimihito Nakamura
(Faculty of Applied Biological Sciences, Gifu University, Faculty of Agriculture, Kyoto
University
)
SUMMARY
We need to satisfy three different purpose, maintaining productivity, conserving water quality, and reducing greenhouse emission simultaneously. Regulating water management is one of the promising way to achieve this goal. Thus, the objective of our research is to evaluate how the different water management method will influence on the productivity, water quality, and greenhouse emission. To achieve our goal we are conducting field measurements and numerical simulations at Vietnam. As of the first trial of our numerical simulation, we assumed a simple imaginary case. The results indicate that if we can properly set the weir height of the irrigation canal, homogeneous water distribution to each plot might be possible. Further combined research of field measurements and simulations are required.
Introduction
Generally, the highest priority of paddy field is rice productivity and quality. To achieve that purpose, efficient water resource use is important. In other words, saving irrigation water is required. On the other hand, paddy agriculture sometimes induces various environmental problems. Excessive drainage water, which contains various materials, contaminate the downstream water bodies including rivers, lakes, and oceans. And, a part of nitrogen fertilizer in soil goes to groundwater as nitrate, and induces groundwater contamination. Thus, water quality conservation of the downstream water bodies and groundwater is very important for safe drinking water and ecosystem conservation. Furthermore, a part of nitrogen in soil emits to the atmosphere as N2O (nitrous oxide). CO2
and CH4 (methane) also emit to the atmosphere from
soil when organic matter is decomposed. These gases are greenhouse gas and induce global warming. So, reducing greenhouse gas emission from paddy field is also required. Thus, we need to satisfy three different purpose, maintaining productivity, conserving water quality, and reducing greenhouse emission simultaneously. Regulating water management is one of the promising way to achieve this goal. Thus, the objective of our research is to evaluate how the different water management method will influence on the productivity, water quality, and greenhouse emission.
Material and Method
Research framework is shown in Fig.1. We set three different types of water management plots. The first is conventional management plot. The second is dry type management plot. And the third is wet-type management plot. Comparing these differently treated plots, we are going to clarify which is the optimum management method. One important characteristics of our research is considering a practical way to control water in paddy field; i.e. by only implementing a small weir of which height is different in canals, water regime of each plot
will be regulated.
Under the above-mentioned framework, we are now conducting field measurements such as water quantity and quality, groundwater levels, volumetric soil water, Eh of soil water, the amount of greenhouse gas (N2O,
CO2, and CH4) and rice productivity. Configuration of
the study site is shown in Fig.2.
Dry-Type
Simple and easily understandable water management for farmers and local managers.
1. High rice productivity and quality 2. Irrigation water-saving 3. Water quality conservation 4. Reducing greenhouse gas emission Observation item
Paddy Block #1 Paddy Block #2 Paddy Block #3
As a component of this research project, we attempted to simulate how the water distribution pattern to paddy plots will change by an adjustment of weir height of an irrigation canals. As of the first trial of our numerical simulation, we assumed a simple imaginary case shown in Fig. 3. In the setting, one straight canal of which slope is 1/0000 is lined along two plots of which sizes are 100m×30m. Through the three small inlets (ditches dug at levees of plots), irrigated water will flow into plots. Flowing pattern and the amount of water is regulated by the difference between the water level of upstream canal and that of downstream canal. By changing the water levels at the downstream of canal, how the water flow pattern in plots will change were evaluated.
The governing equation used for the simulation is 2 dimensional Saint Venant equations as follows.
0 viscosity, g: gravitational acceleration, n: roughness, W: wind velocity, f: Coriolis force. Calculation scheme is the finite element method with two step explicit method propose by Kawahara et al. (1978), and customized for flood simulation by Hai et al. (2008).Result and Discussion
Three different types of water level at the downstream of canal were set as boundary conditions for each the bottom elevation of inlets (case3).
The simulation results indicate in case of case1, water distribution to plots are not homogeneous, since water level of the canal at the downstream is lower than the bottom elevation of outlet. On the other hand, in case of case2, irrigation water homogeneously spread out to the whole area of plots, but also some water were flowing back to the canal, since water level of the canal at the downstream is higher than the bottom elevation of outlet. In case of case3, the result indicate that if we can change the weir height according to the water levels of plots, we can properly manage the amount of water for irrigation. On the other hand, farmers usually don’t want to spend much time for water level management. So, it’s not practical to recommend the case3. More practical way might be to find the optimum height of weir to achieve three goals mentioned in the Material and Method. Thus, the next step is to construct a simulation model of actual case. And based on the model and observation, it is required to find the optimum way to manage the water.
Conclusion
Numerical simulation was conducted for the assessment of water distribution to plots. The results indicate that if we can properly set the weir height of the irrigation canal, homogeneous water distribution to each plot might be possible. Further combined research of field measurements and simulations are required.
Acknowledgement
To conduct the research, JSPS grand-in-aid No. 16H05799 support was indispensable. And the authors gratefully thank to the Kitai Sekkei to provide the elevation survey data of the study site, and Prof. Masumoto of NARO to provide simulation code.
Reference
1) Kawahara M, N Takeuchi, T Yoshida (1978): Two step explicit finite element method for Tsunami wave propagation analysis, Int. J. Numer. Meth. Eng. Vol. 12, pp.331-351
2) Hai P T, T Masumoto, K Shimizu (2008): Development of a two-dimensional finite element model for inundation processes in the Tonle Sap and its environs, Hydrol. Process. 22, pp. 1329-1336
Fig.2 Outline of the study site
Research on cause of KE 2/20 REC dam failure in Vietnam from view point of hydraulic
fracturing
○
Duy Quan TRAN
1, Shinichi NISHIMURA
2, Masateru SENGE
2and Tatsuro NISHIYAMA
2(
1The United Graduate School of Agricultural Sciences, Gifu University, Japan;
2Faculty of
Applied Biological Sciences, Gifu University, Japan.
)
SUMMARY
Hydraulic fracturing is the propagation and development of cracks under the effect of water pressure. It is widely believed that hydraulic fracturing will occur in a fill dam when the stress in the dam is reduced to levels that are lower than the water pressure, a condition which allows for crack propagation in the dam body. The risk of hydraulic fracturing may increase when arching action occurs due to the differential displacements of the different materials in the dam body. The aim of this study is to explain the cause of a dam failure using the finite element method. A case study, KE 2/20 REC dam, investigates a dam that broke during the first reservoir filling at positions adjacent to the culvert. A build-up model is taken to simulate the stress-strain state in the dam body. This research reveals that the normal stresses around the culvert were reduced to levels much lower than the water pressure. This was due to the arching action that was associated with the effects of the culvert and the foundation. The findings suggest that the cause of the dam failure was related to the hydraulic fracturing phenomenon.
Introduction
Hydraulic fracturing has been identified as one of the possible causes leading to the concentrated leakage and failure of many fill dams especially at the first reservoir filling [2]-[3], [5]-[7], [9]-[10]. It is generally accepted that hydraulic fracturing will occur when the normal stress at any point is exceeded by the water pressure [6]-[7]. Previous studies revealed that hydraulic fracturing is closely related to the occurrence of arching action in the dam body. Arching action often occurs among different materials, such as between impervious cores and shoulders, culverts and fill soil or fill soil and foundations [2]-[3], [5]-[6], [10]. Under loading, materials with different elastic moduli can lead to differential displacements and then induce arching action. Due to this action, the stresses in fill dams can be reduced. Past researches indicated that an incident at the Hyttejuvet Dam during the initial filling of the reservoir was related to the hydraulic fracturing phenomenon [3], [5]. The arching effects in the clay core of this dam caused a reduction in the stresses to levels that were much lower than the water pressure. In such a situation, under water pressure, seepage can penetrate through the existing cracks in the dam and induce stress concentration at the crack tips. As the tensile strength of soil is very small, the cracks can easily propagate
through the embankment, resulting in the failure of the dam. Similar incidents, also identified as coming from the hydraulic fracturing mechanism, occurred at Balderhead (England), Stockton (USA), Wister (USA), Viddalsvatn (Norway), and Teton (USA) Dams during the first reservoir filling [2].
In addition, arching action also occurs easily around culverts. Due to arching, the normal stresses on both sides of a culvert can be reduced to values that are much lower than the water pressure. According to field observations, past research concluded that hydraulic fracturing is the most probable cause of leakage along outlet conduits [6]. However, little attention has been paid to arching that was brought about by the effects of slopes excavated for the construction of culverts.
It is clear that dam failures due to hydraulic fracturing are actual potential risks. Therefore, much research in recent years has focused on predicting the risk of hydraulic fracturing in earth or rockfill dams. These studies can be divided into three groups [3], [10]. The first relies on cylindrical or spherical cavity expansion theories in elastic or elastic-plastic mechanics. The second is based on field or laboratory tests. The last uses theories of fracture mechanics combined with laboratory tests.
foundations, numerical analyses using the finite element method were often performed in past researches. The computed results of these analyses were compared with the results of in-situ or laboratory tests. The comparisons showed a good agreement. In this paper, therefore, a finite element procedure is applied to find the cause of a real dam failure as a case study.
A case study called KE2/20 REC dam failure in Vietnam was used for this study. This dam is located in Ha Tinh Province in Central Vietnam. The dam’s initial purpose was to create a reservoir to supply irrigation water for farmland (about 30 hectares). Construction of the dam and reservoir were started in October 2006. After 2 years, the dam was completed and was put into operation in July 2008. The related structures consisted of the main dam (maximum height of 12.5 m), a saddle dam, a spillway (width of 11.2 m), and a culvert (design flow of 0.037 m3/s). After being in operation for just one year, the dam broke in June 2009 [1], [8].
Past research concluded that the dam broke due to the piping mechanism [8]. Even though the research somewhat explained the cause of the failure, it did not point out what happened before the seepage had formed. The current authors inferred that the dam failure may be related to the hydraulic fracturing phenomenon. The focus of this study, therefore, is to explain the cause of the dam failure under the hydraulic fracturing mechanism using a numerical analysis.
Description of the dam failure
Much research in recent years has focused on explaining dam failures due to concentrated leakage. Hydraulic fracturing is considered to be one potential cause of concentrated leakage especially at the first filling soon after the dam completion. The risk of hydraulic fracturing may become higher when the normal stresses in the dam are reduced by the arching effect and the level of the water in the reservoir rises. Past researches pointed out that dam failures were caused by hydraulic fracturing at Hyttejuvet, Balderhead, Stockton, Wister, and Teton Dams during the first impounding [2].
This research introduces a dam failure that will be used as a case study called KE2/20 REC dam. The dam is situated in Central Vietnam. It broke at the location of the culvert under completely normal conditions, without the incidence of an earthquake or rain, and with an approximately 8.5 m in length in the water flow direction and 3.5 m in depth. There was also no sign of seepage from the shoulder of the dam. At the same time, the broken segment and a part of the dam body close to the culvert were swept toward the downstream [1]. An actual image of the dam failure is given in Pictures 1.
Picture. 1 KE 2/20 REC dam failure
Results of in-situ surveys and experiments after the dam failure showed that the slope of the excavation on the left side of the culvert (looking from upstream to downstream) was rather steep. In reality, the observed slope was just 1:0.5 (vertical and horizontal directions, respectively), even less than seen in Pictures 1 and 2, even though the required design value was 1:1. Figure 1 shows a longitudinal section of the dam that was idealized from the design section and in-situ observations. According to the geological description, the culvert and the dam were erected on a firm foundation of cracked and weathered rock – a kind of argillaceous slate. The elastic modulus of the foundation was much higher than the value of the filled soil. The physical properties of the filled soil and the foundation, taken from previous studies on the dam, are listed in Table 1. In addition, in-situ tests on the filled soil after the dam failure revealed that the embankment had not been compacted carefully. The real relative compaction (90.4%) had not reached the required value (95%) [1].
From the above descriptions, the current authors suspected that the cause of this dam accident might be related to the hydraulic fracturing mechanism. There may have been discontinuities in the filled soil adjacent to the culvert after the construction process. Moreover, due to the effect of the culvert’s shape, arching action could have occurred on the left side of the dam. With the excavation of a steep slope and a considerable distinction in the elastic modulus between the embankment and the
foundation, arching can become severe. During the first filling of the reservoir, the water pressure grew higher than the normal stresses on both sides of the pipe culvert; the stresses were reduced to a small value by the arching action. Under this condition, the discontinuities acted as the initial cracks that were extended and propagated by the water pressure. This process might have led to the dam failure.
Bottom trench Original ground surface
Crest of parapet wall +33.0m Dam crest +32.2m Normal water level +30.5m
Fig. 1 Longitudinal section and data of nodal points on boundary in numerical model
10.00
Fig. 3 Cross section of culvert
Numerical analysis
1. Purpose of numerical analysis
In recent years, numerical analyses using the finite element method have been widely applied in investigations of the stress-strain distribution and the seepage in dams. In previous studies on the hydraulic fracturing phenomenon in soil or the earth pressure on buried pipes, the finite element method was often used to yield numerical results. These results were then compared with the results of either in-situ observations or laboratory tests. The comparisons showed a good agreement [3], [4]. In this research, therefore, the authors set up a plane stress build-up analysis using the finite element method to simulate the stress-strain state in the
dam. The build-up analysis allows for a better simulation of the influences during construction. The results of the analysis will show the distributions of stress and displacement in the dam, especially at positions adjacent to the conduit, to verify the arching effect.
Table 1 Material properties
Coefficient of permeability (k): 6.247×10⁻⁵ m/s Elastic modulus (E): 16800 kPa