The Impact of Governance on IFRS Restatement Quality
Authors:
Arnt Verriest*
Ann Gaeremynck
Contact Information: Katholieke Universiteit Leuven Etienne Sabbelaan 53
B-8500 Kortrijk
*Contacting Author: [email protected]
First Draft August 2008
Abstract
As prior research mainly focused on the influence of IFRS adoption on accounting quality and its economic effects (Leuz and Verrecchia, 2000; Daske, 2006; Barth et al. 2007; Christensen et al. 2008), this paper examines the impact of corporate governance on the quality of the IFRS restatement process itself. The unique feature of this study is our ability to investigate accounting quality through our focus on three features of the IFRS restatement process: (1) the disclosure quality of the IFRS restatement process; (2) the immediate adoption of an IFRS standard, even though an extended adoption period is allowed; and (3) the earnings management activity by restating financial figures from local GAAP to IFRS. Thereby we hypothesize that in a changing accounting environment, better governed firms will provide a better financial restatement quality. Our results largely confirm this prediction. It turns out that high quality governance firms are more likely to disclose the equity, earnings and cash flow impact of IFRS in detail, are less likely use the extended adoption period of IAS 39 (but only when the effect on equity is negative) and do not engage in earnings management around the time of adoption but instead apply IFRS in a rigorous manner. Interestingly, the composition of the board and the quality of the audit committee in particular determine the quality of IFRS restatements.
Key Words: International Accounting, IFRS Restatements, Corporate Governance, Disclosure, IAS39, Earnings Quality
JEL classifications : G14, G15, G30, M38, K22
1. Introduction
This study investigates the impact of corporate governance on the quality of the IFRS restatement process. The quality of the restatement process is assessed by three of its components: (1) the disclosure quality of the restatement process, (2) the immediate adoption of IAS39, even if an extended adoption period is allowed, and (3) the earnings management activity around the time of IFRS adoption.
The adoption of IFRS was made mandatory by the European Commission from 1 January 2005 onwards. Under IFRS 1 firms are required to restate their previous year’s financial figures in accordance with IFRS for reasons of comparability and to allow investors to evaluate performance over time. In practice, this means that financial figures are available using local and IFRS numbers for the year 2004. Furthermore, next to doing the restatement, companies are required to disclose a detailed explanation in the notes of the main adjustments made due to the IFRS transition. Finally, with the introduction of IFRS the EU allowed an extended adoption period for IAS 39, i.e. immediate application in 2004 or postponement of the application until 20051. This change in the accounting environment from local to international standards, with a choice for application of IAS 39, offers us the possibility to evaluate the quality of the restatement process on several distinct aspects: the quality of disclosure, the immediate application or the use of the extended adoption period and the earnings management behaviour in this transition phase.
Prior research mainly focuses on the question whether the introduction of IFRS led to real economic effects, by investigating its market (Leuz and Verrecchia 2000; Daske 2006) as well as its accounting consequences (Barth et al. 2007; Christensen et al. 2008). Barth et al. (2007) find significantly positive effects of IFRS with respect to
1 The IAS39 standard deals with the recognition and valuation of financial instruments and turned out
the value relevance, accrual quality and conservatism component of earnings. Building further on this literature, this paper investigates not only whether IFRS results into a better accounting quality but also evaluates the accounting quality of the restatement process itself. This is done by comparing hand-collected local GAAP data with IFRS financial information for a constant sample of 152 listed European manufacturing and service firms from the MSCI Pan Euro Index. The use of hand-collected data in this context enables us to provide an answer to the following questions: (1) Is the restatement process itself used to manipulate earnings? (2) If there is an application choice for a particular standard, do firms apply this standard immediately or not? (3) To what extent do firms disclose information about the restatement process? (4) What is the role of corporate governance in this restatement process? We contribute to IFRS literature by investigating the quality of the restatement process itself and by searching for potential determinants. Furthermore, an appealing feature of our study is the combination of a disclosure element, an early adoption issue of a new standard and an earnings quality component in one setting2. Finally, building on previous studies investigating the link between financial statement quality and corporate governance, we focus on the role of governance in an accounting change process for a diverse spectrum of accounting quality proxies.
Our descriptive results show a significant relation between corporate governance quality, disclosure quality of IFRS restatements and the level of earnings management in the restatement phase. In a second step we analyse each of these three components separately. We find significant evidence that governance quality is positively associated with disclosure quality. Next, we show that firms with high quality governance are more likely to adopt IAS39 in a timely manner, only when the impact of the standard on equity is negative. If not so, there is no relation between early adoption choice and governance. Finally, we report findings consistent with the notion that earnings management activity is less prevalent in environments with high
2 Horton and Serafeim (2007) notice significant differences between firms with respect to the timing
quality governance. Board independence, board functioning and quality of the audit committee in particular appear to be important single governance indicators in explaining differences in restatement quality across firms. Evidence for our hypothesis is confirmed when we introduce the financial and insurance companies in the sample. These results hold when accounting for possible endogeneity issues. Finally, in order to assess the overall quality of the restatement process we use the benefit-of-the-doubt method (Cherchye et al., 2008) to aggregate the three components in one score. We report an average overall quality of the restatement process of 82.5%.
The remainder of the paper is structured as follows. Section 2 reviews relevant prior literature and builds the hypothesis. Section 3 discusses the sample selection. Section 4 provides variable definitions and Section 5 the descriptive statistics. Section 6 presents regression results. Section 7 provides results on extensions. Section 8 concludes the study.
2. Literature and motivation
adoption and real economic effects are more likely to occur in strong institutional environments (Ball et al., 2003; Burgstahler et al., 2006; Daske et al., 2008).
In assessing earnings quality effects, Barth et al. (2007) compare earnings management, timely loss recognition and value relevance pre and post IFRS using a constant sample of firms. They find that the variability of net income and the variability of net income relative to cash flows increase around the time of IFRS adoption, suggesting an improvement in accounting quality. Building on this study and further contributing to IFRS literature, this paper investigates whether IFRS results into a better accounting quality around the time of IFRS adoption, and not after the adoption. In other words, we evaluate the quality of the accounting
restatement process itself. We do so by comparing local GAAP figures with IFRS figures for a constant sample of large European firms using financial data from one and the same fiscal year. As a consequence, we can produce a clean measure of the level of earnings management when IFRS is applied for the first time. Furthermore, this approach allows us to answer research questions that have not been studied yet in IFRS literature, such as: (1) Do firms use the restatement process itself as a means to manage earnings? (2) If an extended adoption period for a certain standard is allowed, do firms apply this standard early or not? (3) Is this choice opportunistically done? (4) How detailed do firms disclose restatement information? (6) What is the impact of corporate governance on the quality of this restatement process? Next to the feature of investigating the quality of the restatement process itself, our study combines a disclosure issue, an early adoption issue of a new IFRS standard and an earnings management issue in one setting, which is quite unique in our mind3.
Specifically, we focus on corporate governance as a potential driver of restatement quality, next to the role of country governance. While the impact of country governance has been documented in literature (e.g. Daske et al., 2008), firm-specific governance has been far less the subject of investigation. However, corporate
3 Horton and Serafeim (2007) notice significant differences between firms with respect to the timing
governance mechanisms and structures are potentially important determinants of accounting quality (e.g. Klein, 2002; Larcker et al., 2007). Therefore, in this study we mainly focus on the impact of corporate governance on restatement quality, thereby controlling for country-specific governance measures.
Corporate governance is typically defined as a set of structures that monitor a firm’s operations (Shleifer and Vishny, 1998; Larcker et al., 2007) and limits agency problems, originating from the separation of ownership and control within a firm. Agency problems between insiders and outsiders can be limited by providing more transparent information. Prior literature has documented that effective governance mechanisms are positively associated with disclosure quality (e.g. Karamanou and Vafeas, 2005; Marques, 2006) and earnings quality, although results are rather weak in some cases (Larcker et al., 2007). Klein (2002) and Chtourou et al. (2001) find a negative association between earnings management and corporate governance measures such as board independence and functioning of the audit committee. Fan and Wong (2002) report significant negative relations between earnings quality and a firm’s degree of ownership concentration. DeFond and Jiambalvo (1991) report that the overstatement of earnings is less likely among firms with audit committees. Evidence on the impact of corporate governance on the early adoption of a new accounting standard is non-existent although previous literature shows that early recognition of a new accounting standard is encouraged when it results into an increase in earnings (Langer and Lev, 1993 and Amir and Ziv, 1997a and 1997b). In sum, we contribute to literature by investigating the impact of corporate governance on accounting quality in a changing accounting environment (i.e. the mandatory adoption of IFRS), thereby considering a broader spectrum of accounting quality proxies. This results in the following hypothesis:
extended adoption period; and (3) lower incentives to manage earnings around the time of adoption.
3. Sample design and data
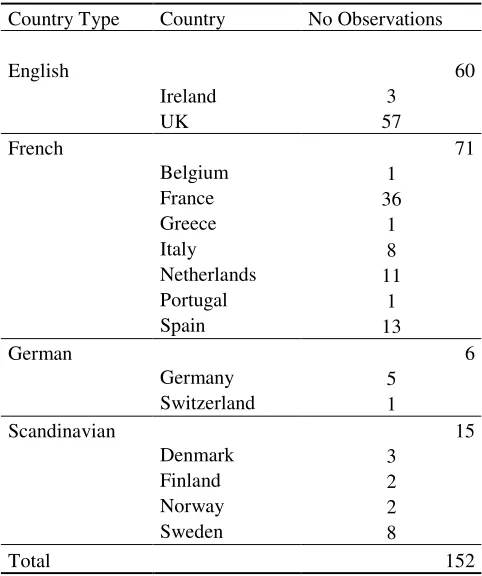
The sample we use to investigate our hypothesis contains all companies which are part of the MSCI Pan Euro Index over the period January 1st 2005 until June 30th 20064. From the initial sample of 299 firms, 89 financial and insurance firms are eliminated due to specific industry characteristics. Furthermore, 39 early IFRS adopters and 15 US GAAP are withdrawn as no IFRS restatement information is available for the year 2004. Finally, 4 firms are eliminated due to lack of IFRS restatement information. This results in a final sample of 152 firms shown in Table 1. The majority of firms belong to the French (71) or the English (60) institutional oriented environment.
To provide information to different stakeholders about the impact of IFRS on accounting numbers, firms have different communication channels. In this study, the quality of the IFRS restatement process is assessed using the financial statements since the latter remains an important public channel for providing information to different stakeholders (Chang et al., 2007). Furthermore, as the information provided in the annual report is audited, this information source guarantees a high level of reliability (Francis and Wang, 2007).
As stated in our hypothesis, we assess the quality of the restatement process by means of three different elements. While electronic databases such as Thomson Datastream could be used to measure the earnings management behaviour around the IFRS restatement as well, information on the disclosure quality and on the immediate application of IAS standards can only be gathered using the hard copy version of the
4 The MSCI Pan-Euro Index contains 287 securities with a free float-adjusted market capitalization of
financial statements5. On order to be consistent in the information source used for each of the three components, we collect all information on the restatement process from the hard copy version of the financial statements. Finally, as IFRS became compulsory in 2005 and early appliers are eliminated from the sample, the notes of financial statements from the year 2005 are the main source to evaluate the quality of the restatement process6. As only for the year 2004 local and IFRS figures are available reflecting the same economic event, the 2004 data will be used to evaluate the quality of the IFRS restatement process.
To test for corporate governance as a determinant of restatement quality, we consider the corporate data base from Risk Metrics (formerly known as the Deminor database) which contains detailed corporate governance information for the MSCI Pan Euro Index7. The rating is based on more than 300 corporate governance criteria and the maximum score is 40. Appendix A provides a detailed overview of the different items included in the corporate governance score.
4. Model development
To answer our research question, we develop a regression model in which corporate governance (CORPGOV) is linked to the different proxies for the quality of the IFRS restatement process (QRIFRS). The general form is the following one:
i i i
i CORPGOV ControlVar iables
QRIFRS =α +β1 +β2 +ε (1).
5 Although restated figures are available in Datastream in most cases, they contain a serious amount of
error.
6 For firms not voluntarily adopting IFRS with a fiscal year-end not equal to 31st of December, the
pre-adoption year is 2004, the transition year is 2005 and the adoption year is 2006. From now on we refer to the pre-adoption, transition and adoption year as being 2003, 2004 and 2005 for all firms in the sample.
7 Deminor Ratings have been used in prior studies such as Bauer et al., (2004), Van der Bauwhede and
CORPGOV stands for the company corporate governance rating from Risk Metrics of 20048. Based on previous literature (Klein, 2002; Karamanou and Vafeas, 2005; Larcker et al. 2007) we predict a positive coefficient for the corporate governance variable, as governance has the purpose to decrease asymmetry in information by providing more transparent and accurate information.
Our dependent variable QRIFRS either measures (1) the quality of the disclosure on IFRS restatements (DISCL), (2) the early adoption of IAS39 (EARLYADOP) or (3) the use of the restatement process to manage earnings (DIFFACC). Consequently, we define three separate regression models. In our core analyses, we prefer testing separate regression models above one aggregated model, as control variables differ across our three restatement quality measures. In sensitivity analyses, we use the benefit-of-the-doubt method to aggregate these three quality elements to aggregate them into one overall restatement quality score (also referred to as QRIFRS).
To measure the disclosure quality of the restatement process, we construct a disclosure score based on quantitative information about the IFRS restatement process in the first regression. The disclosure index is based on 5 items relevant for financial statements users: the effect on the (1) net income of IFRS in 2004 (2) the book value of equity at the beginning of 2004 (= book value at the end of 2003), (3) the book value of equity at the end of 2004, (4) the total revenues or sales of 2004 and (5) the operating cash flow of 20049. We choose to focus on net income and equity as these two measures are frequently used for valuation purposes. Moreover, firms were mandated by IFRS 1 to provide information on the restatement of these financial items. Conversely, disclosure on cash flow and sales restatements was to a large extent voluntary. However, in our opinion restatement information on these
8 Results prove to be robust for using 2004 or 2005 ratings. This is not surprising, as corporate
governance tends to be rather ‘sticky’ over time. For 10 observations the corporate governance rating of 2005 has to be used as the 2004 rating was not available. Regression results remain qualitatively the same without those 10 observations.
9 In the disclosure index equity is considered twice as important as the other two items, net income
items is potentially important for investors and other stakeholders. Operating cash flow is an important alternative performance measure for net income. The sales figure is also relevant, because it determines the size of a firm’s market share. In this respect, our disclosure score consists of mandatory (net income and equity figures) and voluntary disclosure items (cash flow and sales figures).
To receive a ‘1’ for one of those items, a firm has to allocate the differences between the IFRS and the previous local GAAP number to the each specific international standard provoking (part of) this difference. In other words, the mere disclosure of the difference between the two numbers on itself (which is required under IFRS 1) is not sufficient to receive a ‘1’ for that specific item. The disclosure of the restatement information for net income and book value of equity done by the Spanish company Grupo Ferrovial is depicted in Appendix B as a ‘best practice’ example. We define this score as DISCL.
Based on previous literature, we introduce both country and firm control variables in the disclosure model. Most notably, we construct a composite indictor IPR using 4 institutional variables from LaPorta et al. (1998 and 2006) to control for country-specific differences in the institutional environment (see Appendix C for methodological details on composite indicators and a definition of the single institutional variables capturing investor protection). In this case, we prefer a composite indicator above the use of single indicators because it provides us with a more accurate institutional measure (Cherchye et al., 2008). Among others, it helps us to avoid multicollinearity problems between different institutional variables.
(OWNDIFF) and a US GAAP dummy variable (US GAAP). Finally, we introduce industry dummies in the disclosure model to control for industry effects (INDUSTRY). The subsequent regression model testing disclosure looks as follows:
i
The second aspect of IFRS restatement quality under consideration is the choice of early application of IAS39 in 2004. This quality aspect is defined as EARLYADOP. If a firm immediately applies the IAS 39 standard in 2004, the EARLYADOP gets a value of 1. A value of 0 is assigned if the firm prefers the extended adoption period and only applies the standard for the first time in 200510.
In this case, our main variable of interest remains CORPGOV. Further, we introduce a variable that measures the signed impact of IAS39 on equity (IMP(IAS39)). We expect a positive sign because the higher IMP(IAS39), the more likely IAS39 will be applied immediately. Consistent with the previously developed early adoption models (Langer and Lev, 1993; Amir and Ziv, 1997a and 1997b), and the disclosure model, the total IFRS effects on net income and on equity are introduced in the model, together with firm-specific control variables. Subsequently, we test the following regression model: who compare the accruals in the year of adoption using IFRS with accruals in the pre
10 Additionally, as a robustness check, we provide firms that experience a negative impact on equity
adoption year using local standards, we employ hand-collected data from one and the same fiscal year (the transition year 2004). Measuring accruals under IFRS and under local GAAP for 2004 provides us with a cleaner estimate of earnings management behaviour around the time of adoption11. Following Leuz et al. (2003), Francis and Wang (2007) and Daske et al. (2007), we consider both the signed and unsigned difference in magnitude of accruals calculated under local GAAP (|ACCLocalGaap(0)|/|TALocalGaap(0)|) and calculated under IFRS (|ACCIFRS(0)|/|TAIFRS(0)|)
to assess earnings management behaviour12. To calculate the signed difference in accrual magnitude, we subtract local GAAP accruals from IFRS accruals. A higher level for this difference is considered as an indication of more earnings management when firms restate. When considering the unsigned difference, we interpret larger difference values as evidence of a more rigorous application of IFRS for the first time. Firms showing practically no difference between their accruals under IFRS and local standards are suspected to use the discretion available under IFRS. We define this third quality measure of the restatement process as DIFFACC (signifying the signed difference) and |DIFFACC| (signifying the unsigned difference).
Two important remarks have to be made with respect to the DIFFACC measures. First, accruals under IFRS are based on net income figures excluding any influence from IAS39 because the early application influences the amount of accruals. Second, accruals are calculated as net income minus net operating cash flows and scaled by the firm’s total assets as done in Hribar and Collins (2002).
Similar to our previous models, the composite indicator IPR is introduced as an institutional measure. Control variables are also similar to the disclosure and the early adoption model except for the variable ACC(PREADOP) indicating the level of
11 When comparing accruals of different years with each other, the amount of accruals can be different
not only because of a change in the accounting standards but also because of economic transactions. By investigating differences in accruals of the same year, the economic base is the same and the difference in accruals can be more cleanly attributed to the change in accounting standards from local GAAP to IFRS.
12 We choose to scale by total assets from the current year, because these are available under IFRS.
earnings management in the pre-adoption year. Our third regression model looks as
In this respect, we acknowledge that the difference between local GAAP and IFRS accruals is also influenced by the difference between the local GAAP and the IFRS accounting regime, and not only by how serious firms apply IFRS. Therefore, in additional tests we use a two-stage regression to deal with this issue. In a first stage DIFFACC and |DIFFACC| are regressed on the country-level variable DISTANCE, measured as the average rank of the number of inconsistencies and absences that exist between the local standards and IFRS, based on a comparison study of big 4 audit firms (GAAP 2000 and 2001; Wulandari and Rahman, 2004). The larger a country’s DISTANCE, the larger we expect the difference to be between local GAAP accruals and IFRS accruals. In the second step, the residual of the first stage is considered as a proxy for the level of earnings management around the time of IFRS adoption. Results prove to be consistent with our main analysis.
To summarize, Table 2 provides a list of all relevant variables and their definition used in the different models.
5. Descriptive statistics
40. Also, the standard deviation (5.6) and quartile range (11.25) of CORPGOV are quite large indicating a considerable variation in the sample in terms of overall governance quality, despite these being all large and mature firms.
Further, Panel A of Table 3 reveals that NI (the signed impact of IFRS adoption on net income) is positive with an average 1.28% of market value. ABS( NI) is on average 1.62% of a firm’s market value13. BVE is significantly negative with a value of 1.93%. Its magnitude (ABS( BVE)) is quite large with an average of more than 5% of market value. For a quarter of our sample, ABS( BVE) is 7.37% or above, in terms of market value. The median impact of IAS39 on book value of equity (IMP(IAS39)) is slightly positive, but not significantly different from zero (0.13% of market value). ABSIMP(IAS39) reaches an average of 1.4% of market value. As an additional measure, we calculate the impact of IAS39 in 2004 on a firm’s equity/debt ratio, as this standard also influences liabilities. Contrary to the average impact on equity, the mean equity/debt impact is negative as the ratio decreases by an average of 0.83% (not reported). Further, the average firm in our sample is 62 years old (AGE), has a market value above 2 billion USD (MV), a return on assets of 5.67% (ROA), a sales growth of almost 9.3% (SLSGR) and a leverage ratio of 66.68% (LEVERAGE). The average free float is 65.65% (OWNDIFF). Only 4% of the companies previously reported under US GAAP.
Panel B of Table 3 provides median values on country level of the restatement quality, governance indicators and restatement magnitudes. We select country type following La Porta et al. (1998) and distinguish between law systems according to their English, French, German or Scandinavian origin. DISCL is lowest in German countries (2.33 on 5) and highest in the English environment (4.00). Individually, France obtains the highest score (4.39), followed by Ireland (4.33) and the Netherlands (4.18), whereas South-European companies disclose the lowest amount of restatement information. Only 25% of the English law firms apply IAS39 early,
13 We prefer to scale all IFRS effects with market value of the firm as this is the only true scale
while all German firms do so. More interestingly, we discover large differences between countries in terms of DIFFACC. In German countries, accruals are slightly larger under IFRS than local standards resulting in a positive DIFFACC (0.009), while for the UK and Ireland the median difference is negative (-0.013). Regarding French and Scandinavian law countries, the sign of DIFFACC varies across countries but is negative on average (-0.004 in both cases). The unsigned accrual difference is largest for the UK and Ireland once again, indicating that these countries have made the largest restatements.
The following four columns of Panel B depict differences between countries for NI, BVE, ABS( NI) and ABS( BVE). Interestingly, in all countries except Belgium, Greece and Portugal, IFRS adoption leads on average to higher earnings. Conversely, IFRS brings along a lower book value of equity in most countries, as BVE is on average -0.54%. Portuguese firms experience the largest negative effect (-19.35%). In absolute terms, Portuguese and Norwegian firms exhibit the largest ABS( NI) with values of 3.03% and 1.34%, respectively. For most countries, BVE is larger than NI. Overall, we conclude that the impact of IFRS on earnings and equity is considerable in magnitude and varies significantly across countries. We also report corporate and country governance quality figures in Panel B of Table 3. Governance is of a higher quality in a common law environment than in a code law one. Dutch (24.52), French (21.48) and Scandinavian (23.44) companies also give proof of high CORPGOV values. Swiss (14.81), Portuguese (16.53), Greek (18.34) and German (18.51) firms generally engage in low quality corporate governance mechanisms. Investor protection (IPR) is measured by a composite indicator (see Appendix 3 for details). The UK, France and the Netherlands offer the highest investor protection (100%), while Germany, Belgium and Greece score lowest on IPR (below 70%).
only provide details on two items or less (19 out of 152). Three firms do not provide restatement details at all in their annual report.
Panel D of Table 3 reports how firms differ in their choice to early adopt IAS39, depending on the impact the standard has on their book value of equity (left part) and on their equity/debt ratio (right part). Overall, results indicate that the choice of applying IAS39 early is to a large extent driven by the standard’s effect on equity and liabilities. In other words, this result is consistent with the notion of an opportunistic choice. Of all firms for which IMP(IAS39) is smaller than zero, a majority of 71% delays the adoption. This rate is only 43% when the impact is positive. This difference proves to be highly significant (p=0.001). Our results are qualitatively the same when considering the equity/debt ratio (p=0.000).
Panel E of Table 3 compares accrual magnitude and its association with cash flows between local and international standards. These metrics have been used in prior studies (e.g. Barth et al., 2007 and Leuz et al., 2003). Recall that we compare data from one and the same fiscal year. Firstly, mean and median accruals are smaller in magnitude under IFRS than under local GAAP (one-sided p-values are 0.038 and 0.027 respectively), providing evidence for the notion that earnings discretion is lower under IFRS. Secondly, the Pearson and rank correlations between signed accruals and cash flows are more negative under local GAAP than under IFRS indicating less smoothing activity; although differences are not significant (p-values are 0.13 and 0.19).
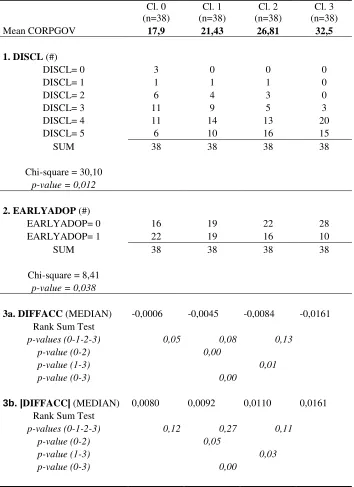
Table 5 provides further univariate support for the relationship between corporate governance and the quality of the IFRS restatement process. In this case, we split the sample into four equally-sized groups depending on the firms’ governance ratings. Class 0 contains the quarter of the sample with the worst governance ratings (mean CORPGOV is 17.9), while we classify companies with the highest governance quality in class 3 (mean CORPGOV is 32.5). Results shown in Table 5 confirm our hypothesis, as firms in class 3 provide the most detailed financial restatements (DISCL is 4 or 5 on 5 in 92% of the cases) and exhibit the largest declines in total accruals (median DIFFACC equals -1.61% of total assets). Contrary to our prediction, firms in class 3 adopt IAS39 early in only 26% of the cases, whereas this percentage is 58% for class 0 firms. Most British firms do not adopt the financial standard in a timely manner. For class 0 firms, the median DIFFACC is not significantly different from zero (-0.06% of total assets) and the median |DIFFACC| is lower as compared to better governance firms (0.8%). In classes 1 and 2, the difference is significantly negative (resp. -0.45% and -0.84%), but not of the same magnitude as class 3. Differences between all classes are significant in most cases. These results support the notion that in firms with low quality governance mechanisms managers use the discretion provided under IFRS to manipulate financial statements. Mean figures confirm this result as can be derived from the second part of Table 5.
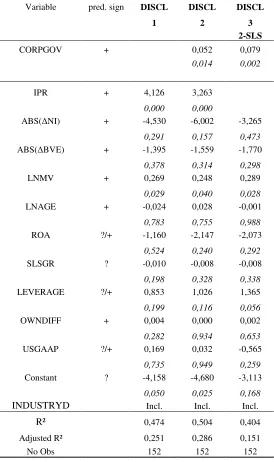
6. Regression results
ABS(∆BVE) does not influence the quality of the disclosure on the restatement process. It does not come as a surprise that several control variables are insignificant in explaining this disclosure variable. We do not consider all information a firm is disclosing, but only that fraction of the annual report dealing with the IFRS transition process.
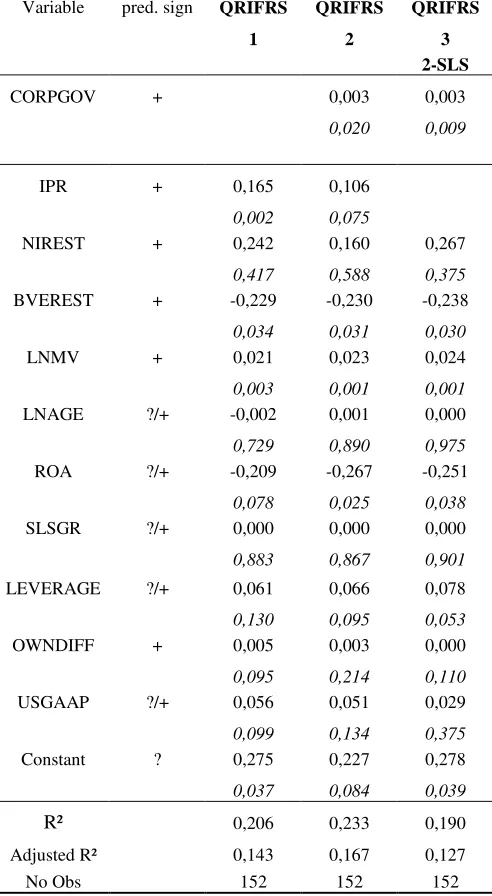
In the third specification, a two stage least square model (2-SLS) is used to control for possible endogeneity problems found in previous corporate governance studies (Bhagat and Black, 2002; Durnev and Kim, 2005; Black et al., 2006). In a reduced form equation (5), we choose country-level characteristics (captured by country dummy variables) as instruments, similar to Klapper and love (2004)14. Afterwards, in the second stage, CORPGOV is replaced by its predicted value from the first stage represented by equation (5). As a consequence, IPR is left out of the model, because country effects are already introduced as instruments in the first stage. CORPGOV carries, consistent with our expectations, a significantly positive coefficient (p=0.002).
The results are robust for adding other variables, such as market to book value (as an alternative performance or growth measure), capital intensity, intangible assets, internationality (measured as the percentage of foreign sales on total sales) and a dummy variable for early adopters. Auditor type is not considered since all sample firms have BIG 4 auditors.
14 The reduced form equation from the first stage looks as follows:
i c c
i COUNTRYDUMMY
CORPGOV=α+∑β +ε (5).
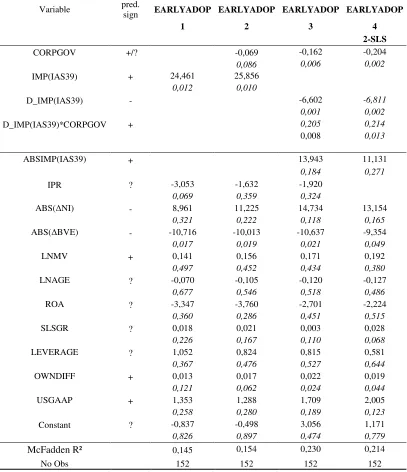
Results for the early adoption model are depicted in Table 7. In the control model (first specification), we notice that the signed impact of IAS39 on equity, IMP(IAS39), is a significant driver of the early adoption choice (p=0.012). This finding is consistent with results found in Panel D of Table 3 and robust for the use of the signed impact of IAS39 on the equity-debt ratio. In the second specification, CORPGOV has a marginally significant negative coefficient (p=0.086). At first sight, this finding looks counterintuitive as better governance firms are a priori expected to early adopt the standard. Looking closer, this result is due to the large number of British firms present in our sample and reluctant to apply IAS39 early.
In the third specification, IMP(IAS39) is dropped and replaced by a dummy variable (D_IMP(IAS39)) that equals 1 if the firm experiences a negative impact on its book value of equity from applying IAS39, and zero if the equity effect is positive. An interaction variable between CORPGOV and D_IMP(IAS39) measures how governance incrementally influences the choice of early adoption for firms having a negative effect. We expect the coefficient on the interaction variable to be positive as we hypothesize that high governance quality firms will be more willing to apply the standard early, even if these firms have an incentive not to, as opposed to firms with worse governance practices. In addition, the unsigned IAS39 impact is included as a control variable in specifications 3 and 4 (ABSIMP(IAS39)).
and predictions, the impact dummy remains negative (p=0.002) and the interaction variable continues to show a significantly positive coefficient (p=0.013). Overall, regression results shown in Table 7 illustrate the positive impact of the quality of corporate governance in the choice to early apply IAS39 when its impact on equity value is negative.
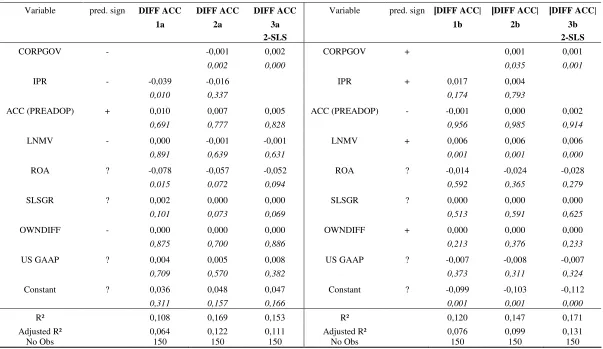
Finally, in Table 8 the results for the earnings management model (4) are shown. In Panel A (Panel B), we report regression results with DIFFACC (|DIFFACC|) as dependent variable. In each test we drop extreme values of DIFFACC (1% on each side), because they may have unwanted effects on estimated coefficients. Results do not change when leaving these extremes in the sample. Recall that we interpret higher (lower) values of DIFFACC (|DIFFACC|) as more earnings management and a less accurate or rigorous first time application of IFRS.
In the first specification of Panel A, the coefficient on IPR is significantly negative (p=0.010). Control variables are not significant in most cases. In the second specification the coefficient on CORPGOV is negative as predicted (p=0.002). This result confirms the notion that better corporate governance leads to a more rigorous application of IFRS. The adjusted R² value rises from 6.4% to 12.2% when including CORPGOV in the model. Entering the predicted governance score from the reduced equation (2-SLS), confirms the result as the coefficient on CORPGOV carries a negative and highly significant coefficient (p=0.000).
of caution15. Further, the use of accrual measures for earnings quality has always been up for debate in accounting literature (e.g. Guay et al., 1996).
7. Additional analyses
A drawback of previous analyses is each of the three elements of financial restatement quality is estimated separately. Therefore, it is difficult to obtain an overall measure of a firm’s restatement quality. In this first of four additional analyses, we test a model that explains variation in overall restatement quality, assessed by means of composite indicators. An appealing feature of the use of composite indicators is that restatement quality is measured by means of one single figure capturing information from multiple relevant characteristics. We apply the benefit-of-the-doubt methodology to construct the indicators, using flexible weighting (see also Cherchye et al, 2008). In Appendix C we provide details on this procedure.
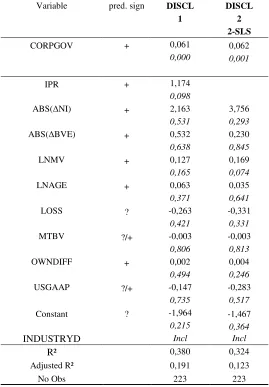
The outcome of the analysis is QRIFRSi, a variable between 0 and 1, where higher values signify a better overall restatement quality. The average firm attains an overall restatement quality of 82.5%, indicating that the average firm is 17.5% removed from the best restatement quality firms. The median overall restatement quality is 83%, the minimum 43% and the maximum 100%. We test a tobit specification as the composite indicator varies between 0 and 1. We execute the regression with CORPGOV as our main variable of interest, in addition to the common control variables used in the three previous analyses. In the control model shown in Table 9, IPR (p=0.002), LNMV (p=0.003), USGAAP (p=0.099) and OWNDIFF (p=0.095) are significant variables, all carrying the predicted signs. The second regression and the 2-SLS regression confirm our hypothesis: CORPGOV carries a significantly
15
positive coefficient (p=0.020 and p=0.009). Also, the introduction of CORPGOV leads to an increase in R² of almost 3%.
All of the previous analyses were done with nonfinancial firms, as it is difficult to measure earnings quality in a comparable way for financial, insurance and nonfinancial companies. However, as financials represent 28% of the initial sample, the disclosure and the early adoption model are rerun for the total sample of 223 firms (18 from the 89 financial and insurance firms disappear due to the lack of restatement data). We even expect more significant results as financial firms usually experience a larger impact from IAS39. Control variables differ somewhat because certain variables are not comparable between financial and nonfinancial firms. We replace SLSGR and ROA by respectively market-to-book value (MTBV) and a loss dummy (LOSS). LEVERAGE is dropped16.
Panel A of Table 10 reports the results of the disclosure model for the total sample. It should be noted that in this case DISCL is a firm-specific disclosure score on 4 instead of 5. Disclosure of the IFRS impact on total revenues is not considered in this case because these are less relevant for financial firms and less comparable with nonfinancial firms’ sales numbers. As expected, the significance of the CORPGOV further increases with or without control for endogeneity. Panel B of Table 10 shows the EARLYADOP results for the full sample. Again, we find evidence stroking with our research hypothesis. For firms possessing higher quality governance mechanisms, disclosure on IFRS restatements appears significantly higher and the early adoption of IAS39 is more likely, when the impact on equity is negative. Moreover, results prove to be stronger than those previously reported in Tables 6 and 7. Finally, results are confirmed by the two stage approach accounting for a possible endogeneity problem.
As a third extension, we investigate how the four categories of corporate governance quality each explain variation in restatement quality. The governance ratings contain
criteria from 4 categories of governance mechanisms: (1) shareholders’ rights and duties, (2) range of takeover defences, (3) board structure and functioning and (4) disclosure on corporate governance (for details see Appendix A). A priori, we predict a significant impact from the shareholders rights’ rating and from the board structure and functioning rating (Chtourou et al., 2000 and Bhagat and Black, 2002). Furthermore, we predict board independence and the quality and functioning of the audit committee to be the most important single drivers of these two corporate governance indicators (Klein et al., 2002; Dechow et al., 1996; DeFond and Jiambalvo, 1991)17.
Our results (not shown in tables) convey that in the second stage, in which the preceding first stage is still equal to equation (5), board functioning is highly significant in explaining the level of DISCL. In determining EARLYADOP, board characteristics turn out to be the most explicative variable of all four ratings, as its interaction coefficient with D_IMP(IAS39) is positive and significant in the second stage. Further, investigating specific governance indicators reveals that the proportion of independent directors has the highest impact on DISCL and DIFFACC. In comparison with board structure indicators, board functioning measures are less significant in explaining DISCL, but highly significant in determining EARLYADOP. The separation of CEO and chairman of the board does not appear to be significant. Consistent with our predictions, we find a significantly positive (respectively negative) association between the quality of the audit committee and DISCL (respectively DIFFACC). The size, workings and composition (i.e. independence) of the audit committee all turn out to be the most relevant single corporate governance determinants of IFRS restatement quality.
In a final extension, we investigate the disclosure of IAS39 effects for the 85 late adopters. These firms are required to report the impact of the financial standard on their equity value at the beginning of 2005. As it turns out, these firms disclose this information in a varying degree of accuracy, once again. We investigate the
17 We are restricted to use 2005 data for these specific governance indicators, as detailed governance
disclosure quality of this specific item and to which extent governance plays a role in this particular disclosure process. We make a distinction between four disclosure levels of IAS39 effects. Firms reporting the impact on each balance sheet item and making the impact immediately visible on their key financial statements (i.e. on the balance sheet, not in the notes of the 2005 annual report) represent the highest disclosure class. Firms reporting the impact of IAS39 only on book value of equity, but disclosing the impact on the balance sheet construct the second class. Firms reporting on IAS39 effects only in their notes are placed in the third class. The last class contains firms that report nothing about the impact of the financial standard. The number of firms in each class is 14, 42, 23 and 6, going from the highest to the lowest disclosure group. Consistent with predictions, our results (not shown in tables) convey that governance quality plays a significant role in determining disclosure quality on the impact of IAS39.
8. Conclusion
This study documents on the properties and determinants of the quality of the IFRS restatement process. While previous literature mainly focused on the accounting quality and economic consequences of the IFRS, this paper studies the quality of the IFRS restatement process itself. This process provides us with a unique setting to further investigate IFRS adoption since two sets of financial statements under local GAAP and IFRS are available for one and the same fiscal year. Around the adoption timing, firms have to make choices about the level of disclosure on the restatement process, the early adoption of IAS39 or not, and the extent to which they use the restatement process as an opportunity to manage earnings. In particular, we investigate to what extent corporate governance influences the outcome of the restatement process.
Regression results further confirm our hypothesis that well governed firms (i) disclose more information on restatement process, (ii) choose to adopt IAS39 early, but only when experiencing a negative impact from this standard, and (iii) engage less in earnings management around the time of adoption and apply IFRS more seriously. Furthermore, results hold when financial companies are added to the sample. Finally, board functioning, board independence and quality of the audit committee turn out to be significant drivers of the quality of the restatement process.
Our results are potentially interesting for policy makers. If new IFRS standards are introduced leaving firms a choice to apply them or not, standard setters may expect firm to choose opportunistically, especially those lacking governance quality. Our study also shows that corporate governance can fulfil the role of an enforcement mechanism in a reporting change process.
References
Amir E. and A. Ziv (1997a) “Economic consequence of alternative adoption rules for new accounting standards” Contempory Accounting Research, Vol 14, pp. 543-68. Amir E. and A. Ziv (1997b) “Recognition, disclosure or Delay: Timing the adoption of SFAS NR 106”, Journal of Accounting Research, Vol. 35, pp. 61-81.
Archambault, J.J., and Archambault, M.E., (2003) “A multinational test of determinants of corporate disclosure”, The International Journal of Accounting, 38, 173-194.
Ashbaugh, H., and M. Pincus (2001), “Domestic Accounting Standards, International Accounting Standards, and the Predictability of Earnings”, Journal of Accounting Research 39, 417–434.
Ball R., S.P. Kothari and A. Robin (2000), “The Effect of International Factors on Properties of Accounting Earnings”, Journal of Accounting and Economics 29, 1-52. Ball, R., Sadka, G. and Robin, A. (2006) "Is Financial Reporting Shaped by Equity Markets or by Debt Markets? An International Study of Timeliness and Conservatism", Working Paper.
Barth, M.E., W.R. Landsman and M.H. Lang (2007), “International Accounting Standards and Accounting Quality”, Working Paper, Stanford University and University of North Carolina.
Bartov, E., S.R. Goldberg, and M. Kim (2005) “Comparative value relevance among German, U.S., and International Accounting Standards: A German stock market perspective”, Journal of Accounting, Auditing and Finance 20(2): 95-119.
Bauer, R., Günster, N., Otten, R. (2004) “Empirical evidence on corporate governance in Europe: The effect on stock returns, firm value, and performance”, Journal of Asset Management 5, 91-104.
Bhagat, S. and B. Black (2002) “The non-correlation between board independence and long-term firm performance”, Journal of Corporate Law 27, 231-272.
Burgstahler, D.C., L. Hail, and C. Leuz (2006), “The Importance of Reporting Incentives: Earnings Management in European Private and Public Firms”, The Accounting Review 81, 983–1017.
Christensen, Hans Bonde Lee, Edward and Walker M. (2007), "Do IFRS/UK-GAAP Reconciliations Convey New Information?" International Journal of Accounting Chtourou, M., Bedard, J. and Courteau, L. (2001), "Corporate Governance and Earnings Management", working paper.
Daske, H. (2006) “Economic Benefits of Adopting IFRS or US-GAAP – Have the Expected Costs of Equity Capital really decreased?” Journal of Business Finance & Accounting 33, 329–373.
Daske, H., Hail, L., Leuz, C. and Verdi, R. "Adopting a Label: Heterogeneity in the Economic Consequences of IFRS Adoptions" Working paper.
Daske, H., Hail, L., Leuz, C. and Verdi, R. "Adopting a Label: Heterogeneity in the Economic Consequences of IFRS Adoptions" Working paper.
Dechow, P., and I. Dichev. 2002. The quality of accruals and earnings: The role of accrual estimation error. The Accounting Review 77: 35-59.
DeFond, and C. W. Park. 2001. The reversal of abnormal accruals and the market valuation of earnings surprises, The Accounting Review 76 (July): 375-404.
Diamond, D. and Verrecchia, R., 1991, Disclosure, Liquidity and the cost of capital, Journal of Finance 46, 1325-1360.
Fan, Joseph P. H., and T. J. Wong. 2002. Corporate ownership structure and the informativeness of accounting earnings in East Asia. Journal of Accounting and Economics 33 (August): 401–26.
Francis J.R., and D. Wang. 2007. The joint effect of investor protection and big 4 audits on earnings quality around the world. Contemporary Accounting Research (forthcoming).
GAAP 2000: A survey of national Accounting rules in 53 countries. Arthur Andersen, BDO, Deloitte Touche Tohmatsu, Ernst and Young International, Grant Thornton, KPMG, and PricewaterhouseCoopers; editor: Nobes, C.W.
GAAP 2001: A survey of national Accounting rules in 53 countries. Arthur Andersen, BDO, Deloitte Touche Tohmatsu, Ernst and Young International, Grant Thornton, KPMG, and PricewaterhouseCoopers; editor: Nobes, C.W.
Hail, L. and C. Leuz (2006). International Differences in Cost of Equity Capital: Do Legal Institutions and Securities Regulation Matter? Journal of Accounting Research 44, 485-531.
Healy, P, and Palepu, K (2001). "Information asymmetry, corporate disclosure, and the capital markets: A review of the empirical disclosure literature", Journal of Accounting and Economics 31, 405-440.
Horton, Joanne and Serafeim, George, "Market Reaction & Valuation of IFRS Reconciliation Adjustments: First Evidence from the UK", Working Paper.
Hribar, P., and D.C. Nichols. “The use of unsigned earnings quality measures in tests of earnings management.” Working Paper. Cornell University, 2006.
Hung, M. (2001). Accounting Standards and Value Relevance of Financial Statements: an International Analysis. Journal of Accounting and Economics, 30(3), pp. 401-420.
Hung, M., and K.R. Subramanyam, 2007, Financial Statement Effects of Adopting International Accounting Standards: The Case of Germany, Review of Accounting Studies, forthcoming.
Jaggi B. and P. Low (2000). Impact of Culture, Market Forces, and Legal System on Financial Disclosures. The International Journal of Accounting, 35(4), pp. 495-519. Jensen, M.C. and Meckling, W.H. (1976), ‘Theory of the firm; managerial behavior, agency costs and ownership structure’, Journal of Financial Economics, 4(3), pp. 305-360
Karamanou, I. and N. Vafeas (2005) ‘The association between corporate boards, audit committees and management earnings forecasts: an empirical analysis’, Journal of Accounting Research, Vol. 43, N. 3, pp. 453-486.
Klapper, L., Love, I., 2004. Corporate governance, investor protection, and performance in emerging markets. Journal of Corporate Finance 10, 703-728.
Klein, A. (2002) ‘Audit committee, board of director characteristics and earnings managements’,Journal of Accounting and Economics, Vol. 33, pp. 375-400.
Langer, R. and B. Lev (1993), ‘The FASB’s Policy of Extended Adoption for New Standards: An Examination of FAS Nr 87,’ The Accounting Review, Vol. 68, pp. 515–33.
La Porta, R., F. Lopez-De-Silanes, A. Shleifer and R. Vishny (1997). Legal Determinants of External Finance. Journal of Finance, 52, 1131-1150.
La Porta, R., F. Lopez-De-Silanes, A. Shleifer and R. Vishny (1998). Law and Finance. Journal of Political Economy, 106(6), 1113-1154.
La Porta, R., F. Lopez-de-Silanes, A Shleifer, AND R. Vishny. (2000) “Investor protection and corporate governance.” Journal of Financial Economics 58 (October/November 2000): 3-27.
La Porta, R., F. Lopez-de-Silanes, AND A Shleifer. “What works in securities laws?” Journal of Finance 61 (February 2006): 1-32.
Lambert, R.A., C. Leuz, and R.E. Verrecchia, 2007b, Information Asymmetry, Information Precision, and the Cost of Capital, Working paper, University of Pennsylvania and University of Chicago.
Leuz, C. (2003). IAS versus US GAAP, Information Asymmetry-Based Evidence from Germany’s New Market. Journal of Accounting Research, Vol. 41, No. 3 (June), pp. 445-472.
Leuz, C., D. Nanda and P.D. Wysocki (2003). Earnings Management and Investor Protection: An International Comparison. Journal of Financial Economics, Vol. 69, pp. 505–527.
Leuz, C., and R.E. Verrecchia, 2000, The Economic Consequences of Increased Disclosure, Journal of Accounting Research 38, 91–124.
Marques, A. (2006) ‘SEC interventions and the frequency and usefulness of non-GAAP financial measures’, Review of Accounting Studies, forthcoming.
Renders, A. and A. Gaeremynck (2008), A Cross-country Study of the Impact of Corporate Governance on Company Performance, Working Paper.
Shleifer, A., Vishny, R., 1997. A survey of corporate governance. Journal of Finance 52, 737-783.
Vander Bauwhede H and M. Willekens (2008). Disclosure on corporate governance in the European Union, Corporate Governance.
Van Tendeloo, B., and A. Vanstraelen, 2005, Earnings management under German GAAP versus IFRS, European Accounting Review 14, 155–180.
Table 1: Sample Outline
Country Type Country No Observations
English 60
Ireland 3
UK 57
French 71
Belgium 1
France 36
Greece 1
Italy 8
Netherlands 11 Portugal 1
Spain 13
German 6
Germany 5
Switzerland 1
Scandinavian 15
Denmark 3
Finland 2
Norway 2
Sweden 8
Table 2: Variable Definitions income of transition year, book value at the end of pre-adoption year, book value at end of transition year and operating cash flow of transition year) of which detailed IFRS restatement information is provided; maximum score is 4. An example is provided in Appendix B. = Dummy variable taking the value of 1 for firms early adopting IAS 39.
= |ACCIFRS(0)|/|TAIFRS(0)| - |ACCLG(0)|/|TALG(0)|, with ACCIFRS(0) calculated as restated criteria; maximum score attainable is 40; see Appendix A.
= Composite indicator measuring investor protection on country level. For measurement of the composite indicators, see Appendix C for details.
NI
= Net income of the transition year under IFRS minus net income under local GAAP, scaled by market value.
= Book value of equity of the transition year under IFRS minus book value of equity under local GAAP, scaled by market value.
= Absolute value of NI. = Absolute value of BVE.
= The effect of IAS 39 on book value of equity in the transition year, scaled by market value. = Dummy variable equal to 1 if firm has negative effect of IAS39 on book value of equity. = Absolute value of SIZE (IAS 39).
= Ln(market value of equity at end of the transition year in thousands of USD) = Ln(transition year – year of foundation or incorporation)18
= Net income on total assets19
= Average growth in sales over last 5 years prior to adoption year = 1 – (book value of equity (local GAAP) / total assets)
= Percentage of shares not closely held by directors or big shareholders = 1 if company reported previously under US GAAP
= Set of industry dummy variables based on two-digit SIC codes
18 For more than half of the firms, the foundation year is available. If the date is missing, we use the
date of incorporation. If neither of these two are available, we take the year the firm was available in Datastream.
19 Net income, book value of equity and total assets, required to calculate ROA and LEVERAGE, are
Table 3: Descriptive Statistics
Panel A shows descriptive statistics on all test and control variables, defined in Table 2. Panel B lists descriptive data of the four restatement quality variables (DISCL, EARLYADOP, DIFFACC and |DIFFACC|) and two governance indicators (CORPGOV and IPR) per country. For DISCL and EARLYADOP, the mean figures are depicted. For the accrual difference measures and the restatement variables of net income and equity, the median figure is shown instead of the mean to avoid the influence of outliers. Panel C provides data on the disclosure quality per item investigated, together with the number of firms per disclosure score. Panel D shows the percentage firms applying IAS 39 early, depending on the impact firms experience on their equity value (BVE) and their equity/debt ratio and significance levels of the difference. Panel E depicts accrual properties of local GAAP earnings and IFRS earnings of the transition year. |ACC(0)|/TA(0) is the absolute level of accruals scaled by total assets. Accruals are measured by subtracting operating cash flows from net earnings. Lower values of |ACC(0)|/TA(0) signify lower earnings discretion. Both mean and median values are shown, together with significance levels of the difference. ρ(ACC(0),CFO(0)) is the correlation between signed accruals and operating cash flows, both scaled by current year total assets. Larger negative values of ρ(ACC(0),CFO(0)) signify more earnings smoothing. Both ordinary and rank correlations are measured, together with the significance of the difference.
Panel A:
N Mean Median MIN MAX Q1 Q3 STDEV
DISCL 152 3,82 4,00 0,00 5,00 3,00 5,00 1,14
EARLYADOP 152 0,44 0,00 0,00 1,00 0,00 1,00 0,50
DIFFACC 152 -0,0075 -0,0050 -0,1085 0,1877 -0,0164 0,0021 0,0280
|DIFFACC| 152 0,0173 0,0105 0,0001 0,1877 0,0039 0,0216 0,0231
CORPGOV 152 25,47 24,99 12,99 35,96 20,50 31,75 5,60
NI 152 0,0128 0,0069 -0,0565 0,1534 0,0004 0,0195 0,026
BVE 152 -0,0193 -0,0043 -0,3891 0,1722 -0,0485 0,0225 0,080
ABS( NI) 152 0,0162 0,0088 0,0000 0,1534 0,0029 0,0206 0,024
ABS( BVE) 152 0,0532 0,0331 0,0001 0,3891 0,0127 0,0737 0,063
IMP(IAS39) 152 0,0013 0,0003 -0,1508 0,1299 -0,0067 0,0065 0,026
ABSIMP(IAS39) 152 0,0140 0,0066 0,0000 0,1508 0,0015 0,0159 0,022
MV in '000$ 152 24064060 12013065 1432864 209475900 7949500 23003870 33853667
AGE in years 152 62 55 1 261 17 102 47
ROA 152 0,0567 0,0459 -0,1172 0,3538 0,0278 0,0814 0,0596
SLSGR 152 9,2886 7,3500 -23,9000 98,0700 2,3050 13,8400 13,6726
LEVERAGE 152 0,6668 0,6854 0,2173 1,2332 0,5605 0,7864 0,1648
OWNDIFF 152 65,65 64,50 6,00 100,00 48,00 86,00 22,53
US GAAP 152 0,04 0,00 0,00 1,00 0,00 0,00 0,20
Panel B:
COUNTRY N DISCL EARLYADOP DIFFACC |DIFFACC| NI BVE ABS( NI) ABS( BVE) CORPGOV IPR
mean mean median median median median median median median country stat.
ENGLISH 60 4,00 0,25 -0,0134 0,0152 0,0095 -0,0073 0,0114 0,0348 32,07 100,00%
IRELAND 3 4,33 0,33 -0,0042 0,0151 0,0029 -0,0263 0,0029 0,0263 24,85 80,72%
UK 57 3,98 0,25 -0,0149 0,0159 0,0096 -0,0030 0,0131 0,0353 32,14 100,00%
FRENCH 71 3,94 0,58 -0,0041 0,0125 0,0077 -0,0164 0,0088 0,0344 21,31 100,00%
BELGIUM 1 2,00 1,00 0,0085 0,0085 -0,0063 -0,0595 0,0063 0,0595 18,72 59,16%
FRANCE 36 4,39 0,61 -0,0044 0,0095 0,0108 -0,0195 0,0125 0,0449 21,48 100,00%
GREECE 1 3,00 1,00 0,0068 0,0068 -0,0085 0,0240 0,0085 0,0240 18,52 62,62%
ITALY 8 3,88 0,50 0,0024 0,0075 0,0030 0,0130 0,0056 0,0359 20,55 80,72%
NETHERLANDS 11 4,18 0,27 -0,0085 0,0085 0,0091 -0,0154 0,0091 0,0248 24,52 100,00%
PORTUGAL 1 4,00 1,00 -0,0140 0,0140 0,0116 -0,0959 0,0116 0,0959 16,51 92,20%
SPAIN 13 2,77 0,69 -0,0031 0,0031 0,0011 -0,0094 0,0043 0,0336 19,98 85,30%
GERMAN 16 2,33 1,00 0,0092 0,0124 0,0040 0,0098 0,0082 0,0373 18,29 65,06%
GERMANY 5 2,80 1,00 0,0049 0,0049 0,0022 0,0050 0,0042 0,0294 19,37 50,60%
SWITZERLAND 1 0,00 1,00 0,0134 0,0134 0,0110 0,0156 0,0110 0,0156 16,11 79,52%
SCANDINAVIAN 15 3,07 0,33 -0,0037 0,0103 0,0054 0,0109 0,0054 0,0117 23,44 71,42%
DENMARK 3 2,33 0,33 -0,0002 0,0129 0,0210 -0,0075 0,0210 0,0639 17,50 77,05%
FINLAND 2 3,50 1,00 -0,0046 0,0046 0,0040 0,0158 0,0040 0,0158 23,06 85,30%
NORWAY 2 3,00 0,00 0,0003 0,0093 0,0134 0,0784 0,0134 0,0784 21,96 80,00%
SWEDEN 8 3,25 0,25 -0,0049 0,0078 0,0048 0,0095 0,0048 0,0095 24,37 71,42%
MEAN 10 3,20 0,60 -0,0018 0,0106 0,0061 -0,0041 0,0087 0,0374 21,83 81,11%
MEDIAN 3 3,25 0,58 -0,0037 0,0095 0,0054 -0,0030 0,0085 0,0344 21,31 80,72%
MIN 1 0,00 0,00 -0,0149 0,0031 -0,0085 -0,0959 0,0029 0,0095 16,11 50,60%
Panel C:
Proportion of Firms providing Disclosure Details
Restatement Item DISCL No Obs
0 3
1. Equity Value 2003 92,11% 1 3
2. Equity Value 2004 92,11% 2 13
3. Net Income 2004 84,21% 3 28
4. Total Revenues 2004 64,47% 4 58
5. Operating Cash Flow 2004 35,53% 5 47
Total 152
Panel D:
Neg Effect
BVE p-value
Pos Effect BVE
Neg Eff
Equity/Debt p-value
Pos Eff Equity/Debt
EARLY ADOP 22 (29%) 45 (57%) 22 (26%) 26 (63%)
0,001 0,000
LATE ADOP 51 (71%) 34 (43%) 64 (74%) 15 (27%)
TOTAL 73 (100%) 79 (100%) 86 (100%) 41 (100%)
Panel E:
Accrual Properties under IFRS and Local GAAP
No Obs Local GAAP p-value (1-sided) IFRS
|ACC(0)|/|TA(0)| |ACC(0)|/|TA(0)|
Median 152 0,056 0,027 0,048
Mean 148 0,067 0,038 0,059
ρ(ACC(0),CFO(0)) ρ(ACC(0),CFO(0))
Rank Corr 152 -0,589 0,130 -0,505
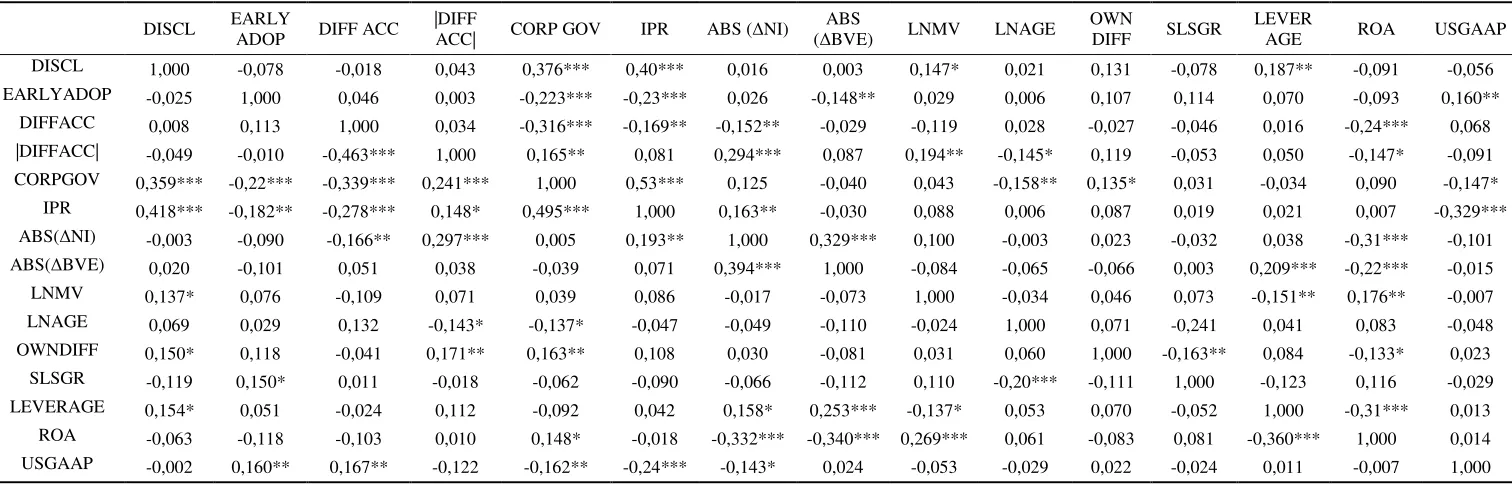
Table 4: Correlations
Ordinary (Pearson) correlations are shown in the upper right triangle with corresponding significance levels. Rank (Spearman) correlations are shown in the lower left triangle of the table. All variables are defined in Table 2.
DISCL EARLY
ADOP DIFF ACC
|DIFF
ACC| CORP GOV IPR ABS ( NI)
ABS
( BVE) LNMV LNAGE
OWN
DIFF SLSGR
LEVER
AGE ROA USGAAP
DISCL 1,000 -0,078 -0,018 0,043 0,376*** 0,40*** 0,016 0,003 0,147* 0,021 0,131 -0,078 0,187** -0,091 -0,056
EARLYADOP -0,025 1,000 0,046 0,003 -0,223*** -0,23*** 0,026 -0,148** 0,029 0,006 0,107 0,114 0,070 -0,093 0,160**
DIFFACC 0,008 0,113 1,000 0,034 -0,316*** -0,169** -0,152** -0,029 -0,119 0,028 -0,027 -0,046 0,016 -0,24*** 0,068
|DIFFACC| -0,049 -0,010 -0,463*** 1,000 0,165** 0,081 0,294*** 0,087 0,194** -0,145* 0,119 -0,053 0,050 -0,147* -0,091
CORPGOV 0,359*** -0,22*** -0,339*** 0,241*** 1,000 0,53*** 0,125 -0,040 0,043 -0,158** 0,135* 0,031 -0,034 0,090 -0,147*
IPR 0,418*** -0,182** -0,278*** 0,148* 0,495*** 1,000 0,163** -0,030 0,088 0,006 0,087 0,019 0,021 0,007 -0,329***
ABS( NI) -0,003 -0,090 -0,166** 0,297*** 0,005 0,193** 1,000 0,329*** 0,100 -0,003 0,023 -0,032 0,038 -0,31*** -0,101
ABS( BVE) 0,020 -0,101 0,051 0,038 -0,039 0,071 0,394*** 1,000 -0,084 -0,065 -0,066 0,003 0,209*** -0,22*** -0,015
LNMV 0,137* 0,076 -0,109 0,071 0,039 0,086 -0,017 -0,073 1,000 -0,034 0,046 0,073 -0,151** 0,176** -0,007
LNAGE 0,069 0,029 0,132 -0,143* -0,137* -0,047 -0,049 -0,110 -0,024 1,000 0,071 -0,241 0,041 0,083 -0,048
OWNDIFF 0,150* 0,118 -0,041 0,171** 0,163** 0,108 0,030 -0,081 0,031 0,060 1,000 -0,163** 0,084 -0,133* 0,023
SLSGR -0,119 0,150* 0,011 -0,018 -0,062 -0,090 -0,066 -0,112 0,110 -0,20*** -0,111 1,000 -0,123 0,116 -0,029
LEVERAGE 0,154* 0,051 -0,024 0,112 -0,092 0,042 0,158* 0,253*** -0,137* 0,053 0,070 -0,052 1,000 -0,31*** 0,013
ROA -0,063 -0,118 -0,103 0,010 0,148* -0,018 -0,332*** -0,340*** 0,269*** 0,061 -0,083 0,081 -0,360*** 1,000 0,014
Table 5: Earnings Management Activity per Corporate Governance Category
Panel A shows the number of firms scoring 0, 1, 2, 3, 4 or 5 on DISCL subdivided per corporate governance class. The significance of the Pearson Chi² statistic shows how these frequencies differ across governance classes. Panel B shows the number of firms scoring 0 or 1 on EARLYADOP subdivided per corporate governance class. The significance of the Pearson Chi² statistic shows how these frequencies differ dependent on the governance class. Panel C shows univariate results for four groups of firms, categorized by their corporate governance rating: category 0 (3) contains the worst (best) governance firms. Median figures of DIFFACC and |DIFFACC| (for definition see Table 2) are shown, together with the significance levels (1-sided p-values) of all mutual differences the four categories, measured respectively with a Rank Sum test.