The Vulnerability of Global Cities to Climate Hazards
Andrew Schiller*, Alex de SherbininU, Wen-Hua Hsieh*, Alex PulsipherUU * George Perkins Marsh Institute, Clark University
U Center for International Earth Science Information Network (CIESIN), Columbia University
UU Graduate School of Geography, Clark University
Abstract
Vulnerability is the degree to which a system or unit is likely to expierence harm due to exposure to perturbations or stress. The vulnerability concept emerged from the recognition that a focus on perturbations alone was insufficient for understanding responses of and impacts on the peoples, ecosystems, and places exposed to such perturbations. With vulnerability, it became clear that the ability of a system to attenuate stresses or cope with consequences constituted an important determinant of system response, and ultimately, of system impact. While vulnerability can expand our ability to understand how harm to people and ecosystems emerges and how it can be reduced, to date vulnerability itself has been conceptually hampered. It tends to address single stresses or perturbations on a system, pays inadequate attention to the full range of conditions that may render the system sensitive to perturbations or permit it to cope, accords short shrift to how exposed systems themselves may act to amplify, attenuate, or even create stresses, and does not emphasize the importance of human-environment interactions when defining the system exposed to stresses. An extended framework for vulnerability designed to meet these needs is emerging from a joint research team at Clark University, the Stockholm Environment Institute, Harvard University, and Stanford University, of which several authors on this paper are part. This paper is a first attempt to explore the utility of this extended vulnerability framework, by conducting a preliminary application of it to three global coastal cities with regard to their vulnerabilities to climate hazards. While this new framework needs further refinement and testing, and some methodological obstacles remain, our research suggests there is benefit from using the extended framework to guide assessments of vulnerability. The framework illuminated further system characteristics that, in unique combinations, create place-based vulnerabilities to climate hazards. The framework’s complexity, however, required us to conduct outside the framework several analyses comparing bundles of stresses to which the systems were exposed, and system characteristics that give rise to vulnerabilities, to uncover some of the most insightful results.
1. Introduction
Global cities are engines of economic growth and centers of innovation for the global economy and the hinterlands of their respective nations. The foundations of prosperity and prominence for most global cities lie in their long-standing commercial relationships with the rest of the world. To
facilitate trade, most global cities are located on or near the coast. They are also often located in low-lying areas near the mouths of major rivers, which served as conduits for commerce between interior agricultural and industrial regions and the rest of the world. As it happens, these locations place global cities at greater risk from current and projected climate hazards such as cyclones, high winds, flooding, coastal erosion and deposition, and sea-level rise (Nicholls 1995, Rosenzweig & Solecki 2001).
Global cities are also important centers of population concentration and growth. According to Brockerhoff (2000), just 25 years ago less than 2 percent of the global population resided in
“megacities” of 10 million or more inhabitants. Today the proportion exceeds 4 percent, and by 2015 it will top 5 percent, when megacities will likely house 400 million people. The phenomenal growth rates that most developing country megacities experienced from the 1960s to the 1980s have now tapered off somewhat, but because lower rates are being applied to higher population bases, the absolute numbers being added to their populations are still high. The fact that so many people reside in megacities near coastlines, and that these cities continue to grow, underscores the importance of assessing the vulnerability of such cities to coastal climate hazards.
Recent incidents have highlighted the vulnerability of urban areas in general to climate hazards. Flash floods and landslides in northern Venezuela killed almost 30,000 and left another 600,000 homeless in December 1999 (Bizarro 2001). Most of these casualties were in the Caracas metropolitan area, where highly vulnerable squatter settlements perched on steep hillsides were severely affected by mudslides. In the fall and early winter of 2000 rain and gales battered much of northern Europe, which in England alone killed four people and cost over one billion pounds ($1.4 billion) in damages. Similar storms battered northern Europe in December 1999. In France, torrential rain and high winds of 90 to 105 miles per hour closed down Charles de Gaulle and Orly airports and affected subway and commuter train service in and around Paris (NOAA/OGP 1999). Evidence suggests that global climatic change may be in part responsible for wetter winters and hotter and dryer summers in northern Europe (Collett-White 2001). In June 2001, tropical storm Allison hit Houston, Texas, flooding 20,000 homes, causing over $1 billion in damages, and engendering some unanticipated damages, such as the flooding of the Texas Medical Center, where researchers reportedly lost up to 35,000 laboratory animals that represented years of medical trials (NOAA/OGP 2001). This, like the flooding of hog farms that contaminated waterways and increased the risk of disease outbreak in North Carolina, USA in the aftermath of Hurricane Floyd in 1999, underscores the uncertainties of climate impacts, and the need to clearly examine and prepare for chains of events that may seem highly unlikely but do occur with greater frequency than in the past, and endanger many more lives.
With recent negotiations surrounding the Kyoto Protocol of the UN Framework Convention on Climate Change, the emphasis of climate change policy has largely been on mitigation. As necessary as these efforts are, it is clear that more attention needs to be given to adaptation to the climatic changes that are already under way, and that will be exacerbated by future emissions of greenhouse gases. Rayner and Malone (1997) argue that “the record and prospects of achieving emissions reductions suggest it would be prudent to expand the repertoire of climate-change policies, if only because our past emissions and the timetable for any plausible reduction program mean climate change is already upon us.” Among other elements, disaster preparedness and management plans are vital components of an adaptation strategy. But to design these, we need a better understanding of who and what are vulnerable to what kind of climate hazards, what makes them vulnerable, and where these people and systems are located.
This paper utilizes an extended framework of vulnerability emerging from the research community to assess the vulnerability of three global cities to climate hazards, with the goal of testing the value of this new framework and exploring what new insights, if any, emerge from its application. This is the first time this extended framework for vulnerability has been tested. The first section of this paper addresses the multiple ways that vulnerability is framed in the literature and describes the emerging framework for vulnerability. The following section presents results of a preliminary analysis of three global cities in the developing world, Mumbai, Rio de Janeiro, and Shanghai, and their respective vulnerabilities to climate hazards. We conclude the paper with a discussion and conclusions regarding this new and extended framework, and its potential value and shortcomings for guiding vulnerability assessments.
2. Framing Vulnerability
socioeconomic, or technological) was insufficient for understanding responses of, and impacts on, systems (social groups, ecosystems, or places) exposed to such perturbations. With the concept of vulnerability, it became clear that the ability of a system to attenuate stresses or cope with
consequences through various strategies or mechanisms constituted a key determinant of system response, and ultimately, of system impact. Clearer understanding of coping strategies or
mechanisms can thus illuminate who and what are at risk from what, and how specific stresses and perturbations evolve into risks and impacts.
Vulnerability in the human sciences is typically identified in terms of three elements: (1) system exposure to crises, stresses, and shocks; (2) inadequate system capacities to cope; and (3) severe consequences and attendant risks of slow (or poor) system recovery.
This perspective from the human sciences suggests that the most vulnerable individuals, groups, classes, and regions or places (ecosystems per se are not addressed) are those that (1) experience the most exposure to perturbations or stresses, (2) are the most sensitive to perturbations or stresses (i.e., most likely to suffer from exposure), and (3) have the weakest capacity to respond and ability to recover.
Beyond this broad agreement, the human sciences apply to vulnerability various frameworks and causal structures, each of which generates different research questions and methodologies. Extending the vulnerability concept to ecological systems serves to amplify this variation.
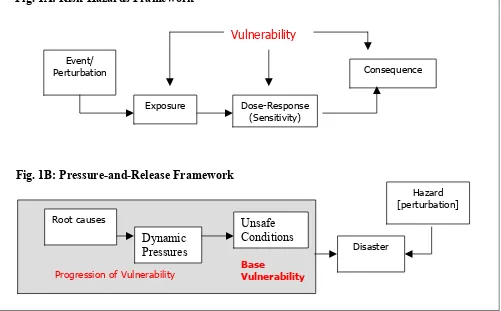
At least two primary framing designs for vulnerability are common in the human sciences: risk-hazards (RH) and pressure-and-release (PAR) (Fig. 1A & B). Each framework is conceptual, and reduced from “models” that attempt to both identify and connect the basic elements involved in producing vulnerability. Those concerned with behavioral or decision-making resources and opportunities that can be utilized in response to stresses or perturbations most often use the RH model. Alternatively, those concerned with political or economic structures that constrain behaviors or restrict opportunities for response to stresses or perturbations frequently prefer the PAR model.
These frameworks are useful in characterizing “human vulnerability,” but they mask the complexity of the components, states, and interactions that enter into a more robust construction of vulnerability, and thus they frequently provide simplistic indices and measures that may be misleading or even incorrect. In particular, these frameworks tend to address single stresses or perturbations on an exposed human system (group or place), and they pay inadequate attention to the full range of
Comparisons of the uses of the term vulnerability in the human-sciences literature illustrate these limitations (Table 1). Most of the work to date treats, in a static way, a single perturbation on a social receptor (a person, household, village, or society). By contrast, sustainability science (Kates et al 2001; NRC 1999) calls for exploring different and more inclusive dimensions of vulnerability, including how it emerges and ways to reduce it. These more complex dimensions of vulnerability require a framework that takes into account multiple/sequential perturbations that relate
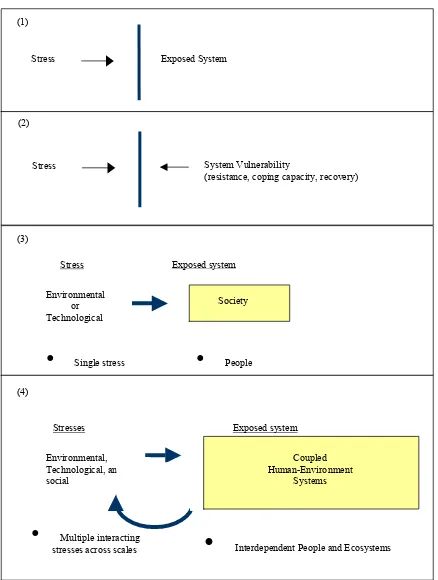
synergistically, interacting human-environment systems, and dynamically changing coping strategies and mechanisms – elements that are not addressed jointly to date in the human-sciences literature. Figure 2 illustrates the shift in research focus from stresses to increasingly sophisticated concepts of vulnerability.
Fig. 1B: Pressure-and-Release Framework
Root causes
Dynamic Pressures
Unsafe Conditions
Disaster
Hazard [perturbation]
Progression of Vulnerability
Base
Vulnerability
Event/ Perturbation
Exposure
Consequence
Dose-Response (Sensitivity) Vulnerability
Table 1 Selected definitions of vulnerability in the human sciences
Gabor and Griffith (1980)
Vulnerability is the threat (to hazardous materials) to which people are exposed (including chemical agents and the ecological situation of the communities and their level of emergency preparedness). Vulnerability is the risk context.
Timmerman (1981)
Vulnerability is the degree to which a system acts adversely to the occurrence of a hazardous event. The degree and quality of the adverse reaction are conditioned by a system’s resilience (a measure of the system’s capacity to absorb and recover from the event).
UNDRO (1982)
Vulnerability is the degree of loss to a given element or set of elements at risk resulting from the occurrence of a natural phenomenon of a given magnitude.
Susman et al. (1984)
Vulnerability is the degree to which different classes of society are differentially at risk.
Bogard (1989)
Vulnerability is operationally defined as the inability to take effective measures to insure against losses. When applied to individuals vulnerability is a consequence of the impossibility or improbability of effective mitigation and is a function of our ability to detect the hazards.
Mitchell (1989)
Vulnerability is the potential for loss.
Chambers (1989)
Vulnerability refers to exposure to contingencies and stress, and difficulty in coping with them. Vulnerability has thus two sides: an external side of risks, shocks, and stress to which an individual or household is subject: and an internal side which is defenselessness, meaning a lack of means to cope without damaging loss.
Liverman (1990)
Distinguishes between vulnerability as a biophysical condition and vulnerability as defined by political, social and economic conditions of society…vulnerability is defined both in geographic space (where vulnerable people and places are located) and in social space (who in that place is vulnerable).
Downing (1991)
Vulnerability has three connotations: it refers to a consequence (e.g., famine) rather than a cause (e.g., drought); it implies an adverse consequence; and it is a relative term that differentiates among socio-economic groups or regions, rather than an absolute measure of deprivation.
Dow (1992)
Vulnerability is the differential capacity of groups and individuals to deal with hazards based on their positions within physical and social worlds.
Watts and Bohle (1993)
Vulnerability is defined in terms of exposure, capacity and potentiality. Accordingly, the prescriptive and normative response to vulnerability is to reduce exposure, enhance coping capacity, strengthen recovery potential and bolster damage control (i.e., minimize destructive consequences) via private and public means.
Cutter et al. (2000)
Broadly defined, vulnerability is the potential for loss of property or life from environmental hazards.
Figure 2. From defining stresses to understanding vulnerabilities (1) early work emphasized stress characterization. (2) Vulnerability broadened the idea of impact by focusing on characteristics of the exposed system that could help it resist, cope, or recover from stress. (3) Vulnerability has been limited by incomplete conceptual frames, owing to a focus on single stresses and social vulnerabilities. (4) Expanding vulnerability to include multiple interacting stresses, the notion of an exposed system as one composed of coupled human-environment components, and making explicit that responses of the system itself can both dampen and increase various stresses and perturbations, brings a more complete picture of vulnerability.
System Vulnerability
(resistance, coping capacity, recovery) Stress
(2)
Exposed System Stress
(1)
Environmental, Technological, and social
Coupled Human-Environment
Systems Stresses Exposed system
•
Multiple interacting•
Environmental or Technological
Society Stress Exposed system
•
Single stress•
People (3)Seeking to address the above described conceptual limitations to help facilitate a better understanding of how vulnerability emerges in certain systems and what can be done about it, researchers at Clark University, the Stockholm Environment Institute, Stanford University, and Harvard University have been working to develop an extended vulnerability framework. The proposed framework addresses the vulnerability of interacting human-environment systems to multiple and synergistic stresses that emanate from within as well as outside of the system (Figure 3). The diagram in Figure 3 depicts such a dynamic system, and illustrates these
feedbacks and links to forces and factors that operate both “outside” and “inside” the immediate system. Owing to the figure’s complexity, it does not directly illustrate the hierarchical (spatial and temporal) nesting in which the assessed system fits and interacts.
With this extended vulnerability framework, there is formal recognition that macroforces – from both broad-scale environmental and human systems within which the local system resides – come together to affect the local system and simultaneously influence the pressures that act upon it. Different pressures across scales come together in various sequences to create unique
“bundles” of stress that affect local systems. A major hypothesis holds that when stresses or perturbations emanating from the environment coalesce with those arising from society, significant consequences can result. For example, economic depression reduces society’s
capability to develop or maintain pre-emptive coping measures to reduce the impacts of drought, such that the co-occurrence of drought and economic depression synergistically enlarges the vulnerability of the system.
The risks resulting from such vulnerabilities emerge from multiple sources and at different scales. These risks cascade through interacting human and environmental systems to create adverse consequences. These interacting systems exhibit conditions that make them sensitive or resistant to the level of risk confronting them, and, depending on the degree of sensitivity, prompt the system to activate its coping and response mechanisms. These mechanisms either attempt to alleviate stresses on the system directly through increased preemptive measures (e.g., building dikes to keep out floodwaters), or, alternatively, they may feed back into and adjust components of the social and ecological system itself (e.g., state-sponsored monetary safety nets for households, or successional growth in a disturbed forest). Before preemptive adjustments are brought into play, the human-environment system and any system adjustments previously made, jointly feed back and change the set of stresses and perturbations to which the system is exposed (e.g., land uses feed back in response to land degradation, land-cover adjusts in response to regional climate change, income can be redistributed in response to an expanding underclass).
Stresses or perturbations that exceed a system’s ability to cope and respond lead to impacts that can, in turn, affect resources and mechanisms for further coping. When impacts are sufficiently significant, they may trigger more fundamental changes in the system, described as adaptations (in the face of reduced precipitation, a human community may shift from a rain-fed cultivation economy to ecotourism; a closed woodland ecosystem may become an open savanna).
Red = Drivers
Black = Perturbations and Stresses
Blue = Coupled Human-Environment System w/Vulnerability
Figure 3. Extended Framework for Vulnerability
The proposed vulnerability framework is complex, yet it provides an overall structure within which various existing conceptual frameworks and models can be better evaluated, and from which the development of improved models and applications can draw for guidance.
Here we were particularly interested in testing these aspects of the extended framework: Do new insights about vulnerabilities emerge if multiple, synergistic stresses and perturbations are
considered on one side of the equation, and multiple, synergistic physical and social characteristics of the exposed system are considered on the other side? Does such a “gap analysis” – comparing “stress bundles” to particular system characteristics that are exposed – bring forth new knowledge about stresses to which the system has greatest vulnerability? What are the relative levels of importance of formal versus informal coping capacities? Are there real data limitations that restrict the practical application of the extended framework? And finally, does the framework’s complexity hide rather than illuminate important relationships in the system that may either create or dampen vulnerability?
3. The Case Studies
In order to preliminarily assess the utility of this extended vulnerability framework, we examine three case studies of global coastal cities in light of climate hazards: Mumbai, India (formerly Bombay); Rio de Janeiro, Brazil; and Shanghai, China. Each of these cities have urban
agglomerations in excess of 10 million people, the threshold that the United Nations applies to designate “megacities,” and they each represent important national and regional engines of economic development and innovation.
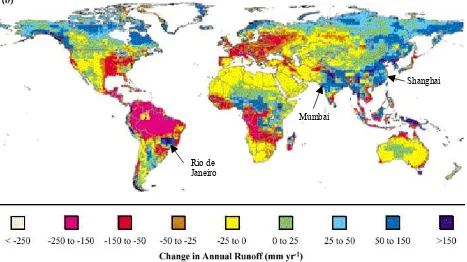
This paper addresses current and future vulnerability to climate hazards. The respective sections provide baseline information on climate in each of the cities. To assess future vulnerability, we use standard sets of climate change and sea-level rise scenarios. Figure 4 provides projected temperature changes by season for reduced emissions (“sustainable path”) and increased emissions (“business as usual”) scenarios. Compared to temperature changes, precipitation changes are considered to be more difficult to accurately model, and therefore are not included here, except in the form of a map of projected runoff in Figure 5.1 Projections of sea-level rise due to melting of land-based glaciers and polar ice caps range from 0.2 to 0.9 m by 2100 (Nicholls 1995). We adopt a common projected sea-level rise of 50cm by 2050, though local variations in land subsidence will affect the relative sea-level rise in each location. Shanghai, for example, is located in areas of subsidence, and experts point out that the local effects could exacerbate sea-level rise in certain locations (Bird 1995).
These global cities are located in very different physical environments which makes for interesting comparisons. The climate of Mumbai is tropical moist, Rio is sub-tropical wet and dry, whereas Shanghai is on the border between sub-tropical and warm-temperate. Shanghai is located at the mouth of a major river (the Yangtze), and all are coastal cities that have significant portions just above sea-level. Two of the cities, Mumbai and Shanghai, are subject to hurricane (tropical cyclone) landfalls at least once a year (Nicholls 1995).
1
We focused on collecting data in the categories shown in Table 2 to explore climate hazard vulnerability for these three global cities. Note that data on stresses and perturbations include both climate and social components, some of which arise endogenously to the system. Likewise, system characteristics include elements of physical geography and built infrastructure, coupled with socio-economic conditions that include what we term endowments, and coping abilities (both direct and indirect).
Figure 4. Projected Changes in Temperature for the Global Cities
Source: Richard Goldberg, Goddard Institute for Space Studies, 2001.
Figure 5. Case Study Locations Superimposed on Map of Potential Changes in Runoff
Source: IPCC Third Assessment Report – Working Group II Technical Summary, 2001
Rio de Janeiro
Mumbai
Shanghai Projected Change in Temperature (oC) for
2050, Emissions Reduction Scenario
(Canadian Climate Center B2 scenario, run A)
0
Projected Change in Temperature (oC) for 2050, Business as Usual Emissions Scenario
(Canadian Climate Center A2 scenario, run A)
3.1 Mumbai
Mumbai is the largest and most economically important city in India. Its 17 million people (1.65% of India’s total) contribute roughly 17% of India’s income tax, and 37% of India’s corporate taxes annually, and generate 30% of India's GDP (Bombay First 2001, Hutchinson Encyclopedia 2000). Mumbai host’s India’s largest stock exchange (Asia’s oldest), its largest high-tech center, the world’s most prolific film industry, the world’s largest metro-suburban rail system, and Asia’s largest squatter community (Demographia 2000). Across the bay from the old city, Navi Mumbai (New Mumbai) is taking shape as the world’s largest totally planned city. Unfortunately, Mumbai is also likely to be highly vulnerable to climate change with its
downtown located on a flood prone, poorly drained peninsula composed largely of landfill. Among the most vulnerable are the approximately one half of the city’s residents who live in squatter communities, many of which are located in low lying areas without adequate sanitation or water supplies. Finally, these vulnerabilities are compounded by Mumbai’s location over several seismic faults as well as its unsanitary methods for disposal of raw sewage and industrial wastes into the waters and air surrounding Mumbai.
3.1.1 Physical Environment
The Portuguese were first attracted to Mumbai, known then as Bom Bahia (“good bay” in Portuguese), for its excellent harbor and the opportunities for trade with several communities on islands in the harbor. The British gained control of Bombay from the Portuguese in 1661, and as trade and population increased, the need for additional land led to the filling in of the shallow waters and tidal mudflats connecting the original seven islands with rock and dirt from the tops of the island’s own hills, between 1784 and 1845. Today landfill lies underneath the majority of the center city of Mumbai, containing the stock exchange, the main train stations and train lines, and numerous high rises. Further inland in the suburbs, where most of the population now lives, elevation rises. However much new settlement, industrial, residential, and commercial, has occurred along the coastal areas of “Greater Mumbai,” which are low lying and flood prone (Mumbai Pages 1999)
Mumbai’s climate is tropical with temperatures ranging between 16 and 33 degrees Celsius. Temperature and rainfall are strongly effected by the Indian Monsoon, which normally starts in June and ends around the middle of September. Approximately 2,500 mm of Mumbai’s 2,700 mm of rain comes at this time, with flooding common when spells of heavy rainfall coincide with high tides or storm surges. These heavy rain events are sometimes the result of tropical cyclones that occasionally pass near or directly hit Mumbai (Mumbainet 2001, The Times of India 2001)
3.1.2 Built Environment
Drainage
Most landfill areas (i.e. most of the old city) are prone to flooding during the monsoon,
especially when heavy rains combine with high tides or storm surge (The Times of India 2001). Even in wealthy areas, drains are often blocked by trash and debris, and monsoon flooding often shuts down Mumbai’s commuter rail lines, which an estimated 6.2 million people depend on each day (Geocities 2000). Flooding of this type would likely increase with sea level rise, necessitating major upgrades in drainage systems and also possibly increasing the elevation of major rail lines. Projects are already underway to upgrade the drains that run along the rail lines and to demolish squatter communities along rail lines that contribute to clogged drains.
However, this work was not designed with sea level rise in mind. A 1996 national study ranking India’s coastal zones by their vulnerability to sea level rise found Mumbai to be the most likely to experience damage (TERI 1996).
Squatter communities
It is estimated that 55% of Mumbai’s population lives in squatter communities, locally referred to as slums, roughly half of which are severely dilapidated. Many squatter structures are single story and made of salvaged materials. Nevertheless, population densities for roughly one half of Mumbai’s squatter communities are estimated to be as high as 94,000 people per square
kilometer. This compares with 45,989 people per square kilometer for Mumbai as a whole, 9,998 people per square kilometer for New York City, 4,640 people per square kilometer for Rio de Janeiro, and 2,220 people per square kilometer for the greater Shanghai district (Demographia 2000, MIUL 2001). Mumbai’s squatter communities suffer from inadequate access to potable water and sanitation, with the World Bank estimating that 170 persons depend on each public latrine in these areas, and that one third of the 35,000 latrines in Mumbai are out of service (World Bank 1996). Even without sea level rise, many squatter communities in Mumbai are already flooded with frequency as they are often located in low-lying coastal areas and along stream banks – areas most likely to experience floods. Flooding is common even in Mumbai’s squatter communities on higher ground, as the large amount of refuse and debris in these areas tends to clog storm sewers and cause a backup of water that would otherwise run off or find its way to storm drains (Sharma 2000). Landslides are another threat to squatter communities that are near or on the few hillsides in the city. These landslides usually occur during heavy monsoon rains as hillsides become saturated with water. On July 12 2000 between 60 and 160 people were killed by such a landslide (Indian Express 2000).
Mumbai authorities have historically dealt with the problems caused by squatter communities by demolishing them and forcibly relocating the inhabitants to new areas in the suburban fringe. Increasingly, non-governmental organizations (NGOs) are organizing to meet the needs of squatters dwellers for better access to sanitation and water, but their efforts are still limited in scope, and their impact is quite small, especially with regard to some of the squatter communities most vulnerable to sea level rise and flooding. This is because funding from the Indian
government cannot be used in violation of zoning regulations that prohibit residential development in coastal areas (Sharma 2000). While restricting coastal zone settlements theoretically reduces settlement in vulnerable areas, in practice this has not deterred such
flood-prone areas, exposing even greater numbers of people to flooding, disease, and economic ruin. This represents something of a no-win situation.
Building Collapses
Mumbai has become notorious for frequent collapses of buildings, especially high rise apartment buildings, due to structural failures. Causes include bribery of building code inspectors and the effects of the Monsoon. The structural integrity of buildings in Mumbai may also be affected by the city’s location over several seismic fault lines. Buildings in the landfill areas of the old city showed cracks after the Gujurat Earthquake of 2001 (The Observer of India 2001). While some government and public buildings have been re-enforced, some 36 per cent of Mumbai’s
buildings are judged to be in the "risk category" in case of an earthquake (Economic Times 2001).
Drinking Water/potable water capacity:
Mumbai’s water supply consists of several artificial rain-fed lakes located in the suburbs to the north of the old city. While their location on hills makes them less susceptible to impacts from sea level rise, their total dependence on rainfall means that increasing variability in precipitation could threaten this water supply. Recent attempts to upgrade Mumbai’s water supply have been considerable, but progress has been nullified by a growing population. The World Bank’s Bombay (Mumbai) Water Supply and Sewage Disposal Projects, which were implemented between 1975 and 1995, increased the city's water supply from 260 to 650 million gallons per day. During the same period, however, Mumbai’s population increased 80 percent, leaving per capita water availability unchanged at about 250 liters per day. An antiquated, leaking and partially un-metered water delivery system are also cited by The World Bank as major problems holding back improvement of the city’s water system (World Bank 1996).
Pollution
Both air and water pollution have been identified as major problems in Mumbai, by both local authorities such as the Mumbai Metropolitan Region Development Authority (MMRDA), and by The World Bank. The World Bank describes Mumbai’s air pollution as “severe” and with regard to Mumbai’s water pollution states that “about 75 percent of all sewage is untreated and
discharged to local waterways and coastal waters, causing extensive environmental hazard” (World Bank 1996).
3.1.3 - Socioeconomic Conditions
Endowments
per month. Unemployment is estimated to be as quite high, largely due to Mumbai’s decline as a manufacturing center (World Bank 1996).
Mumbai’s population growth is estimated at 4.2% per year, with current population estimated at 17 million (Demographia 2000). The Indian Census of 1991 put Mumbai’s population at roughly 14.4 million, with 3.2 million in the old central city, 6.7 million in its immediate suburbs, and 4.5 million in the rest of the Mumbai Municipal Region (MMR) (Demographia 1991). By 2011, these figures are estimated to rise to 22.4 million, with 12.9 million in the old city and its immediate suburbs, and 9.5 million in the rest of the MMR (MMRDA Basic Statistics).
Direct coping
Mumbai is the headquarters for the state of Maharashtra Disaster Management Plan. An
Emergency Operations Centre (Central Control Room) in Mumbai is the main hub for a network connected with a variety of sophisticated technologies aimed at emergency planning and disaster management. Multi-hazard response plans, financed by the UK’s Department for International Development (formerly the Office of Development Assistance), are also in place in Mumbai as well as six other centers across the state. There are multi-hazard response plans in place for each district, including risk assessment and vulnerability analysis with reference to earthquakes, floods and cyclones, epidemics, road accidents, fires, and chemical and industrial disasters. These systems also contain a multi-hazard response structure, capability analysis, inventory of resources, mitigation strategies, and a directory of personnel and institutions in the districts with their contact addresses, telephone and fax numbers (Maharashtra Disaster Management Plan - An Overview ). Nevertheless, the continued occurrence of catastrophic-level flooding and large human impacts from such flooding in Mumbai during the annual Monsoon, indicates that serious problems persist. Moreover, the various ongoing landfill projects of various Mumbai
development authorities suggests that a more prevention-oriented approach to disaster avoidance and reduction is lacking (MMRDA Planning).
Industrial zoning
Regulations are in place that prohibit the location of new industries in the old center city. This has been done to reduce congestion and pollution, and discourage further dense settlement in this old portion of the city that has an antiquated built environment. These regulations have an added, and as yet unappreciated, benefit of decreasing settlement on landfill areas which are susceptible to flooding and potential shifting due to sea level rise and increased storm frequency. However, some of the new settlements that industries and people are being relocated to are also in low-lying coastal areas that may be similarly susceptible to sea level rise and storm surge (MMRDA Backbay). There are also claims that these areas have higher rates of respiratory and other ailments due to highly polluting facilities being located there (MMRDA Bandra-Kurla, Mumbai Pages 1999, MMRDA Masterplan).
Indirect coping
Despite its many chaotic qualities, Mumbai is socially highly organized, a quality that mitigates some of the city’s vulnerability to natural hazards. For example, in 1999 a squatter organization in Mumbai, the National Slum Dwellers Federation (NSDF), was placed on the UNDP’s
houses and toilets, and waste disposal systems that have reduced waste output from select squatter communities in Mumbai by up to 70 per cent (UNDP Press release). NSDF and many similar organizations in Mumbai have built strong partnerships between poor communities, NGOs, and various levels of government (SPARC 2000).
Another important aspect of Mumbai’s social support system is the city’s ability to garner resources from abroad. As the wealthiest and most cosmopolitan city in India, and as the center for India’s film industry (the world’s largest in terms of output), Mumbai looms large in the minds of Indian’s living abroad. This community is recognized throughout India as a key to the country’s overall development, and Mumbai’s unique ability to broadcast its problems and needs to this community may prove an important factor in reducing the city’s impacts from climate hazards. This may be especially true in the case of dramatic perturbations, such as sea level rise and associated flooding, that could threaten Mumbai’s status as the leading city of India.
3.1.4 - Likely Future Climate Hazards and Overall Vulnerability Assessment
The Canadian Climate Center’s A2 (business as usual) scenario predicts an average annual temperature increase of 1.75oC and the B2 (sustainable path) scenario predicts a roughly 1.25 oC increase by 2050 (see Figure 1). This increase is similar to that predicted for Rio but lower than the increases in New York or Shanghai. Mumbai is predicted to have an average annual
decrease in precipitation of two percent for the A2 scenario and an increase of two percent for the B2 scenario. The predicted sea-level rise of 50 cm by 2050 could prove seriously damaging for Mumbai.
Potential impacts of precipitation extremes
The A2 (business as usual) scenario may engender water shortages in Mumbai given the city’s complete dependence on rainfall for its water supply. The fact that both scenarios predict a decrease of rain during the first part of the year (January-August) suggests that droughts will become more common throughout Mumbai’s surroundings, though predicted reductions during the monsoon season are less dramatic. Furthermore, both scenarios show an increase in rainfall from September to November, which may mitigate water shortages from reduced monsoons. If droughts do increase in severity, this could trigger migrations from surrounding agricultural areas (a common occurrence during drought years), which could tax the city’s resources in the context of multiple climate change impacts.
Coastal/Marine issues
A 1996 study undertaken by the Tata Energy Research Institute put the cost to Mumbai of a one meter sea-level rise at US$71 billion (TERI 1996). The study concluded that US$24 million invested in protection against sea level rise would reduce the economic impact by about US$33 billion dollars. The predicted rise in sea level of 50 cm would probably have a similarly
communities. The few hills, formerly islands, that were not leveled to create the landfill that the majority of the city was built on, contain mostly upscale residential areas long prized for their relative immunity to flooding. These areas lack the commercial potential to take up slack should the landfill areas go into decline. However, provided that sea level rise occurs gradually and was recognized early enough, Mumbai might be able to mitigate damages, perhaps by shifting much of the old city to the adjacent suburbs or Navi Mumbai.
Overall Vulnerability
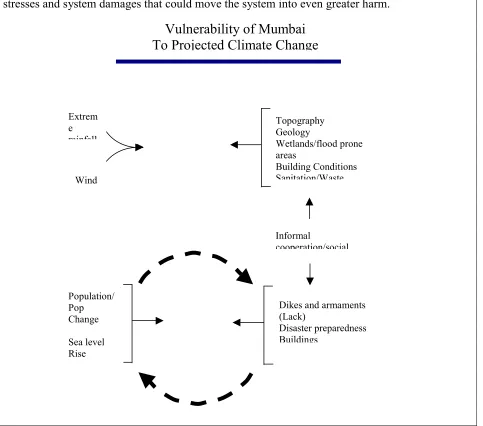
Figure 6 provides a schematic diagram of our findings from applying the extended framework of vulnerability to Mumbai, based on preliminary data. What emerges from using the broader framework is the specific identification of the set of stresses and perturbations that converge to create greatest stresses on Mumbai, for which certain conditions within Mumbai come together to produce vulnerabilities to these particular “stress bundles.” For example, extreme rainfall and floods converge to produce stresses. Mumbai’s characteristics of topography (flat), geology (unconsolidated fill material), many wetlands and flood prone areas, the city’s building
conditions (not meeting building codes, squatter dwellings, previously flood-damaged buildings), and poor sanitation and waste treatment and removal capabilities. This particular “bundle” of stresses “collides” with this set of socio-environmental conditions of Mumbai such that
vulnerabilities emerge for the system. This type of “gap analysis” reveals where vulnerabilities will likely arise out of the larger list of stresses/perturbations and system conditions.
In addition, a “stress bundle” composed of population (large and growing), projected sea level rise, and economic stresses, converge to create some particularly problematic issues for Mumbai. This is because of a set of characteristics for Mumbai itself: the lack of dikes and other coastal armaments for dealing with sea level rise, a weakness in disaster preparedness at the scale of sea level rise, building conditions (not meeting building codes, squatter dwellings, previously flood-damaged buildings), and low incomes that do not allow the city to increase building conditions to the level required, nor to better develop and fund disaster preparedness. Together, these issues put Mumbai in front of an issue with which it likely will have very little ability to control, dampen or mitigate. The dashed arrows in Figure 6 further suggest a reinforcing spiral could emerge for these set of issues, where increasing population comes together with sea level rise and a stressed economy to further damage already weak buildings, undermine efforts to improve disaster preparedness and to build coastal armaments – and in turn – these further erode the economy while sea level rise marches forward. Mumbai’s informal coping capacities – because of notably strong social networks and cooperation, emerge as important parts of Mumbai’s resistance and resilience in the face of stresses. These informal coping systems are shown in the diagram to help reduce vulnerabilities to some degree for both sets of issues that emerge from this preliminary analysis. Yet, by themselves, these informal coping capacities appear quite inadequate to meet the challenges from climate hazards and population size and growth that now face Mumbai.
Mumbai’s overall vulnerability appears to be high. While the city is relatively prosperous compared to the rest of India, and it does have an elaborate disaster management plan in place, the challenges posed by climate change, especially flooding and subsurface shifting in landfill areas are unlikely to be met effectively. In particular, subsurface shifting of the type that
Figure 6. A schematic diagram of the key converging stresses/perturbations from climate, population, and economy, and the sets of characteristics of the Mumbai socio-ecological system that come together to create vulnerabilities. The dashed arrows suggest a spiral of reinforcing stresses and system damages that could move the system into even greater harm.
3.2 Rio de Janeiro
Rio de Janeiro is a city of just over 10 million people located at approximately 22.9o South latitude and 43.3o West longitude with a total area of 1,171 sq. km. Guanabara Bay, upon which Rio is situated, faces almost due South. Rio is the second most populous city in Brazil, after São Paulo, and ranks second only to São Paulo in industrial production. This erstwhile capital of Brazil is known for its beautiful beaches and the granitic hills that rise dramatically from sea-level to heights of over 1,000 meters. Yet, Rio faces significant environmental sustainability
Vulnerability of Mumbai
To Projected Climate Change
Extrem e rainfall
Wind
Topography Geology
Wetlands/flood prone areas
Building Conditions Sanitation/Waste
Dikes and armaments (Lack)
Disaster preparedness Buildings
Population/ Pop Change
Sea level Rise
Informal
challenges stemming from unregulated settlement in hazardous areas, sewerage disposal, and industrial wastes. These will be exacerbated by potential climate changes.
3.2.1 Physical Environment
Rio’s dramatic topography has made it more prone to certain types of hazards. When the Portuguese discovered Guanabara Bay in 1501, the coastal mountains were carpeted in thick Atlantic rainforest. As this protective covering has been progressively stripped away to make room for settlements, the thin soils are prone to landslides and the granite and gneiss bedrock has been left exposed to weathering, making it more prone to decomposition and erosion.
The coastline in this area was characterized by lagoons, estuaries, and low lying coastal marshes, many of which have been filled in. The flat topography of low lying areas, combined with lack of drainage, has continued to result in flooding during the summer rainy season (January-March). The few remaining lagoons, mangroves and marshes have been affected by sedimentation, reducing their absorptive capacity during extreme rainfall events. Ninety percent of mangroves surrounding Guanabara Bay have been removed, and intense sedimentation has resulted in the need for dredging to maintain shipping lanes. Rio’s beaches, a major tourist asset, are subject to intense erosion during storm events (up to 5 meters recession), but usually recover quickly through deposition of sand laterally along the coast (Muehe 2001). Significant resources are also expended on beach nourishment following erosion events.
The climate in Rio is moderated by the coastal effect, and by its southern exposure and mountain ranges to the North. The mountain ranges block cooler northeasterly winds during winter
months, and enhance orographic precipitation during summer months when winds are predominantly southwestly. Rio experiences wet summers (December-March), during which temperatures range average 24-26oC, and dry winters (June-September), during which
temperatures range from 20-22oC (see Figure 6). Maximum temperatures rarely exceed 42oC. From year to year precipitation ranges from 1200-1500 mm, whereas evaporation ranges from 800-1200 mm.
Rio is not impacted by tropical cyclones. However, the city does receive a strong El Niño-Southern Oscillation (ENSO) signal, and during El Niño years the city receives higher then normal precipitation during the summer months. During one recent El Niño year, 1988, the city was affected by severe floods as a result of two intense periods of rainfall in early February that dropped a total of 480 mm of rain, one-third the annual total rainfall.
3.2.2 Built Environment
Rio’s peculiar geography, and the circumscribed nature of suitable building sites, has spawned two kinds of responses. One is the construction of apartment high-rises close to the coastline (e.g., Copacabana, Ipanema and Leblon) and in flood prone areas further inland, and the other is unregulated construction on steep slopes, particularly on the Tijuca mountain range. The
most basic amenities to organized communities of largely concrete housing with cemented walkways, electricity (through licit and elicit connections), plumbing, sewerage, and other services.
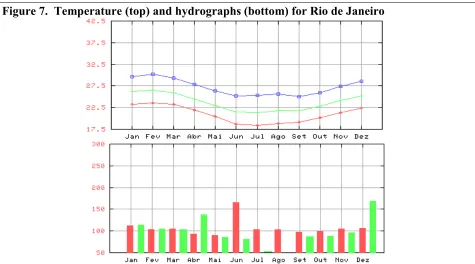
Figure 7. Temperature (top) and hydrographs (bottom) for Rio de Janeiro
Temperature (blue = max., green = median, and red = min.) does not vary significantly through the year. In contrast, the hydrograph (red [dark] = evaporation, green [light] = precipitation) shows that precipitation is greatest in April and December, whereas potential evapo-transpiration greatly exceeds rainfall from June through August.
Though favelas always suffered during rainy seasons, the paving of walkways has had the effect of increasing runoff to the point where one resident said that water is often ankle or knee deep between the houses. Thus, drainage is a problem. Runoff from communities on steep hillsides, including Petropolis and favelas on the Maciço da Tijuca massif, are channeled down cemented and quasi-natural water courses to the narrow coastal lowlands, where they join canals whose limited flow capacity causes frequent flooding. By contrast, the Baixada Fluminense, a large marshy lowland somewhat removed from the steeper parts of the city, has had reasonably adequate drainage since the 1930s (Cunha and Santos 1993).
In terms of services, the city has a reasonably clean and reliable water supply that is piped in from rivers in Minas Gerais state to the north (Cunha and Santos 1992; Muehe 2001). Over 84% of the population is supplied with water. Eighty-three percent have their own sanitary
Waste disposal is a significant problem. Trash disposal for favelas remains haphazard, with some estimates that 5,400 tons/day or more end up in rivers and drainage channels, blocking channels during peak flow (Baptista de Araújo 1994). This compares with 7,000 tons/day that end up in city dumps, mostly at the margins of Guanabara bay. Daily discharges into the bay include 465 tons of organic matter, 68 tons of which receive adequate treatment, and 9.5 tons of oil. The Iguacu and Estrela Rivers which drain the Bay’s watershed are often anoxic and produce a strong hydrogen sulfide smell (Kreimer et al. 1993).
Guanabara Bay is surrounded by a mixture of industrial and residential land uses. As the second largest industrial zone in the country, it has 10,000 industries, 10 oil terminals, 12 shipyards, and two oil refineries (Kreimer et al. 1993). Petrobras, the Brazilian oil company, has numerous off-shore drilling platforms near Rio, and uses Rio as its primary distribution point. Traversing the bay is also a giant causeway leading to Niteroi, and two airports are located just above sea-level on the margins of the bay.
3.2.3 Socioeconomic Conditions
Endowments
Although Rio’s product per capita is roughly double the national average (see Table 3), its income distribution is highly skewed. The existence of pockets of extreme poverty side-by-side with some of the most affluent neighborhoods is characteristic of the city. Rocinhas, among the oldest and largest of Rio’s favelas, clings precariously to steep slopes of the Tijuca mountain range just above Gavea, one of the city’s wealthiest neighborhoods. It is estimated that 1.1 million people live in favelas, or 20 percent of the municipality’s population.
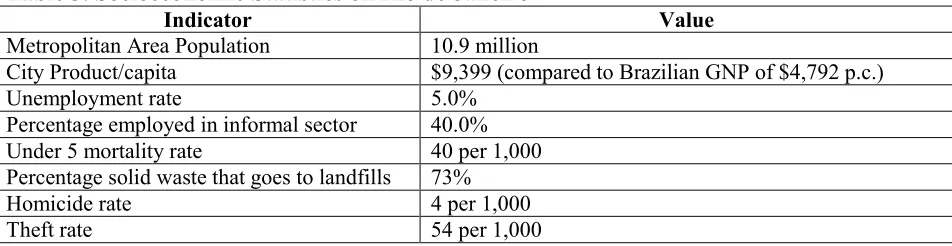
Table 3. Socioeconomic Statistics on Rio de Janeiro
Indicator Value
Metropolitan Area Population 10.9 million
City Product/capita $9,399 (compared to Brazilian GNP of $4,792 p.c.)
Unemployment rate 5.0%
Percentage employed in informal sector 40.0%
Under 5 mortality rate 40 per 1,000
Percentage solid waste that goes to landfills 73%
Homicide rate 4 per 1,000
Theft rate 54 per 1,000
Source: IGBE (2001) and United Nations Centre for Human Settlements (HABITAT), Global Urban Indicators, Version 2, http://www.unchs.org/guo/gui/gui.asp (accessed Sept. 3, 2001).
According to the 2000 census, the population of Rio metropolitan area is 10.9 million, with 5.8 million residing in the municipality (IBGE 2001). Population density in the latter is 4,640 persons per square kilometer, but densities in the smaller administrative units of the metro area are between 8,000 and 12,000 persons/Km2 (IBGE 2001), indicating that some parts of the city have significant population concentrations. Although rapid population growth of 3.8% was predicted for the past decade (Baptista de Araújo 1994), the recent census figures suggest that the rate may have been slower. Corrêa do Lago (1999) notes that the metro area received 758
to 573 thousand. It is possible that continued declines in migration account for the somewhat lower than expected overall population growth.
Direct coping
The state of Rio de Janeiro has a Civil Defense of 15,000 members, including the fire department, emergency medical service, sea rescue service, and the community relief
department. Brazil’s State Environmental Engineering Foundation (FEEMA) is responsible for coastal monitoring and land-use zoning in the state. Baptista de Araújo (1994) urges more micro-planning for disaster management such as occurred under the Rio Reconstruction Project, which was implemented in the wake of the 1988 floods.
In terms of zoning, until recently there was little effort to segregate industrial or waste disposal activities from residential areas. This could result in potential vulnerabilities, particularly should flooding lead to dispersion of pollutants to surrounding areas. New regulations have been put in place that restrict building in hazard-prone areas, and according to Kreimer et al. (1993), “major emphasis has been placed … on command and control mechanisms to regulate urban growth.” Efforts have also been under way for several years to “regularize” favelas through various government programs to undertake cadastral surveys, grant deeds to de facto owners, and provide basic infrastructure. These same plans limit the further expansion of favelas in flood prone or steeply sloped areas.
Indirect coping
There are several issues that weaken Rio’s indirect coping capacity. These include official corruption and political tensions between federal, state and municipal governments; and large migrant communities with low tenure security, decreasing levels of social cohesion, and low levels of education.
Geddes and Ribero Neto (1992) write of the widespread corruption during the Collor
administration. According to the authors, the weakening of the executive branch’s ability to build coalitions and assure the loyalty of supporters in Congress has created strong incentives to
exchange material benefits (in the form of public works projects) for congressional support. Unfortunately, for those jurisdictions (such as Rio de Janeiro) that had leaders in rival political parties, this led to denial of federal financing for public works projects, and even problems in the implementation of disaster relief programs. Allen (1994) describes how political wrangling between federal, state and municipal authorities negatively affected relief and reconstruction efforts after the floods of 1988. She writes, “political rivalry between State and municipal government, between both of them and the federal government, and even at managerial level within the Caixa Economica Federal, exacerbated problems of project implementation,
involving an 18 month delay in starting the reconstruction plan.” She claims that the poor were largely left to their own devices to build their lives again after those disastrous floods.
knowledge and understanding of slope dynamics might cause favela dwellers to reconsider such activities.
In terms of social cohesion, the favelas do have some rudimentary organization, including neighborhood watches and self-improvement societies. However, the level of cohesion has apparently declined over time as the prevalence of drug-related crime and violence has increased. One observer speaks of the prevalence of young, predatory gangs (Maimon 2001), which
contrasts to the kinds of gangs that at one time had a sense of allegiance to favela residents, and would even provide protection for their own.
3.2.4 Likely Future Climate Hazards and Overall Vulnerability Assessment
The Canadian Climate Center’s A2 (business as usual) and B2 (sustainable path) scenarios predict roughly equal average annual temperature increases of 1.5oC by 2050 (see Figure 1). This increase is about the same predicted for Mumbai, but is lower than that of Shanghai. Unlike the other cities, the same approximate 1.5 oC increase is predicted across all four seasons. As mentioned earlier, projected precipitation changes are less reliable, though Canadian A2 and B2 scenarios suggest declines of 7 percent and 2.5 percent, respectively. Rio may have precipitation decreases of 13 percent in the winter months (June-Aug) and the spring (Sept-Nov) for the A2 and B2 scenarios, respectively. Sea-level rise, as mentioned earlier, is predicted to be on the order of 50 cm by 2050.
Potential impacts of precipitation extremes
Given the potential decreases in precipitation during winter and/or spring, it is likely that these seasons will suffer from increased drought. Summer months may also experience drought, as evapo-transpiration increases due to increased temperatures with no offsetting increases in precipitation. Drought conditions could precipitate two kinds of problems. One is water scarcity, particularly if the droughts extend into the Paraíba River basin in Minas Gerais, where Rio obtains the majority of its water. The other is electricity shortages, as were recently experienced throughout the country (Downie 2001).
Although average precipitation during the summer rainy season may decline, increases in sea-surface temperature and in the severity of El-Niño/Southern Oscillation (ENSO) events, could result in periodic flooding of the kind encountered during February 1967 and again in February 1988. The 1967 floods were even more extreme than those in 1988 – 1,985 mm fell over two days (83 percent higher than average annual rainfall) (Baptista de Araújo 1994). Generally, precipitation extremes are expected to increase in severity with climatic change, and these will have adverse impacts on Rio, given that the city already experiences extreme flooding on a 15-20 year basis. Poor neighborhoods are particularly vulnerable to this kind of flooding; roughly 300 people died and more than 20,000 people were made homeless during each event in 1967 and 1988.
Coastal/Marine issues
impact the tourism sector of the economy (Schnack 1993). However, Muehe (2001) indicates that it is unlikely that high rise apartment buildings in Copacabana and Ipanema will be directly impacted by a 50 cm rise in sea-level, even in the event of storm surges.
As mentioned above, Guanabara Bay has lost most of its coastal mangroves, and significant portions of coastal marshes have been filled in. The potential for mangroves or marshes to retreat inland with rising sea level is impeded by the concentrated development along the coast. This will reduce the capacity of the few remaining wetlands to act as buffers during storm surges.
Rising water temperatures may precipitate algae blooms in Guanabara Bay, especially if efforts are not made to treat discharges into the bay.
Overall Vulnerability
Figure 8 provides a schematic diagram of our findings from applying the extended framework of vulnerability to Rio de Janeiro, based on preliminary data. We find that there are three stress bundles that are particularly troublesome for Rio de Janeiro. Each coalesces with a particular set of system characteristics to produce vulnerabilities because of gaps in the Rio’s socio-ecological system that do not allow it to withstand, respond, or cope effectively with these predicted stress bundles.
Temperature increases come together with drought to put stresses on Rio’s drinking water supply. In addition, problems with governance exist that could further hinder the city in
developing more robust potable water storage and delivery systems. Extreme and unpredictable rainfalls and floods converge with projected sea level rise to visit stresses that Rio will likely have difficulty handling due to the city’s topography (narrow coastal shelf backed by steep mountains subject to mass erosion), poor building conditions, the lack of land tenure for a notable portion of the city’s population, poverty coupled with large income inequalities, high rates of crime that reduce social trust, and large problems with sanitations systems and sewerage disposal.
Figure 8. A schematic diagram of the key converging stresses/perturbations from climate, population, and economy, and the sets of characteristics of the Rio de Janeiro socio-ecological system that come together to create vulnerabilities. The dashed arrow suggests a feedback of reinforcing stresses that could endanger the area’s tourism economy due to loss of the narrow beach zone.
Vulnerability of Rio de Janeiro
To Projected Climate Change
Sea level Rise
Economy (Tourism)
Topography
Dikes and armaments (Lack) Temperature
Drinking water/potable water
Governance
Sea level Rise
Topography
Building Codes/Conditions Land Tenure
Poverty/large inequalities Crime
Sanitation/Sewerage Extreme
Based on this preliminary assessment, we conclude that Rio suffers from a significant ongoing vulnerability to climate hazards, particularly flooding and landslides. Although civil defense institutions have been set up to cope with natural disasters, underlying structural problems, including political clientelism and spatial segregation based on income, render the city
vulnerable to climate hazards. Little in the way of concrete flood protection infrastructure has been set up in the wake of the 1988 floods. It is possible to speak of a highly vulnerable sub-population that lives in favelas and near water ways, and relatively less vulnerable upper classes that live in high rises in locations less susceptible to inundation. At the same time, climatic changes are predicted that will likely increase the severity of intense rainfall events and raise sea level. Although the economy of Rio de Janeiro is relatively robust, significant portions of GDP will be required for relief and reconstruction if floods of the magnitude of 1967 and 1988 are repeated. Unless more concerted efforts are made to prepare for climate hazards, the city will remain vulnerable.
3.3 Shanghai
Shanghai (“on the sea” in Chinese) is one of the world's largest seaports and a major industrial and commercial center of the People's Republic of China. It is located at 31o41' north latitude and 121o29' east longitude. Bordering on Jiangsu and Zhejiang provinces on the west, Shanghai is washed by the East China Sea on the east and Hangzhou Bay on the south. North of the city, the Yangtze River (or Changjiang) pours into the East China sea. The municipality covers a total area of 6,185 square kilometers, 0.06 percent of China's total territory, which includes the city itself, surrounding suburbs, and an agricultural hinterland. It is also China's most populous urban area with over 16 million inhabitants according to the 2000 Census.
3.3.1 Physical Environment
Except for a few hills lying in the southwest corner, most parts of the Shanghai area are flat and belong to the alluvial plain of the Yangtze River Delta. Shanghai’s elevation is only 3 to 5 meters above sea level, and averages 4 meters. There are no high mountains in the
neighborhood, only the Jiangshuai Plain and the Huabei Plain to the north, and the Eastern China Sea to the east. Cold air masses from the north and moist, warm air from the south meet and mix above Shanghai without topographical hindrance (Zhang and Wang 1998).
Geologically, the Shanghai area lies in the northeast section of the southern Changjiang land mass. Since the beginning of the Quaternary, this area has undergone tectonic subsidence and global marine transgressions and regressions. With the exception of the west, where there are several scattered stripped kops (igneous Mesozoic rocks), most of the area is covered by
unconsolidated sediments, including fluvial facies, lacustrine facies, and littoral facies, that range in thickness from 100 to 150 meters in the west to 350 to 400 meters in the east (Xu and Tao 1998).
discharge of 9.24 × 10¹¹ cubic meters, and carries an annual sediment load of 4.86× 10⁸ tons.
These sediments feed the delta’s continued seaward expansion (Xu and Tao 1998). The basin drains a humid region, with average annual precipitation greater than 1000 mm, rising to 2000 mm in certain localities (Milliman and Mei-e 1995).
The Shanghai area experiences a subtropical monsoon climate. Frequent summer and autumn typhoons bring not only rainstorms that greatly increase surface runoff, but also cause storm surges in coastal areas. Both significantly modify the geomorphic evolution of the coastal area, as illustrated by Typhoon Number 14 that occurred in 1981. This typhoon created high tidal flats, while simultaneously strongly scouring middle and low tidal flats along the local coast. Waves produced by strong northeast river mouth winds also can cause significant coastal
erosion, which lowers the surface of the tidal flats and promotes shoreline recession (Xu and Tao 1998).
3.3.2 Built Environment
Shanghai has the Uniform System of classifying Urban Land Use and codes, created by the Construction Ministry, to structure different land uses. Typically, the centers of large cities have high population densities. In the Central Districts of Shanghai, the residential land use occupies 30.06 percent of the area. Among these, good and normal residential quarters (codes R2 and R3) account for 82.4 percent of this residential land, while high quality residential quarters (code R1) and poor quality residential quarters (code R4) represent only 2.72 and 12.6 percent respectively.
Figure 9. Built up area of Shanghai (February 1998)
This scene shows the mouth of the Yangtze River in China as seen by the LandSat Thematic Mapper (TM) instrument. The river running northward is the Huangpu River. The city to the west of the Huangpu is Shanghai. Barren and/or recently cultivated land appears red to pink, vegetation appears green, water is dark blue, and artificial structures of concrete and asphalt appear dark grey or black.
Source: NASA, http://svs-f.gsfc.nasa.gov/imagewall/LandSat/shanghai.html
percent of the total area is classified as public facility land. Of this, commercial and financial land occupies only 1.2 percent, a full 10 percent lower than typically found in developed countries. The proportion of the land area devoted to squares and roads is 10.15 percent, which amounts to only 4.44 square meters per person. This is one of the reasons for traffic congestion in Shanghai.
To sum up, the structure of Shanghai’s land use is not wholly rational. To illustrate, Shanghai’s commercial land use area is 10 percent lower than that typically found in cities in developed countries, while that of industrial and warehouse area in the central urban zone is 10 percent higher. As a consequence of the city’s low road density, traffic is heavy on narrow roads which have a small traffic carrying capacity and are incapable of adequately handling large numbers of cars. In addition, many small factories, located in the city, have their warehouses in the suburbs, so that each day raw materials must be transported into town, while finished products must be sent to the suburbs. Green areas in the city are limited, reducing opportunities for recreation (Mei, Wu and Zhu 1998).
In terms of use of water resources, the Huangpu River is Shanghai’s main source of water. There are over 30 waterworks in Shanghai, of which 11 are located in the urban district along the Huangpu River. Five million tons of tap water are supplied each day to the urban district through a complex network of pipes. Each suburban county also has one or two waterworks. Water resources are used in three significant ways in Shanghai; they are industry, agriculture and public water use with a ratio of 3:6:1. The total volume of water available in Shanghai is about 60 billion cubic meters in a normal year, 54 billion cubic meters in a dry year, and 63.2 billion cubic meters in a wet year marked by floods. Yet even in a dry year, such as 1988, consumption was only 12 billion cubic meters, that is about 19 to 22 percent of the available water. Clearly, as far as quantity is concerned, Shanghai has abundant water resources. However, this does not mean that it is without water related problems. One source reports a sharp rise in stomach cancers in children due to polluted drinking water from river intakes (WWIC 1993).
3.3.3 Socioeconomic Conditions
Endowments
Shanghai has over 16 million residents in a densely settled downtown area. Shanghai has an average residential density of 74,600 persons per square km. Owing to stringent application of the “one child” family planning policy, in 1993 Shanghai was the first area in China to report a negative natural growth rate (births minus deaths). The city registered a negative population growth rate of -1.9 per thousand in 2000, based on a birth rate of 5.3 per thousand and mortality rate of 7.2 per thousand. However, rapid rates of in-migration more than make up for declining fertility.
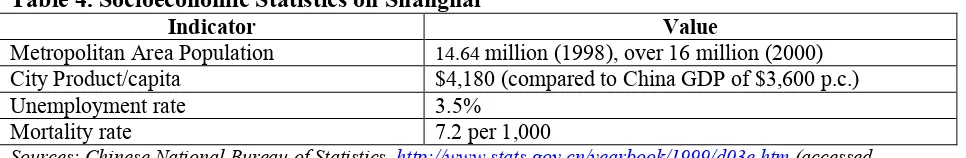
Table 4. Socioeconomic Statistics on Shanghai
Indicator Value
Metropolitan Area Population 14.64 million (1998), over 16 million (2000) City Product/capita $4,180 (compared to China GDP of $3,600 p.c.)
Unemployment rate 3.5%
Mortality rate 7.2 per 1,000
Sources: Chinese National Bureau of Statistics, http://www.stats.gov.cn/yearbook/1999/d03e.htm (accessed 10/26/01),http://www.sh.gov.cn/gb/shanghai/English/BasicFacts/node184/ (accessed 11/14/01),
http://www.photius.com/wfb1999/rankings/gdp_per_capita_0.html (accessed 11/14/01), http://www.shanghai.gov.cn/gb/shanghai/english/economy/index.html, (accessed 11/14/01),
Direct Coping
In August 1998, China experienced devastating floods when the Yangtze overflowed, causing more than 3,000 deaths, affecting 223 million people, displacing 16 million, flooding 25 million hectares of crop land, and causing US$36 billion in damages (Abramovitz 1999, CIP 1998). Heavy rainfall in 1999 also caused flooding, though less extensive. This put disaster
management institutions to the test.
Shanghai has a Municipal Civil Defense Office, which cooperates with the Public Security and Fire Protection agencies. In addition, 284 streets and counties have civil defense organizations, which in turn organize communities into volunteer civil defense teams (China Fire). In August 2001 the Shanghai municipal government organized an international conference on disaster control and emergency services, and invited international and national organizations to
participate in order to learn the state-of-the art in terms of disaster management. This, together with a December 2000 training course in Sustainable Urban Development and Disaster
Management, indicates a strong interest on the part of the municipality in building its capacity to mitigate and cope with natural disasters.