1. INTRODUCTION countries' data, they cover many nations or long Maintaining government spending on time span. No study has focused on one education has been a major goal in Indonesia, developing country's case, especially Indonesia’s. where the government has been struggling since As education spending will have different effect in 2003 to keep the allocation for education at or different circumstances, it is important to study above 20% of the national and regionalbudget, country specific cases. Our paper will attempt to based on Law no. 20 of 2003. Indonesia has this fill this gap by focusing on Indonesia alone. budget requirement for education because The paper will analyze the effect of government believes that it will enhance the government education spending on growth as an country's economic growth. A large body of indirect process through enrollment rate. Thus, it research supports the belief that government aims to find the effect of that spending on spending on education influences economic enrollment rate and economic growth, and the growth significantly (Baldacci, Clements, Gupta, direct effect of school enrollment rate on growth, and Cui, 2008; Barro & Sala-I-Martin, 1995; specifically in Indonesia, using a panel data set of Dauda, 2010; Musila & Belassi, 2004; and 26 provinces from 2000 to 2010.
Prasetya & Pangestuty, 2012). This paper is organized as follows:section 2 While most researchers agree there is provides the literature review, section 3 discusses relationship between the two, some do not the model and the dataset, section 4 presents the consider that government spending must first results, and section 5 offers the policy enhance human capital, to improve education, as implication.
measured by enrollment rate (Baldacci et al.,
2008; Gupta, Verhoeven, & Tiongson, 2002; and 2. LITERATURE REVIEW
Rajkumar & Swaroop, 2007). Increased The relationship between government enrollment rates are likely to expand economic education spending and growth has been widely growth (Jalil & Idrees, 2013; McMahon, 1998; discussed among scholars with various results. and Wolff, 2000). Some researchers assert it has a positive and Although some studies look at the effect of significant relationship, such as Barro & Sala-I-human capital on growth and use developing Martin (1995), Musila & Belassi (2004),
THE EFFECT OF GOVERNMENT EDUCATION SPENDING ON ECONOMIC
GROWTH THROUGH SCHOOL ENROLLMENT IN INDONESIA
NUR INDAH LESTARI Politeknik Keuangan Negara STAN E-mail : nurindahlestari@gmail.com
ABSTRACT
This paper examines the effect of government spending on education on growth as an indirect process through enrollment rate, specifically in Indonesia. Using a panel data set of 26 provinces from 2000 to 2010 and applying fixed effect approach of panel regression, we find that government spending on education has a positive relationship with enrollment with one-year lag; also, the data show that enrollment affect growth significantly. By enacting the chain rule, government spending on education has a positive effect in economic growth indirectly. Together, these findings suggest that raise government spending on education can increase enrollment rate and enhance economic growth.
Baldacci et al., (2008), Dauda (2010), and The first process is the effect of government Prasetya & Pangestuty (2012). On the other hand, education spending on enrollment rate. Lotto (2011) found that, in Nigeria, the Researches claim it is a positive and significant relationship is negative or not significant in the one (Baldacci et al, 2008, and Gupta, Verhoeven, short run while possibly positive in the long run. and Tiongson, 2002); especially, if supported by Additionally, Blankenau and Simpson (2004) good governance (Rajkumar and Swaroop, concluded that the relationship between 2007). Using cross-section data, Rajkumar and education spending and economic growth exists Swaroop (2007) define educational attainment as because government provides financial support the proportion of school-aged children who finish for formal schooling in many countries; however, secondary school. However, Gupta, Verhoeven, there is no clear empirical validation of this and Tiongson (2002), define it as gross relationship because education spending may enrollment ratio in primary and secondary crowd out other growth factors such as tax education; similarly, Mankiw, Romer and Weil structure and government size. (1992) use enrollment rate as a proxy of human
Observing a strong relationship between capital accumulation.
economic growth and public spending on In Baldacci et al. (2008), education is education, many scholars treat the latter as a measured by the summation of primary and direct factor of growth, such as Barro (1990), secondary enrollment rate and given a separate Blankenau and Simpson (2004), Musila and model from the general growth model. Baldacci Belassi (2004), Pradhan (2009), Lotto (2011), et al. (2008) utilize panel data from 118 and Prasetya and Pangestuty (2012). However, developing countries from 1971 to 2000 and studies belonging to the Solow growth model apply one period of lag to education spending. formulated the problem differently. In that They conclude education spending has positive, model's original form, capital investment and significant impact on human capital; and population growth are the determinants of steady indirectly impacts on economic growth.
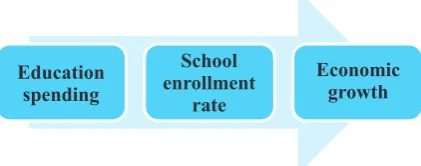
state level of per capita income. Mankiw, Romer, The second process is the relationship and Weil (1992) augment the Solow model by between enrollment rate and growth. Most including accumulation of human capital as well researchers agree that enrollment rate enhances as physical capital investment. Moreover, economic growth by enhancing human capital McMahon (1998) and Baldacci et al. (2008) (Barro and Sala-I-Martin, 1995; Mankiw, Romer, believe education is a key component of human and Weil, 1992; and Wolff, 2000). All of them use capital as the determinant of economic growth. international data; for instance, Mankiw, Romer, From this point of view, government education and Weil (1992) use 98 countries, Barro and Sala-spending should be treated as an indirect factor I-Martin (1995) use 97, and Wolff (2000) use 24 for economic growth through enrollment members of the OECD. A time series approach (Baldacci et al., 2008). Thus, we must first also proves that different levels of education examine the process from government education positively and significantly affect to economic spending to enrollment rate, and then from growth, for example Pakistan from 1960 to 2000 enrollment rate to economic growth. (Jalil & Idrees, 2013).
Using East Asian countries' data from 1965 to 1990 and applying the ordinary least square with correction for heteroscedasticity and autocorre-lation analysis for the data, McMahon (1998) finds that primary education spending from the government is very important in the early period. However, this spending matters less after primary education has generally been Figure 1.Process from education spending to
attained, at which point more should be spent on Hence, we employ a panel approach for both secondary and higher education. Similarly, models. Specification for each equation is shown Agiomirgianakis, Asteriou, and Monastiriotis below.
(2002), employ a dynamic panel data approach to 3.1.1. Education equation
93 countries from 1960 to 1987, and find the The education equation follows the existing effect of education on growth increases linearly literature and makes available the dynamic with the level of education. effects of lagged spending. It is based on Baldacci This study puts together existing literature et al. (2008) and Gupta, Verhoeven, and Tiongson by relating government education spending, (2002). They mainly use gross enrollment ratio enrollment rate, and economic growth in two (GER) as the education variable. They also use processes. First, we use the education equation to many variables to explain GER, such as initial show the effect of government education income, education spending, child mortality, spending on enrolment rate. Second, we use the urbanization, share of female students, and Solow growth model with enrollment rate as a repetition rate. However, due to limited time and measurement of human capital. Finally, using data availability, this paper only used initial both models and applying the chain rule, we income as a control variable. Therefore, the obtain the effect of education spending on general equation is as follows:
growth.
To be consistent with previous research related to growth, we employ a panel data approach in both growth and education equations
to discern not only the time effect, but also the This equation observes the impact of individual effect (Islam, 1995). Using panel data, education spending on GER in each level of we will see the individual effect in each province schooling where it is a proxy of human capital in in Indonesia will in this study. Ours is a regional, the growth equation. The use of gross enrollment not national, analysis. rate as a proxy is consistent with much of the literature examining the role of human capital on 3. MODEL AND DATA growth (Baldacci et al., 2008; Mankiw, Romer, &
3.1. Model Weil, 1992).
To obtain the impact of government Indonesia has four levels of education (see spending on education on growth, this paper uses Appendix 1): pre-school, basic, secondary and general specifications for real per capita income higher education. In this paper, we used basic and growth and enrollment rate as used in the existing secondary education without accounting for non-literature. Baldacci et al. (2008) build a separate formal education. Basic education is primary model for the education equation, using school, while secondary education is consisted of enrollment rate, as a determinant of economic lower and upper secondary school. GERs are growth. Therefore, we employ two models, a taken for each level of schooling. Therefore, we growth model and an education model. In both, had three education equations representing three we include lagged values of government levels of schooling. We used the GER of each spending and education variables. schooling level as the education measurement. Baltagi (2001) argues that panel approach is Some variables that will influence GER, based on the most applicable method for growth model, the equation above are:
(GRDP). where
?“ln” means “natural logarithm”. ·Education Spending (EduSpending). This
? is real GRDP growth.
variable expresses education spending of
? denotes the investment ratio, in terms of
provincial and municipal governments as a
gross fixed capital formation (GFCF) per percent of GRDP. A one period lag account
GRDP. A higher investment ratio raises the for the attainment time of the spending’s
stock of physical capital. impact.
? refers to the stock of human capital, ·htand miindicate the time-specific effect and
represented by GER. The GER of each province-specific effect, respectively.
school's level will be estimated separately to ·eitis error term.
better understand the progress in developing 3.1.2. Growth equation
human capital for each province at different
Drawing upon Mankiw, Romer and Weil
stages.
(1992), the growth equation is based on Solow's
? is summation of population growth,
neoclassical growth framework. It adds human
technological and depreciation rate. Following
capital accumulation to the Solow growth model. Mankiw, Romer, and Weil (1992), we assume that The growth per capita output equation is below is 0.05.
(see Appendix 2 for the derivation): ? defines the lagged logarithm of per capita
income. The negative direction of growth as initial per capita income increases shows that there is a conditional convergence to the steady state.
?ht and mi indicate the time-specific effect and province-specific effects, respectively.
?eitis error term.
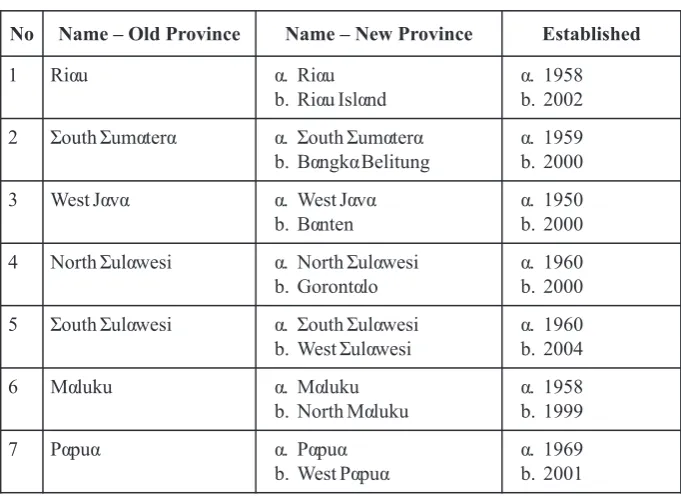
Table 1. Group of provinces
No Name – Old Province Name – New Province Established
1 Riau a. Riau b. Riau Island
a. 1958 b. 2002
2 South Sumatera a. South Sumatera b. Bangka Belitung
a. 1959 b. 2000
3 West Java a. West Java b. Banten
a. 1950 b. 2000
4 North Sulawesi a. North Sulawesi b. Gorontalo
a. 1960 b. 2000
3.2. Data new variables that take into account year before We gathered a panel dataset for 26 provinces 2000 (e.g. growth).
in Indonesia from 2000 to 2010, out of 34
provinces that exist in Indonesia today. Some 4. EMPIRICAL RESULT AND new provinces are regrouping back into old DISCUSSION
provinces (before expansion) and therefore The aim of this study is to investigate the cannot provide comparable and consistent data effect of education spending at a provincial level (see Table 1 for group of provinces, and Table 2 on economic growth indirectly through for more description of the data). enrollment. Tables 2 and 3 show results for Data for GRDP, GFCF, and GER are from growth and education equations. Per previous Statistic Indonesia, while data for spending is discussions, we used the panel approach to from Ministry of Finance. At start, we had 286 estimate the education equation and growth data points, but only 260 were effective after model. The panel method has two kinds of effect, regression due to limited availability of data (e.g. fixed and random. We employed the Hausman GER of Aceh in 2000 and 2001) and generating test before running the regression in order to
Variable Observation Mean St deviation Min Max
Real per capita GRDP growth 260 0.03 0.05 - 0.32 0.47
Income level (log of real per capita GRDP) 286 1.19 0.64 0.72 3.79
Investment ratio (log of GFCF per capita GRDP) 286 - 1.73 0.47 - 3.56 - 0.93
Primary gross enrollment ratio 284 1.08 0.04 0.91 1.18
Lower secondary gross enrollment ratio 284 0.81 0.09 0.51 1.01
Upper secondary gross enrollment ratio 284 0.57 0.13 0.29 0.95
Education spending (per GRDP) 286 0.04 0.04 0.00 0.37
Total Spending (in logarithm form) 286 14.86 0.86 11.93 16.81
Population growth 260 0.02 0.01 0.003 0.05 Table 2. Summary descriptive statistics
Note. Ministry of Finance, Statistic Indonesia
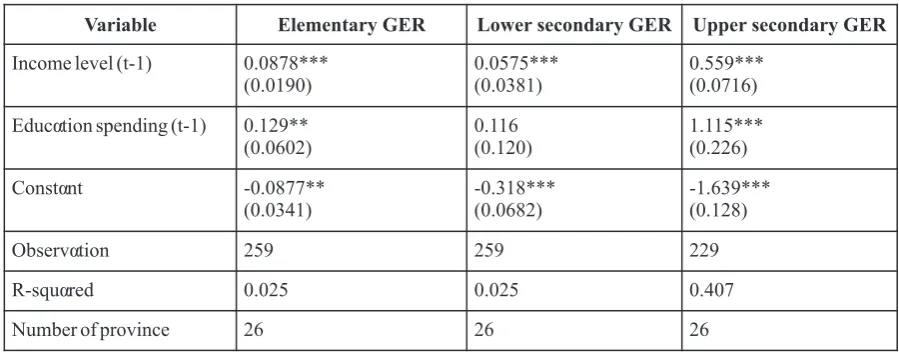
Table 3. Education equation
Standards errors in parentheses *** p<0.01, ** p<0.05, * p<0.1
Variable Elementary GER Lower secondary GER Upper secondary GER
Income level (t-1) 0.0878*** (0.0190)
0.0575*** (0.0381)
0.559*** (0.0716)
Education spending (t-1) 0.129** (0.0602)
0.116 (0.120)
1.115*** (0.226)
Constant -0.0877** (0.0341)
-0.318*** (0.0682)
-1.639*** (0.128)
Observation 259 259 229
R-squared 0.025 0.025 0.407
obtain the best panel approach. The results of the coefficient of income level means that an Hausman test (see Appendix 3), for both models, additional 1% in income will increase GER by showed that applying fixed effect is more 0.09, 0.06, and 0.56 point in elementary, lower appropriate. In most cases, the coefficients are secondary, and upper secondary school, statistically significant and the directions areas respectively.
expected (see Appendix 4 and 5 for more detail
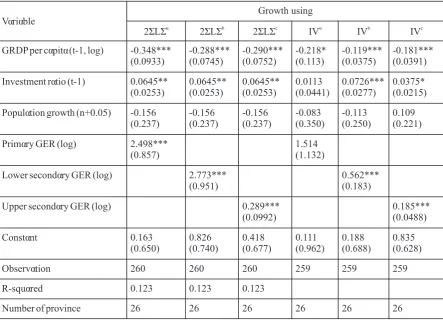
results). 4.2. Growth Equation
The impact of different levels of schooling 4.1. Education Equation on economic growth may vary between nations Gov ernment spending on education positively (Jalil & Idrees, 2013); also, within regions of a affects GER after a one-year lag. Baldacci, et al nation. In the human capital augmented (2008) found the similar result. The coefficient production function (growth equation), we implies that an increase in education spending of substituted the human capital variable with GER 1% of GRDP would increase enrollment rates by of each level of schooling to measure the effect a factor of 0.13 for primary, 0.12 for lower from each of them on growth. We separated secondary, and 1.12 for upper secondary in the primary, lower secondary, and upper secondary following year (see Table 3). school into three equations to avoid the risk of The income level also matters significantly multicollinearity, which would lead to incorrect to GER, especially last year income. The inferences.
GRDP per capita (t-1, log) -0.348*** (0.0933)
Observation 260 260 260 259 259 259
R-squared 0.123 0.123 0.123
Number of province 26 26 26 26 26 26
a
Regression using primary gross enrollment ratio b
Regression using lower secondary gross enrollment ratio c
Regression using upper secondary gross enrollment ratio Standards errors in parentheses
*** p<0.01, ** p<0.05, * p<0.1
All levels of GER were found to positively capita have negative directions, which implies and significantly contribute to economic growth that each province in Indonesia will converge to a at a 1% statistical significance level, whether steady state. This result matches the convergence using 2SLS or IV regression, except for an concept in the neoclassical growth model (Solow, insignificant coefficient of primary GER using 1956) which says that a country's per capita respectively. In the IV regression, the instrument growth through enrollment rate
variables are education spending ratio in terms of We calculated the effect of government GRDP per capita, total value of education education spending on growth through spending, initial income, and log of population enrollment rate based on the marginal effect of growth. The coefficient of GER means that a 1% education spending on GER and the marginal increase in the lower and upper secondary GER effect of GER on growth. Based on the chain rule, should increase the growth rate by 0.056 and the multiplication of these effects will be the
30
0.019 percentage points , respectively. effect of education spending on growth.
These results are in line with McMahon The table 5 shows that increasing 0.01 (1998) and Jalil and Idrees (2013). They could be percent of education spending in terms of GRDP due to investment in human capital by household will increase growth by 0.003 point using 2SLS or government, as well as physical capital, but regression; while using IV regression, 0.01 probably not the technological progress largely percent increase of education spending will responsible for the high per capita growth in East increase growth by around 0.002 point. Asia (McMahon, 1998). Therefore, government spending has a positive
Another interesting matter is the coefficients impact on economic growth. of initial GRDP per capita. In both 2SLS and IV
regression, we found that initial GRDPs per 5 .
C O N C L U S I O N A N D P O L I C Y
________________________________
IMPLICATION
29
See Wooldridge (2002) chapter 2,p.45 on the summary of This study attempted to examine the effect of
functional forms involving logarithm. For a level-log model,
government education spending on growth
the interpretation of So, a one percent
through school enrollment in Indonesia during
increase in x will raise y by
30
Loc.cit. the period 2000 to 2010.It has investigated using
Marginal Effect Elementary GER Lower secondary GER Upper secondary GER
a
Education spending on GER 0.129 0.116 1.115
b
GER on growth (2SLS) 2.498 2.773 0.289
b
GER on growth (IV) 1.514 0.562 0.185
c
Education spending on growth (2SLS) 0.322 0.322 0.322
c
Education spending on growth (IV) 0.195 0.065 0.206 Table 5. Marginal Effect
fixed effect of panel data regression with 2SLS 3. Education is considered a channel of and instrument variable. The main findings are as technological transfer and a way to boost
follows: economic growth. To accelerate regional
1. For the education equation, standard panel growth, especially in relatively diverse data regression by using fixed effect regions, government can provide talented approach clarifies that education spending citizens from relatively backward regions has a positive relationship with enrollment with scholarships, encouraging their ratio in all levels of education with 1% education in more developed regions or even significant level in upper secondary school, abroad. As a condition, citizens would have 5% significant in primary, and not to return home and develop their region, significant in lower secondary. The latter becoming change agents toward a better effect is because fewer labor forces are taken condition.
from lower secondary school. 4. West Nusa Tenggara was the province with 2. For the growth equation, panel data the lowest economic growth surveyed. We regression using either 2SLS or the suggest its local government allocate more instrument variable shows that enrollment of its budget to the education sector or other rate has a positive relationship with productive sectors such as health and infras-economic growth at a 1% statistical tructure. this province's economic condition significant level, except for the instrument will therefore improve.
variable, and elementary school, where the 5. There is a one-year lag between increase in relationship is insignificant. This is probably education spending and effect on school due to an already high elementary enrollment rate and growth. Government
enrollment rate. should allocate more resources to school
3. The chain rule confirms a positive effect of infrastructure, school needs, or facilities education spending on economic growth such as classrooms, libraries, and books. The through school enrollment. Increasing that impact of government spending on spending will increase that growth. education will probably increase since 4. Indonesian provinces tend to show a facilities of schools are well developed and
conditional convergence to the steady state, maintained.
including negative direction for the initial 6. Provinces with low economic growth should income level. Thus, all regions will have increase the quality of not only formal similar growth rate, even though the speed of schooling but also informal schooling. convergence of each province may differ. Better schools will push pupils to improve The policy implications of this study are as their knowledge, and skill. Later on, citizens
follows: of each province will be a good labor force
1. Having a wide variation of provinces in or, even better, create job themselves. Indonesia and a large education budget, Therefore, every region can enhance their government should create an education economic growth by enriching their society. system fostering collaboration between
central government, local governments, 6. REFERENCES schools, associations, and communities to
support the implementation of policy. A g i o m i r g i a n a k i s , G . , A s t e r i o u , D . , 2. We can learn from developed countries. The &Monastiriotis, V. (2002). Human capital Japanese educational system, for instance, is and economic growth revisited: A dynamic built on four levels: central, prefectural, panel data study. International Advances in municipal, and scholastic. Those levels allow Economic Research, 8(3), 177-187.
Baldacci, E., Clements, B., Gupta, S., & Cui, Q. disaggregated time series data of Pakistan. (2008). Social spending, human capital, and Economic Modeling, 31, 383-388.
growth in developing countries. World
Development, 36(8), 1317-1341. Keller, K. R. I. (2006). Investment inprimary, secondary, and higher education and the Baltagi, B. (2001). The Econometrics of Panel effects on economic growth. Contemporary
Data (2nd ed.). New York: John Willey & Economic Policy, 24(1), 18-34. Sons.
Krueger, A. B., and Lindahl, M. (2001). Barro, R.J. (1990). Government spending in a Education for growth: Why and for whom? simple model of endogenous growth. Journal of Economic Literature, 39, 1101-Journal of Political Economy, 98(S5), 103- 1136.
125.
Lotto, M. A. (2011). Impact of government Barro, R.J. (1991). Economic growth in a cross sectoral expenditure on economic growth. section of countries. The Quarterly Journal Journal of Economics and International of Economics, 106, 407-443. Finance, 3(11), 646-652.
Barro, R. J.,&Sala-I-Martin, X. (1995). Mankiw, N. G., Romer, D., & Weil, D. N. Empirical analysis of a cross section (1992).A contribution to the empirics of countries. Economic Growth. Singapore: economic growth. The Quarterly Journal of
McGraw-Hill. Economics, 107(2), 407-437.
Blankenau, W. F.,& Simpson, N. B. (2004).
Public education expenditures and growth. McMahon, W. W. (1998). Education and growth Journal of Development Economics, 73, in East Asia. Economics of Education
583-605. Review, 17(2), 159-172.
Dauda, R. O. S. (2010). Investment in education
and economic growth in Nigeria: An Musila, J. W., & Belassi, W. (2004). The impact empirical evidence. International Research of education expenditures on economic Journal of Finance and Economics, 55, 158- growth in Uganda: Evidence from time
169. series data. Journal of Developing Areas,
38(1),12-133. Gupta, S.,Verhoeven, M.,&Tiongson, E. R.
(2002).The effectiveness of government Pradhan, R. P. (2009). Education and economic spending on education and health care in growth in India: Using error correction developing and transition economies. modeling. International Research Journal of European Journal of Political Economy, 18, Finance and Economics, 25, 139-146. 717-737.
Prasetya, F., & Pangestuty, F. W. (2012). Islam, N. (1995). Growth empirics: A panel data Linkages between public sector expenditure approach. The Quarterly Journal of on economic growth and rural poverty in Economics, 110(4), 1127-1170. Indonesia. Journal of Basic and Applied
Scientific Research, 2(3), 2347-2353. Jalil, A., & Idrees, M. (2013).Modeling the
matter? Journal of Development Economics, Wolff, E. N. (2000). Human capital investment
86, 96-111. and economic growth: Exploring the
cross-country evidence. Structural Change and Solow, R. (1956). A contribution to the theory of Economic Dynamics, 11, 433-472.
economic growth. The Quarterly Journal of
Economics, 70(1), 65-94. Wooldridge, J. M. (2002). Introductory
nd
Econometrics (2 ed.). Canada: South-Teles, V. K., & Andrade, J. (2008). Public Western.
Apendix 2. Derivation of growth equation
Following Mankiw, Romer, and Weil (1992) model, the equation started with Solow growth model by adding human capital accumulation and featuring Cobb-Douglas production function is:
Where Y is output, H is human capital, K is physical capital, L is labor, and A is the level of technology. L and A are assumed to grow exogenously at rates n and g so that:
The intensive form of the Solow production function by defining all variables per effective labor is:
Assuming both physical and human capitals are accumulating factors, their equations of motion for are: Physical capital:
Thus, the motion for physical capital is
Age Grade Level Formal Education Vocatinal Education Non-formal
Education
Strata 1,2,3 (S1, S2, S3) are equalivalent to Bachelor Master, Ph.D.
Specialist programs are programs for academic and/or professional futher education Basic education is compulsory and free of change
Pre-school is optional
Appendix 1. Table of education system in Indonesia
Substituting equation (8) and (13) to equation (11), then: Human capital:
Thus, the motion for human capital is
s s
Where is saving rate of physical capital, is saving rate of human capital, and k h d is depreciation rate that assumed to be the same for both physical and human capital.
Substituting equation (14) and (15) to (8), we got:
Taking natural logarithm for equation (16) gives the steady state for output per effective labor is
Following Mankiw et al. (1992) and Islam (1995) by considering that the equation (17) explains the steady state behavior; y* be the steady state level per effective worker; and let y(t) be its actual value at any time t, the speed of convergence is given by:
The model suggests a natural regression to study the rate of convergence ë. The equation (18) implies that:
Where y(t )1 is income per effective labor at some initial time. Subtracting both side with lny(t )1 yields
Substituting y(t)* into the equation (20):
Reformulate equation (21) in terms of income per capita. Note that income per capita per effective labor is:
Taking the logarithm of the equation above, thus,
Replace all y(t) in the equation (21) using the equation (22) gives
Equation (23) is the steady state level of growth in term of output per capita. Thus, in the Solow model the growth income is a function of saving rate of physical capital (sk), saving rate of human capital (sh), population growth, technological and depreciation rate (n + g + ä), and initial level of income y(t1).
Following the conventional notation of panel data that applied by Islam (1995), the equation is:
where:
![Implementasi Model Pohon Keputusan Untuk Mengklasifikasi Masa Studi Mahasiswa Menggunakan Algoritma C4.5 [Universitas Diponegoro].](data:image/gif;base64,R0lGODlhAQABAIAAAP///wAAACH5BAEAAAAALAAAAAABAAEAAAICRAEAOw==)