Exploring Research
Data Management
Published by Facet Publishing
7 Ridgmount Street, London WC1E 7AE www.facetpublishing.co.uk
Facet Publishing is wholly owned by CILIP: the Library and Information Association.
The authors have asserted their right under the Copyright, Designs and Patents Act 1988 to be identified as authors of this work.
Except as otherwise permitted under the Copyright, Designs and Patents Act 1988 this publication may only be reproduced, stored or transmitted in any form or by any means, with the prior permission of the publisher, or, in the case of reprographic reproduction, in accordance with the terms of a licence issued by The Copyright Licensing Agency. Enquiries concerning reproduction outside those terms should be sent to Facet Publishing, 7 Ridgmount Street, London WC1E 7AE.
Every effort has been made to contact the holders of copyright material
reproduced in this text, and thanks are due to them for permission to reproduce the material indicated. If there are any queries please contact the publisher.
British Library Cataloguing in Publication Data
A catalogue record for this book is available from the British Library.
ISBN 978-1-78330-278-9 (paperback) ISBN 978-1-78330-279-6 (hardback) ISBN 978-1-78330-280-2 (e-book) First published 2018
Text printed on FSC accredited material.
Cover design by Kathryn Beecroft
Typeset from author’s files in 11/14pt Revival 565 and Frutiger by Flagholme Publishing Services.
Contents
List of tables and figures xi
1 Introducing research data management 1
Aims 1
A thought experiment 1
RDM 4
Why is RDM important now? 5
What does the practice of supporting RDM actually involve? 6
Who is this book for? 6
About the book 7
Further reading 9
2 The social worlds of research 11
Aims 11
Introduction 11
The research landscape 11
The organisation of research 13
The research lifecycle 16
The experience of research: research and identity 16
Further reading 18
3 What are research data? 19
Aims 19
Research data are important to (some) researchers 19
Types of research data 21
Some definitions of research data 22
Data collections 25
Data lifecycles 26
Research data is complex 27
Information management and RDM 30
4 Case study of RDM in an environmental engineering 33 science project
Aims 33
The project 33
The research method 34
The data 35
The challenge of metadata 37
The need to foster a culture around metadata 37
Data sharing 38
Talking to researchers 39
Further reading 40
5 RDM: drivers and barriers 41
Aims 41
Introduction 41
E-research 42
The ‘crisis of reproducibility’ 43
Open science 45
Government and funder policy 46
Policy developments 48
Journal policies 50
FAIR data principles 50
Data citation 51
RDM and the new public management 52
Drivers and barriers 53
Further reading 55
6 RDM as a wicked challenge 57
Aims 57
Types of problem 57
The wicked challenge concept 58
Is RDM wicked? 60
Leadership in a wicked challenge context 62
Further reading 64
7 Research data services 67
Aims 67
Research data services (RDS) 67
Vision, mission, strategy and governance 69
Stakeholders 71
Further reading 73
8 Staffing a research data service 75
Aims 75
New activities and roles 75
Who does what? 79
The collaborative research data service 81
New skills and roles 82
Further reading 83
9 Requirements gathering for a research data service 85
Aims 85
Finding out more about an institution 85
Surveys 86
Interviews and focus groups 92
Further reading 93
10 Institutional policy and the business case for 95 research data services
Aims 95
Writing a policy 95
Developing a policy 95
Content of a policy 97
Layout and style 99
Using and updating the RDM policy 100
11 Support and advice for RDM 101
Aims 101
Offering support and advice 101
Making the RDS visible 102
Frequently asked questions 103
The RDM website 105
Key challenges for advice and support 106
12 Practical data management 107
Aims 107
Introduction 107
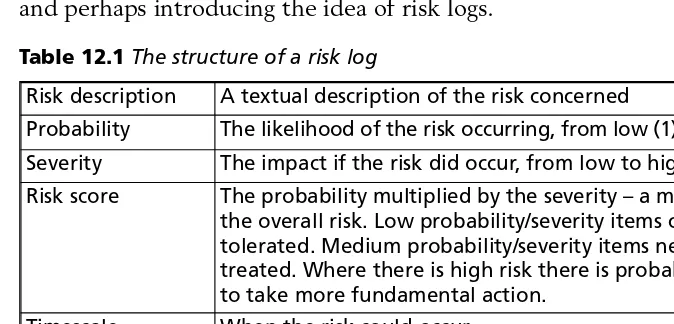
Risks and risk management 111
File organisation and naming 112
Back-ups of active data 113
Promoting practical data management 113
Further reading 113
13 Data management planning 115
Aims 115
The data management plan 115
The benefits of DMPs 116
The content of a DMP 117
Reading an example DMP 119
Common pitfalls 121
Supporting data management planning 121
Further reading 123
14 Advocacy for data management and sharing 125
Aims 125
Introduction 125
Drivers for data sharing 127
What should researchers do to promote data use and 128 re-use?
Panda talk 129
Some responses 132
Changing the culture 135
Further reading 136
15 Training researchers and data literacy 139
Aims 139
Introduction 139
Step 1: Who is the training for? 140
Step 2: What topics need to be covered? 141
Step 3: Who should deliver the training? 142
Step 4: How should the training be delivered? 142
Making and re-using educational resources 144
Step 5: How is the training to be made engaging? 144
Step 6: Evaluating training 144
Getting the right mix 145
Further reading 146
16 Infrastructure for research data storage and 147 preservation
Aims 147
Technical infrastructure 147
Selecting data for deposit 149
Preparing data: metadata and documentation 152
Preparing data: file formats 154
Ingest 154
Providing access to consumers 155
Further reading 157
17 Evaluation of RDS 159
Aims 159
Introduction 159
Principles of evaluation 161
Measuring impact 162
A balanced scorecard approach 166
Maturity models 167
Further reading 170
18 Ethics and research data services 173
Aims 173
An ethical service 173
Research ethics 174
Dilemmas for RDS 175
Ethics in professional relationships 176
Further reading 177
19 A day in the life working in an RDS 179
Aims 179
RDM in practice 179
Strategic development 179
Advocacy, training and support 181
Repository work 182
RDM day to day 184
20 Conclusion: the skills and mindset to succeed in RDM 187
Aim 187
Working in RDM 187
Your career plan and RDM 189
Keeping up to date 192
Index 195
List of tables and figures
Tables
3.1 Some formats of data 21
3.2 Some types of data 22
12.1 The structure of a risk log 112
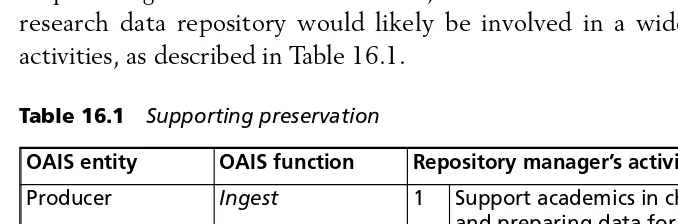
16.1 Supporting preservation 148
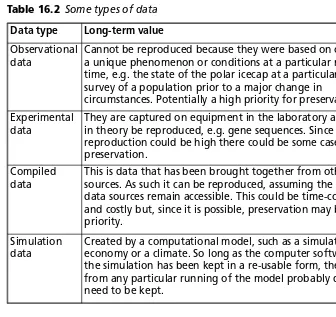
16.2 Some types of data 151
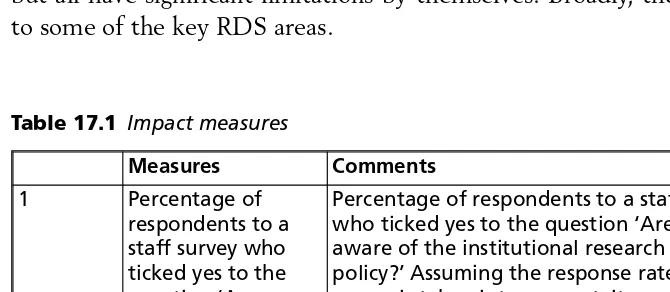
17.1 Impact measures 162
17.2 Maturity model for evaluation of RDS 168
Figures
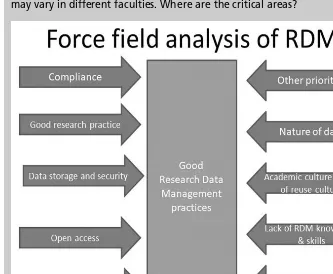
5.1 Force field analysis of RDM 55
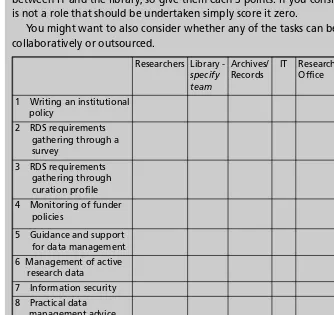
8.1 Scoring chart for new tasks that could be 77
created by RDM
CHAPTER 1
Introducing research data management
Aims
The aims of this chapter are to:
• introduce the topic of research data management (RDM) and what it means in practice
• explain the thinking behind the book, so you can use it effectively.
A thought experiment
Imagine going to a busy researcher’s office:
• What would you expect to see?
And if you asked them about their research history:
• What would their story be like?
And if you asked them specifically about the ‘data’ that they collect as part of their research:
• What types of data would they say they have? • How much data would they have?
• How would they store and back up their data? • Who would they say owns the data?
• Would they say they share the data with others, or not?
Well, I am embarrassed to say my office is pretty untidy: a table strewn with papers; three bookshelves packed with books, reports, print-outs – a lot relating to research, but also teaching. A filing cabinet, which if you unlock it, is jam-packed with various papers, including some things like hand-drawn maps of an area of Sheffield; a stack of completed questionnaires; a roll of flipchart paper covered with Post-it notes, from a data collection workshop last year. All that is stuff I have gathered for my research. There are quite a few folders of interview transcripts as well. Some go way back! Also in there are some old-looking memory sticks. I wonder what’s on them myself!
Of course where I work most of the time is here at the computer. Again, it’s going to be hard for me to summarise what is on the computer. Here is a secure network drive where I keep a lot of project work – or used to – alongside files relating to teaching. The university also has a secure Google drive service. There is also a research data server. I guess I basically keep material in folders by project. But quite often it’s a bit more complicated than that. For example, I might re-use material across a number of projects.
As regards my research journey, I have been working here for about 10 years. In that time I have participated in I don’t know how many different projects. They are clustered around a few areas where I have really had an ongoing fascination, e.g. RDM itself, but also experiences of library space. And quite a lot relating to various social media research projects I have done. Quite a few projects were one-off, just pursuing an interest I had at the time. There are some projects where I worked on my own. Often with a research assistant who collected and maybe analysed some of the data. In other cases it was part of a much larger project that was funded, had a number of partners and where we shared various tasks, including gathering and analysing data. There was also PhD students’ work where they were the lead and I supported them through the research process. But even at the current moment I am working on at least a dozen projects at once! That is excluding PhD student and Masters dissertation work, both of which also involve original data collection.
In terms of data, as I am a qualitative researcher, so I have lots of interview recordings and resulting transcripts. I have also done quite a lot with visual data like photographs, hand-drawn maps and diagrams. I have also done work through questionnaires, be that printed or online. Hence lots of Excel and SPSS files.
Stuff is backed up mostly on the university servers, but via a number of pots, such as my personal university drive (but that is pretty full!). In the last couple of years the university cloud storage has come in. At first I must admit I didn’t like it, but now I’m using it more and more both for day-to-day sharing of project documents like plans and the data we have gathered. There is also a specific research data server which the computer service has just set up for my research group. I’m just starting to use that too. Plus, of course, any print-outs, etc., in the filing cabinet, or a locked drawer of my desk.
I kind of realise that the university legally owns the data, but it’s me that cares about it and uses it.
In the past there has not been so much data sharing; but things are changing. We just shared data from a survey about bibliometrics on the university data repository. We have also shared data related to publications. I’m in favour of data sharing, but in reality we have only begun to get into the habit of sharing data. If I’m honest I’m doubtful if most of it would be much use to another researcher, as it’s very specific to my project. Equally I haven’t myself re-used data created by another researcher – though that is a very appealing idea!
Maybe you imagined something very different. That does not mean you are wrong. One of the most significant features of RDM is that we cannot easily generalise across different researchers’ behaviour.
The answers Andrew gave are probably not untypical for a qualitative social scientist. Such researchers have lots of data files, of a variety of types, from many projects, but it is not ‘big data’. They store the data in various places. They have a lot of stuff, which is managed in a rather ad hoc way – sometimes off university servers. Sharing research data is a fairly new idea. A researcher in another discipline might have a very different experience. They could be generating massive quantities of data through complex, multi-million dollar collaborative research projects. This could throw up a very different set of issues.
INTRODUCING RESEARCH DATA MANAGEMENT 3
Exploring further
Thinking about this situation one can begin to see there are a number of potential problems in Andrew’s behaviour, attitudes and expectations. RDM is precisely about making the management of data more effective.
RDM
Research data management (RDM) is about creating, finding, organising, storing, sharing and preserving data within any research process.
Improving how research data are managed day to day, and particularly promoting its sharing and re-use, has the potential to increase the richness and reliability of research.
Thinking of Andrew’s experience we can identify a number of issues that Andrew has:
• He doesn’t have big data but he does have a lot of different types of data, of varying types – how is he going to manage this data more effectively so he can be sure to find material himself in the future? • Even if he can find the data file again, will he be able to remember its
context? Is it adequately documented?
• Within his collaborative projects, is he managing access to live data securely?
• Some of this data appears to need keeping beyond the length of the project – is this being done securely where appropriate?
• How can Andrew be motivated to prepare his data so others can re-use it for other research?
• How can he be helped to re-use data that has already been collected?
All these issues create potential problems around day-to-day management of data, file storage and security, sharing and re-using of data.
This thought experiment gives us a first insight into the kinds of problem that research data management deals with: how to help researchers manage their data much better, for their own good, but also for the wider benefit of research. We can see that it’s a complex area, where there are a host of potential problems that people might need help
Exploring further
Perhaps you have a friend who does research. If you have, go and ask them some of the questions we have discussed above. Or find a friendly researcher to chat to over a cup of coffee.
INTRODUCING RESEARCH DATA MANAGEMENT 5
with but which has to engage with the extreme individuality of research in different areas.
Why is RDM important now?
This issue of managing research data has become a key issue now, driven by a number of factors. Firstly, the ‘deluge of data’ arising from new types of science, a crisis in confidence in research integrity in certain fields and the general movement for open data have led to increasing concerns around managing data better and sharing it more. Many funders around the world now require that researchers plan this much better. Also to get their articles accepted by journals researchers increasingly need to publish the data on which their results are based. In response many universities (and other research organisations) have set up institutional research data policies, training and advice services, and perhaps a repository or catalogue describing institutional data holdings. Typically research data services are being developed within universities, led by people from computing services, libraries and/or research administration.
This book is for people who want to get involved in supporting RDM in such ways. It may not sound so hard to do this, but it is about managing a change in how researchers do things day to day, fitting the needs of specific institutions and its wider policies, but also changing longstanding cultures in research fields, in a context of changing technologies. So it is a major professional challenge for those who support improvement in RDM.
Exploring further
Do some desk research to find out what is going on in your own institution, be that where you work or where you are studying.
• Is there a policy relating to research data? If so, what does it say, and how does it fit into the wider structures of research governance? Can you work out where leadership for RDM sits?
• Is there a website for RDM? Who runs it? • What training is being offered?
• Is there a data repository? What type of material is stored there?
What does the practice of supporting RDM actually involve?
Another immediate way of trying to understand what RDM is about is thinking about the kind of questions professionals supporting RDM might be asked. It could be things like:
• How can I locate data for re-use in my research?
• How do I complete a data management plan for a research proposal for a particular funder?
• I want to share data with a project partner at another institution. Where should I store research data to share it securely?
• Where is the best place to store my data for long-term preservation? • How would I cite someone else’s data in my journal article?
These are actually quite complex questions. For example, where a researcher might find data for a particular project is, obviously, highly dependent on their specific research questions. Similarly, different funders have very different views on what a data management plan should contain. Local arrangements for active data storage and sharing and data preservation are very specific.
Who is this book for?
This book is for anyone interested in building their understanding of RDM, particularly in a university context. Your background could be in:
• libraries, because librarians have many relevant skills in training and advice, metadata creation
• computing, because there are many technical issues around the storage of active and archival data
• archives and records management, because archivists are particularly interested in aspects of preservation of any kind of data that is produced
Exploring further
• research administration, because many of the issues link to the wider governance of research, including research integrity and relations with funders of research
• research itself, because many of the issues around RDM relate to understanding the motivations and methods of research.
Or your background could be in something else. We do not assume a particular professional background or prior knowledge in this book.
You could be a student in one of these fields. We have not assumed you already have a specific role. If you work at a particular institution you will often want to explore further within your own organisation or comparable ones. If you are a student it probably makes sense to identify one or two institutions that interest you and consistently work on exploring your understanding of that institution through the activities in the book. That will give you a more holistic viewpoint.
If you are thinking of working in this area you will be looking out for adverts for jobs with titles such as:
• RDM co-ordinator • Data librarian • Data curator
• Research data service officer/assistant • Research data metadata specialist.
Some are more specialist than others, but by reading the book you will gain a much clearer idea of the subtle differences in role and where your skills might take you.
On the other hand you may have no intention of directly being involved in such dedicated RDM roles, but realise it is of relevance to you more indirectly. For example, it may simply be an aspect of appreciating the wider context within which you work. This book is intended to be a good place to start to grasp the dimensions of RDM and how it might touch your current role.
About the book
organisations, so professionals working in this area need to work out how general principles fit their institution. In the book we want to stimulate your curiosity, enterprise and creativity in working out solutions to complex problems for all sorts of researchers based in all sorts of institutions. So the book is not a dry reference work full of largely unexplained acronyms or an insider account for other insiders. It briefs you succinctly and engagingly on the main issues. It combines this grounding with many quotes, stories and case studies, diagrams, ideas and provocations, together with tasks to undertake to make learning about RDM thought-provoking and stimulating.
We have included a lot of ‘Exploring further’ sections, because to really learn about RDM you will need to get out there, find out more about specific organisations and research cultures, and start talking to people. RDM is not a solved problem. It’s complex, particularly the challenges around influencing longstanding research cultures. The support needs of different academic disciplines are very different. And the challenges vary between institutions, too. This book is the starting point for you to open up a positive dialogue for partnership with researchers, in order to develop research data services (RDS) suitable for a specific context. We have used many of the activities in workshops about RDM, and they work well as collective exercises. You may want to share your voyage of discovery with others, or use them in cascading your understanding to colleagues.
Much of the book is based on the authors’ own experiences of trying to understand RDM and develop services in their context. We also worked together on the RDMRose project, which developed a set of training materials on RDM (specifically for librarians, but generically useful). We have also published a number of pieces of research work that inform the
Exploring further
If you are working in an institution already, find out who is involved in RDM in organisations local to yours; drop them an e-mail, introducing yourself and inviting them for coffee. Find out if there is a local professional interest group around RDM in your area. Our experience is that this community will be helpful. Also look online for groups that you can join who discuss RDM.
book. It is also based on reflecting on our personal experiences as researchers. Andrew has a PhD in information science, Eddy in history.
Yet we would not want to say this book is highly original; rather, it’s more a distillation of knowledge gained from talking to people working on RDM over the last five years. Our aim was to capture something of their values, skills and ways of thinking and talking. As such it should help you to understand how you can fit into and contribute to this world.
Further reading
While far from comprehensive, Bailey’s rolling Research Data Curation Bibliography(2017) is a good starting point for getting a feel for the literature around RDM. Some searches, such as for keywords you are interested in, will give you a feel for some of the main writings around a particular topic. Searching by date will give you a feel for what people are writing about at the moment.
Bailey, C. W. (2017) Research Data Curation Bibliography, http://digital-scholarship.org/rdcb/rdcb.htm.
CHAPTER 2
The social worlds of research
Aims
The aim of this chapter is to prompt you to reflect on the nature of research. By definition, if we are going to support RDM, we need to have some understanding of the intellectual and social organisation of research.
Introduction
If you come from an academic library background you may well have been attracted to the profession by an enthusiasm for information literacy. Libraries have made huge strides in the last few years towards making a very strong contribution to teaching in universities. Now we seem to be seeing a turn towards more support to research. Something of the same trend seems to be happening in IT services. In this context it is useful to reflect more on the current research landscape. You may work in research administration, in which case much of this will be familiar, but it is worth stepping back and reflecting on one’s assumptions about research.
The research landscape
Research is a central activity for many universities. It is a key source of revenue: a multi-billion dollar business. Ideologically it is core to many university missions: particularly in ‘research-intensive’, elite institutions it is really what defines their special status.
Some key features of research you might have thought of earlier are:
• Funding – the competitive struggle to gain funding for research is central to many researchers’ lives. Gaining a grant means having the
Exploring further
resources to do bigger scale work and come up with more significant findings. Thus the positon of funders on RDM is critical.
Nevertheless, it should be remembered that much research is still unfunded, or perhaps more accurately funded by institutions
themselves through the time they give academic staff to do research. • Projects – a lot of research, similarly to professional support work, is
organised in projects. This colours a lot of research-related behaviour, e.g. it shows up in how people store their personal files. Thus, they are fixed-funded for a limited time period with fairly clear
deliverables. This has consequences for RDM in terms of what happens when the project finishes. At project end there may be no resources for doing work on sharing data.
• Publication – the ultimate aim of academics is typically to produce a peer-reviewed publication, be that a journal article, conference paper or a book. Research data are the foundation of the findings, but it is not always seen as a valid output in itself. This may affect RDM in terms of the motivation to publish data: for one thing, the infra -structure for finding, sharing and citing data is much less familiar than that for publishing outputs. The institutional and peer recognition that comes from data sharing may be far less than for publishing results. • Big science – a significant amount of research takes place in
multi-million dollar projects, involving expensive equipment. Such projects may generate huge amounts of data.
• Collaboration – funders favour collaborative work. They increasingly want work that solves real-world problems, which implies
collaboration of multiple experts, because it gives the scale of resource to explore a problem and a range of different expertise. • Interdisciplinarity – as well as collaboration between researchers
there is often an interest by funders in greater working across established disciplinary boundaries. By combining expertise from different subjects it is more likely to be possible to come up with innovative solutions.
• Social impact – funders increasingly value research that has a benefit to society, be that through directly addressing urgent social problems or stimulating economic growth.
Mode 2 summarises many of the changes we have already mentioned towards short-term, project-based, interdisciplinary collaborations to solve a specific societal problem in a particular domain of application. The shift to Mode 2 is seen as driven by funding priorities.
• Digital scholarship – can refer to a wide range of new and not-so-new behaviours, but it points to more networked researchers who work together in more informal ways.
• Research-led teaching and undergraduate research – in a complex world, it is increasingly thought that everyone needs to have some of the capabilities of a researcher, such as gathering data about a
problem in a systematic way. Research-led teaching refers to teaching that might encompass the latest research results, but could also imply students learning by themselves doing research. Even undergraduate curriculums could have a strong element of undertaking a small-scale research project. The implication is that for students, too, RDM issues become important. For example, if they are doing interviews they need to plan the secure storage of the outcome.
• New Public Management/neo-liberalisation – refers to the increasing application of private sector management strategies to universities. This implies greater talk about customer needs, increasing reliance on metrics of performance such as funding and citation counting. This perceived trend to the greater management pressures on academics is tied to a loss of status and even an identity crisis for the academic profession. It is important to consider this context, because RDM can itself be seen as ‘yet another’ form of such control. Maybe it is some -times. It can also be something very positive for researchers, too; how we position RDM therefore becomes critical to how it is perceived.
The organisation of research
The organisation of research: meta-disciplines, academic tribes and sub-fields.
It is common to talk about fundamental differences in culture between meta-disciplines, such as:
• pure science • life sciences • applied sciences • social science
• arts and humanities.
It is fairly common to think that the response to RDM is somewhat different in these different areas of research. Stereotypically the individualist humanities scholar rejects the very term data. Applied scientists already share data intensively. Of course, this is a simplification, but it may help to suggest some rather fundamental divergences across academic research.
But such a high-level categorisation neglects differences between, say, historians, linguists and philosophers. So going down one level it may be useful to look at individual subject fields or disciplines. Becher and Trowler’s (2001) notion that disciplines are global ‘academic tribes’ has been very influential in our understanding of research. In a sense, academics identify more with this tribe than with the institution that employs them. This is analogous to a professional’s loyalty to wider professional values, but is probably stronger than in many professions. It means that academics may be more alert to trends around RDM in their academic network than to anything the institution may wish to promote. The idea of the academic tribe draws attention to the way that scholars operate in unique and diverse social worlds, sharing a sense of:
• the scope of the field of study and where its boundaries lie • the subject’s history (and shared myths)
• a conception of what is a ‘contribution to knowledge’, i.e. what counts as new
• methodological commitments e.g. what are ‘normal’ ways of doing science, such as collecting and analysing data in certain types of ways certain institutions, such as key research centres
• key figures, such as seminal authors and rising stars
• formal communication channels: journals and conferences that are key to a field – academics tend to have a strong view of where it is best to publish
• social networks, with gatekeepers – the famous ‘invisible college’ • vocabularies and ways of talking, thinking and acting
• identity and personal commitment to this community.
THE SOCIAL WORLD OF RESEARCH 15
have no notion even of data. For the RDM professional based in an institution this is a key challenge, because the researcher’s strongest loyalties are invested in a world beyond the institution, where institutional action cannot easily reach. The challenge thus is to change a culture that has its roots elsewhere. Much of the literature on RDM, for example, reflects the variation of definitions of data and practices of sharing across disciplines (Borgman, 2015).
If anything this picture is actually too simplistic. The notion of a tribe implies a rather coherent sub-culture or community. In fact, scholars within one field may have little in common with others working in a different speciality. Some forms of sociology are very theoretical; some are based on secondary analysis of quantitative data. The feel of the subject is very different. Perhaps the most extreme example is geography, where some geographers are natural scientists studying landforms while others are essentially social theorists.
Furthermore, it is increasingly understood that ‘research tracks and specialties grow, split, join, adapt and die’ as Klein (1996, 55) puts it. If you work in a library, think about the way that the titles of journals change quite rapidly to reflect fashions in thinking. New journals emerge to reflect new disciplinary combinations. In a material form these changes reflect shifting currents in academic thinking. Various flavours of interdisciplin arity and multidisciplinarity reshape the research landscape continuously. This implies a less monolithic picture than implied by a focus on discipline or academic tribe. Perhaps the level of analysis should be one sub-field or speciality, since it is only at this level that a coherent value system still exists.
Exploring further
Do some web-based investigation of an area of research of interest to you. You might want to look at a specific department in the institution where you work or study. What meta-discipline does it fall under? Where does it fit into the map of academic disciplines? What specialities make it up? You will begin to see the complexity. Thus even along one corridor the range of specialities represented can be quite huge.
Narrowing down to a particular speciality, can you get a feel for the main journals and conferences and the key figures? What research methods are in use?
You might want to go on and start to explore research data practices as such: is there a subject repository for this area? Do people share data?
Understanding something of this is critical to RDM because the message is likely to be very different for different fields.
The research lifecycle
A common way of thinking about research is through the notion of the research process or perhaps lifecycle. In the very broadest terms research moves from a stage of ideation, to funding, to permission, to data collection, to data analysis and then to write-up and further dissemination. Quite commonly one project leads to another that develops the ideas further, and in that sense it could be seen as a renewing lifecycle.
Actual research processes are pretty different. If you look at a research methods book and compare qualitative, quantitative and mixed-method research, the designs are typically different. Qualitative research, in particular, is usually seen as defying simple description. It’s non-linear, iterative, variable.
The experience of research: research and identity
Research is a very particular type of work. For many researchers it is a personal passion. They think about it over many years, care deeply about the issues at stake and invest huge amounts of time and energy in it. It is certainly tightly linked to their own sense of identity. When we think about RDM we need to bear in mind this strong personal investment that many researchers make in their research.
One useful perspective for thinking about this a little more systematically is to refer to Brew’s work on the experience of research (Brew, 2001). Rather than focusing on differences by discipline, her findings pointed to four main types of experience of research across all disciplines.
1 The domino conception, in which research is seen as an ordered process in which different atomistic elements are synthesised.
Exploring further
Continue the work from the previous activity: start looking at a research methods book for a particular speciality. What are the range of methods in use? What kinds of data are being created?
2 The layer conception, which sees research as more of a process of uncovering layers to reach underlying meanings.
3 The trading conception, which sees research as about operating in a kind of ‘social marketplace’ and has a focus on products such as projects and publications.
4 The journey conception, which sees research very much as a personal, potentially transformational journey for the researcher.
If Brew is right there are some distinctly different ways of viewing research that may have a bearing on how we might introduce the idea of RDM.
The domino conception seems to be a rather process-orientated way of looking at research. We follow a set of procedures to produce a research outcome. RDM can fit this conception when we think about relating data management processes to the different steps in the research cycle. Actually, this is probably quite similar to how professional service staff might think of workflows that they want to link RDM to.
The trading conception seems to focus on products like publications or data. Again this can link to the RDM agenda through the value in the research ‘marketplace’ of objects like outputs and data. It should be easy to talk about RDM to people who think in terms of the trading conception, because they already think in terms of the value of certain objects.
The layer conception gives emphasis to the iterative nature of research in gradually uncovering layers of meaning. Perhaps the most interesting and challenging conception is that of the transformational journey. Here research is an immensely personal experience of discovery. It is a conception that reflects the profound uncertainty that challenging previous assumptions seems to imply. It is harder to see how RDM with its focus on processes and outputs can be aligned with this conception. Talking to researchers with this concept of research must respect the personal meaning they invest in ‘data’.
THE SOCIAL WORLD OF RESEARCH 17
Exploring further
Further reading
Christine Borgman (2015) is a key author for those wishing to have a deeper understanding of RDM. This book is a must-read for her overview of how different fields of scholarship view data and the issues around data. Borgman, C. L. (2015) Big Data, Little Data, No Data: Scholarship in the
networked world, MIT Press.
References
Becher, T. and Trowler, P. (2001) Academic Tribes and Territories: Intellectual enquiry and the culture of disciplines, McGraw-Hill Education (UK). Borgman, C. L. (2015) Big Data, Little Data, No Data: Scholarship in the
networked world, MIT Press.
Brew, A. (2001) Conceptions of Research: A phenomenographic study, Studies in Higher Education, 26(3), 271−85.
Klein, J. T. (1996) Crossing Boundaries: Knowledge, disciplinarities, and interdisciplinarities, University of Virginia Press.
We have already encouraged you to start having interesting conversations with researchers. This is important to build an understanding of their experience and so introduce RDM in a way sensitive to the sensibilities of researchers.
But it is also worth thinking about one’s own experience of research. While you may never have done cutting-edge, publishable research, you may well have research experiences which give you a sense of what doing research feels like. We have found that people commonly undervalue the experience they have themselves had, when it can be a resource for building empathy.
Write a few notes for yourself about previous experiences. They could refer to:
• writing an undergraduate or masters dissertation • research as part of developing a new process at work • continuing professional development work
• research to answer enquiries from service users.
CHAPTER 3
What are research data?
Aims
The aim of this chapter is to explore what research data are. It will help you start to have productive conversations with researchers about their data.
Research data are important to (some) researchers
For many researchers in the sciences and social sciences research data are of central importance to their work. Planning the collection of appropriate data is a key part of research design. The term ‘data creation’ may often be a more accurate term than ‘data collection’ or ‘data capture’, which imply that data are something existing before the researcher intervenes to actively construct them. But the language in use varies between fields of study and not all research projects actively create data. Creating data may take up many hours of work, and can be one of the most exciting parts of the research process, where the researcher gets into the laboratory or out into the field in the hope of finding something new. Then, processing the data and analysing them are central to creating new knowledge.
Skill and innovation in eliciting and then analysing data is central to one’s success as a researcher. The researcher’s deep relationship to data is strongly linked to their methodological commitments about how they believe science builds knowledge. A common understanding of methods is a central aspect of their subject discipline. Thus they have a strong investment in research data and a concern with their quality.
is a deep one. We have even heard researchers talk about their data as their ‘life’s work’. Material they are gathering is part of building a legacy. Imagine the researcher who has pursued their interests over multiple projects throughout a long research career. To them they have an intimate connec -tion to the various datasets that they have accumulated and pored over for many hours. Often it can be this, as much as pragmatic concerns such as fear of being beaten to publication, that inhibits research data sharing.
Having said all this, for many researchers data are essentially a means to an end: they are the foundation for gaining understanding of a phenomenon and then for publishing one’s results. It is the understanding and the publications that matter more than the actual data.
Furthermore, some researchers would deny collecting ‘data’ at all. This might be because they see the term data as implying quantitative material such as survey data, when they deal with qualitative material such as interviews and observations. Or it may be that in their field one simply does not refer to evidence as ‘data’. Thus, historians typically differentiate primary sources (original documents such as archival material) and secondary sources (interpreting the phenomenon that is studied, usually published works). Their primary sources are their data. So do not always start the conversation by talking about ‘data’. If you do you run the risk of alienating humanities scholars.
Furthermore, some researchers genuinely don’t collect data, e.g. in a purely theoretical field such as philosophy, arguably there are no data.
Talking to a researcher about the data they collect and analyse is a key conversation to have if you are working in the RDM field. But one has to be careful to use the terminology that researchers in that particular field relate to.
Exploring further
Start reading some papers produced by the researchers in the institution you work for, if you work for one, or an institution where you are studying. What are the data sources they are using? For example, in a social science or science paper the methodology section should describe in a fair amount of detail what the data were and how they were handled and analysed. The paper should reflect a particular methodological position.
Types of research data
Institutional surveys for RDM (see Chapter 9) often ask questions about research data such as how much data individuals have in gigabytes and what sort of data it is, e.g. whether it is in Word files, images, spreadsheets and so on.
Even if it is important to them and even if they do have lots of data, one should probably not rely too much on researchers’ own estimates of the quantity of data they hold, or even the order of magnitude of data they have. Do you know how many megabytes of files you have on your work computer? Probably not; because there is no real need to know. When we ran an RDM survey at Sheffield in 2014 around a quarter answered ‘don’t know’. Many more who did answer may simply have been guessing.
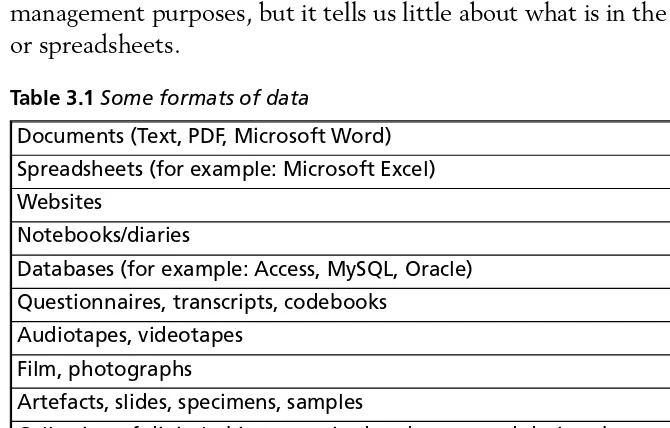
Defining data by format, as in Table 3.1, may be useful for data management purposes, but it tells us little about what is in the document or spreadsheets.
WHAT ARE RESEARCH DATA? 21
Talk to a researcher about their work. Make a conscious effort to listen out for the terms they use to describe the research process and to categorise data. It may well be hard to understand the exact meaning of some of the
measurements they make, if one does not have a related background. But one can begin to explore the issues that the researcher has about data quality.
Documents (Text, PDF, Microsoft Word) Spreadsheets (for example: Microsoft Excel) Websites
Notebooks/diaries
Databases (for example: Access, MySQL, Oracle) Questionnaires, transcripts, codebooks
Audiotapes, videotapes Film, photographs
Artefacts, slides, specimens, samples
Collection of digital objects acquired and generated during the process of research
Raw data files generated by software, sensors or instrument files Models, algorithms, scripts
Contents of an application (input, output, log files for analysis software, simulation software, schemas)
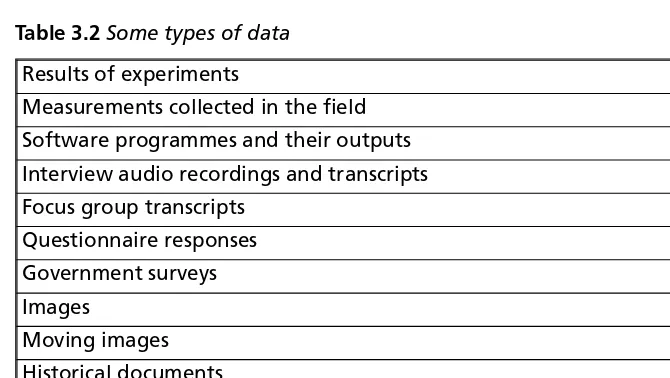
Table 3.2 gives us an immediate sense of the range of types of data. Virtually anything could be data. It could be non-digital: it could be a material object or a completed printed questionnaire. If it is digital, it could be vast and complex; or small. Categories such as ‘images’ disguise the huge range of visual material used in research, from works of art and historical photos to satellite imagery and medical photography. One project might produce multiple forms of data.
From an RDM point of view this proliferation of data types is central to the challenge. For example, we may need to run a repository that handles at least part of this range of types of material. Inevitably the descriptive standards and documentation of data are also widely variable across subjects, and so similar types of data might be described in rather different ways.
Some definitions of research data
Read these definitions carefully, and consider their strengths and weaknesses:
Factual records (numerical scores, textual records, images and sounds) used as primary sources for scientific research, and that are commonly accepted in the scientific community as necessary to validate research Results of experiments
Measurements collected in the field Software programmes and their outputs Interview audio recordings and transcripts Focus group transcripts
Questionnaire responses Government surveys Images
Moving images Historical documents Physical objects
Social media data: tweets
findings. A research dataset constitutes a systematic, partial representation of the subject being investigated. (OECD, 2007, 14)
Data are facts, observations or experiences on which an argument or theory is constructed or tested. Data may be numerical, descriptive, aural or visual. Data may be raw, abstracted or analysed, experimental or observational. Data include but are not limited to: laboratory notebooks; field notebooks; primary research data (including research data in hardcopy or in computer readable form); questionnaires; audiotapes; videotapes; models; photographs; films; test responses. Research collections may include slides; artefacts; specimens; samples. (University College London, 2013)
Qualitative or quantitative statements or numbers that are (or assumed to be) factual. Data may be raw or primary data (e.g. direct from measure -ment), or derivative of primary data, but are not yet the product of analysis or interpretation other than calculation. (Royal Society, 2012, 12)
Research data are defined as recorded factual material commonly retained by and accepted in the scientific community as necessary to validate research findings; although the majority of such data is created in digital format, all research data are included irrespective of the format in which it is created.
(EPSRC, n.d.)
The data, records, files or other evidence, irrespective of their content or form (e.g. in print, digital, physical or other forms), that comprise a research project’s observations, findings or outcomes, including primary materials and
analysed data. (Monash University, 2010)
Research data are the evidence that underpins the answer to the research question, and can be used to validate findings regardless of its form (e.g. print, digital, or physical). These might be quantitative information or qualitative statements collected by researchers in the course of their work by experimentation, observation, modelling, interview or other methods, or information derived from existing evidence. Data may be raw or primary (e.g. direct from measurement or collection) or derived from primary data for subsequent analysis or interpretation (e.g. cleaned up or as an extract from a larger dataset), or derived from existing sources where the rights may be held by others. Data may be defined as ‘relational’ or ‘functional’ components of
research, thus signalling that their identification and value lies in whether and how researchers use them as evidence for claims. They may include, for example, statistics, collections of digital images, sound recordings, transcripts of interviews, survey data and fieldwork observations with appropriate annotations, an interpretation, an artwork, archives, found objects, published texts or a manuscript. The primary purpose of research data is to provide the information necessary to support or validate a research project’s observations, findings or outputs. (Concordat on Open Research Data, 2016)
The output from any systematic investigation involving a process of observation, experiment or the testing of a hypothesis, which when
assembled in context and interpreted expertly will produce new knowledge. (Pryor, 2012, 3)
Anything you perform analysis on. (Briney, 2015, 6)
There are many definitions of data. In policy documents it may be useful to try and define research data in a fairly formal way, but some definitions seem to work much better for certain disciplines or meta-disciplines than others. For example, the Royal Society and EPSRC definitions apply more for science subjects. The UCL definition is useful for making it clear to all sorts of researchers that that ‘stuff ’ they are creating is indeed data. It is more of a definition through listing examples than by focusing on what ‘data’ is conceptually. Briney’s (2015) definition has the value of being simple and direct. The Monash definition perhaps confounds data and the findings based on that data. Pryor’s definition focuses on the systematic process and the purpose, creating new knowledge, though the range of methods feels a little narrow. The most comprehensive definition is from the Concordat. The start of the Concordat definition focuses on purpose. The purpose of research data is to provide an answer to research questions. The Concordat also usefully differentiates various states of data e.g. raw, primary, derived data.
Exploring further
Data collections
Individual scholars or projects may produce data collections: coherent bodies of data that others might want to re-use.
Thinking about collections of research data might be a rather ‘library’ way of looking at data, as if it’s a coherent body of material with clearly defined scope. This might not be quite how a researcher would see their ‘stuff ’. They are probably more likely not to have really thought of it as a coherent body of material, just something they use and that grew organically. Nevertheless it can be a useful perspective for thinking systematically about the scope and content of a body of research data.
Carlson has advocated a structured interview for capturing a profile of a research dataset (http://datacurationprofiles.org). The data curation profile technique constitutes a rather comprehensive and systematic approach to finding out all about the data produced in a project or series of projects. The structure is itself a very useful way of thinking about the different aspects of data, even if it is actually something smaller or less tidy than a ‘collection’. Some of the headings include:
• overview of the research, including the topic and funding source • data kinds and stages – in the form of a narrative about the data
collection, and including a data table itemising data collected by size, format and number of objects
• intellectual property rights relating to the data
• organisation and description of the data – including metadata standards in use
• target repository
• sharing and access – who can use the data and on what basis, including any desire for an embargo
• discovery – including target audiences
• tools – tools used in the research that others may need to use to re-use the data
• measures of impact – what usage measures would be appropriate to this material
• data management – practical issues, including back-up and security • preservation – which material should be preserved and for how long.
If you are thinking of talking to a researcher about their data this approach gives you a systematic way of thinking.
Data lifecycles
As well as data being created within the research lifecycle, data could be considered to have their own lifecycle. Data tend to go through a process of creation, cleaning, combination, storage, analysis, and possibly then preservation, sharing and re-use.
The metaphor of a lifecycle, be that of life to death or life to rebirth, has a strong resonance in the world of RDM. It has always been central to archival and preservation work. For example, the UK Data Archive (www.ukdataservice.ac.uk/manage-data/lifecycle) proposes a simple model with six stages:
• Creating data – this stage involves such activities as planning data collection, locating existing data sources and the actual data collection tasks, including documenting the data. In research involving human subjects it is highly likely to include the important ethics clearance stage.
• Processing data – validating and cleaning data, prior to the serious business of analysis.
• Analysing data – this the stage at which data are analysed and includes publication.
• Preserving data – this is about getting them into the right format for preservation and documenting them.
• Giving access to data – this includes making data discoverable, setting up conditions of re-use and promoting such re-use.
• Re-using data – including follow-up research and others re-analysing the data.
These are more like logical steps than the ones we might observe in any actual project. By definition such lifecycles are a simplification of real life,
Exploring further
Read some of the data curation profiles http://datacurationprofiles.org/. Try and relate the proposed structure and some of your early
conversations with researchers. Some questions may not feel relevant to a particular area of research. Work on a set of questions you feel comfortable asking a researcher.
WHAT ARE RESEARCH DATA? 27
which is far less linear and more iterative in practice. Some commentators talk about research workflows rather than lifecycles: but this may make the complex and contingent patterns of research sound a bit too much like a defined administrative flow of work. Having said that, looking for temporal patterns is likely to be rewarding. Also, this is a data perspective on research. Most researchers would be more preoccupied with gaining grants, outputs and publication, than the life of the data. Again, this realisation needs to be borne in mind when trying to use the model.
Another rather famous representation of research data is the DCC curation model. Again, this is more like the data curator’s vision of the lifecycle of data, than something a researcher would relate to strongly.
Research data is complex
There have already been some hints that research data is not simple; this section further explores the complexity of research data.
Commentators often refer to the five Vs of big data:
1 Volume 2 Variety 3 Velocity 4 Veracity 5 Value.
Exploring further
If you can, ask a researcher about the detailed steps in their research process. This will help you get to grips with the life of data. You might want to take the approach used by Mattern et al. (2015), who asked researchers to produce a hand-drawn diagram of the research process, and then asked them to add to the picture notes about actions relating to data. It might be best to focus on a particular research project, because there may be
differences across different projects. Capturing more about the flow of the research process can help you map out where support is needed or can be offered within the research process. Comparing diagrams produced by researchers in the same field will give you a fascinating insight into the commonality and variation within a single research area.
These aspects can serve as headings for thinking about research data, too. We have already discussed that researchers may not have a precise idea of the volume of data they have collected. Much of the early discussion of RDM was linked to the concept of a ‘data deluge’, vast quantities of data being created in big science and challenging to store and document for re-use. Researchers working in astronomy, for example, might well be involved in work generating truly vast quantities of data. Not all research does have great volume, though. The title of Christine Borgman’s (2015) bookBig Data, Little Data, No Dataneatly captures the fact that not all research data has huge ‘volume’. But just because the amounts concerned are not vast does not mean that they are easy to manage.
We have also already discussed the varietyof data. This applies within individual projects as well as between disciplines. In their study of data in the life sciences, Williams and Pryor (2009) mapped researchers using a complex array of data sources and different tools. A single study may draw in multiple forms of data that have to be managed collectively. Some are actively created for the project, other data are background or reference data that does not necessarily get cited. Each sub-field they studied was very different.
By velocity, commentators on big data are referring to the continuously updated streams of data that might be produced by such sources as sensors or internet traffic. Of course, this very same material could well become research data. Not all researchers will be trying to handle such dynamic data, but it is useful to think about most research data as dynamic. Data should not be seen as a thing, like a specific spreadsheet. Data are multiple and changeable. Thus, a researcher might gather some measurements in the field. Then they would enter this raw data into a spreadsheet back in the office. After some quality checking there might be a new version (derived data). Manipulating the data might lead to new versions. Combining this with other data would produce further versions. Tangible examples of such processes are described in the next chapter. But the key conclusion is that data changes. This lies behind Borgman’s (2015) question: ‘When is data?’ Something plays a role of being data at a particular moment.
for coding. Later one might tidy up an anonymised version of the interview transcript for sharing. Thus there are likely to be multiple versions of each interview, not necessarily a single definitive one. This creates data management (such as file naming) issues.
Such patterns of change are suggested by the lifecycle model. Yet processes of creation may be far more contingent, iterative and non-linear than a lifecycle model implies. Research is often akin to a craft skill. It is often not based on formulaic following of a closely defined recipe.
Data are also mobile across contexts. Some of the fascinating research on data journeys explores how data change meaning across different domains (Bates, Lin and Goodale, 2016). For example, weather station measurements (temperature, rainfall, etc.) are created by local, often volunteer, work in the spirit of creating open data. Combined with other similar weather measurements a weather dataset becomes a valuable commercialised source for the weather forecasters. It may also turn up as a valuable asset in the futures market on the stock exchange. Thus the meaning and value attached to data can alter as it moves between contexts. Veracityis about the reliability of data. For the researcher the reliability of their data, data quality, is always a key issue. This could be about calibrating instruments or checking for outliers in a dataset. For a linguist it could be about precisely transcribing pauses in the transcription of a conversation. So what defines quality will be different, but it will always be a concern for researchers.
Again, research data vary in terms of their value. Some data are irreplaceable. They’re the measurement of a unique event. They cannot be recreated. In other cases the cost would prohibit collecting them again. On the other hand, data produced from a computer model or simulation (e.g. in engineering or economics) can easily be reproduced. It is the model that needs to be preserved.
It is also worth reminding ourselves that digital data are fragile. They lose meaning out of the context of their collection if not documented. A spreadsheet without a key to the headings is more or less useless. The archival concept of provenance captures the importance of knowing about how an information object was created. A researcher wanting to re-use data will want to understand critical features of how the data were generated to be sure they can use them with confidence. What those critical features are, however, may vary.
Information management and RDM
These complex aspects of research data help us start to grasp the importance of the information management aspects of RDM.
• Sometimes the researcher is battling to find storage for the sheer volume of ‘active’ data they are working on right now. They may also be forced to make choices about which data are preserved, because they have so much.
• Researchers need to manage different types of data in a coherent way over the lifetime of the project.
• Researchers are having to manage a flow of data sources which are themselves changing and malleable. When we talk about data re-use we are thinking about a complex contextual transition that is challenging to manage.
• Data quality is key to the reliability of the outcome of the research, and so its credibility. But what is critical to quality will vary.
• Data has central value to much (though not all) research. Empirical research turns on the interpretation of data. It takes up the
researcher’s time to produce. It may also literally cost money to license or have potential monetary value.
Research does have a strong information management component.
Further reading
Carol Tenopir’s series of studies about scientists’ views on research data are a key reference point for the field.
Exploring further
Read the RIN report on life sciences (Williams and Pryor, 2009).
Continue to talk to researchers about their work. Try and understand more about the whole process of data creation and analysis – in the wider context of the research lifecycle. A visual analysis like the ones in the RIN report could be useful in mapping out how data is assembled and used. You might also think in terms of drawing up your own lifecycle model to capture the dynamic changes in the research life course.
Williams, R. and Pryor, G. (2009) Patterns of Information Use and Exchange: Casestudies of researchers in the life sciences, Report by the Research Information Network and the British Library,
Tenopir, C., Allard, S., Douglass, K., Aydinoglu, A. U., Wu, L., Read, E., Manoff, M. and Frame, M. (2011) Data Sharing by Scientists: Practices and perceptions, PLOS ONE, 6(6),
https://doi.org/10.1371/journal.pone.0021101.
Tenopir, C., Dalton, E. D., Allard, S., Frame, M., Pjesivac, I., Birch, B., Pollock, D. and Dorsett, K. (2015) Changes in Data Sharing and Data Re-use Practices and Perceptions Among Scientists Worldwide, PLOS ONE,10(8), https://doi.org/10.1371/journal.pone.0134826.
If you want to read more look for the latest years’ citations of these works.
At a more conceptual level Shankar’s (2007) paper describes the element of judgement and convention that go into turning scientific work into something labelled data. Recognising the element of judgement and choice in this process helps us understand the way that any data is a construction in a particular context, rather than an objective object.
Shankar, K. (2007) Order from Chaos: The poetics and pragmatics of scientific recordkeeping,Journal of the Association for Information Science and Technology,58(10), 1457–66.
References
Bates, J., Lin, Y.-W. and Goodale, P. (2016) Data Journeys: Capturing the socio-material constitution of data objects and flows, Big Data & Society, 3(2), http://doi.org/10.1177/2053951716654502.
Borgman, C. L. (2015) Big Data, Little Data, No Data: Scholarship in the networked world, MIT Press.
Briney, K. (2015)Data Management for Researchers: Organize, maintain and share your data for research success, Pelagic Publishing.
Concordat on Open Research Data(2016)
www.rcuk.ac.uk/documents/documents/concordatonopenresearchdata-pdf. EPSRC (n.d.) EPSRC Policy Framework on Research Data: Scope and
benefits, www.epsrc.ac.uk/about/standards/researchdata/scope/. Mattern, E., Jeng, W., He, D., Lyon, L. and Brenner, A. (2015) Using
Participatory Design and Visual Narrative Inquiry to Investigate
Researchers’ Data Challenges and Recommendations for Library Research Data Services, Program, 49(4), 408–23,
http://doi.org/10.1108/PROG-01-2015-0012. Monash University (2010) Research Data Policy,
management-policy.html.
OECD (2007) OECD Principles and Guidelines for Access to Research Data from Public Funding, www.oecd.org/sti/sci-tech/oecdprinciplesand guidelinesforaccesstoresearchdatafrompublicfunding.htm.
Pryor, G. (ed.) (2012) Managing Research Data, Facet Publishing. Royal Society (2012) Science as an Open Enterprise,
https://royalsociety.org/topics-policy/projects/science-public-enterprise/report.
University College London (2013) UCL Research Data Policy, www.ucl.ac.uk/isd/services/research-it/documents/
uclresearchdatapolicy.pdf.
Williams, R. and Pryor, G. (2009) Patterns of Information Use and Exchange: Case studies of researchers in the life sciences, Report by the Research Information Network and the British Library,
CHAPTER 4
Case study of RDM in an environmental
engineering science project
Aims
The aim of the chapter is to give you a deeper insight into the nature of the issues around RDM by exploring a particular case study in some depth.
The project
In this chapter we will look at a case study of a particular research project. The focus is on the different types of data that are collected, created and reused. We will also use it to consider the challenges that the complexity of the research project present to the management of active data and their long-term preservation. The chapter gives you direct access to a researcher speaking about their work in their own words.
This case study consists of an interview with Steve Banwart, Professor of Environmental Engineering Science at the University of Sheffield. He is the leader of a large-scale project that is funded by the European Union. The project looks at how soil – one of our planet’s essential natural resources – is produced and how it degrades. The aim is to quantify the impacts of environmental change on key functions of the soil and capture this in predictive models that can be used in decision making.
The project is international in scope. Soil Transformations in European Catchments(SoilTrec) brings together a network of over 30 research field sites. Professor Banwart explains that ‘it has 16 different institutions, as partners located in 3 different continents.’ The partner institutions are primarily in Europe, but also in the USA and in China.
surprising that the researchers working on the project handle a wide variety of data, sometimes in large quantities. This project handles data that are generated principally through observations and experiments in the field, ‘digging holes in the ground and studying dirt, if you will’, as well as laboratory experimentation. Data are also generated through computer modelling. And, Professor Banwart adds, ‘we also use existing remote earth observation data, primarily satellite data and geographical information systems held by government agencies like the European Soil Bureau.’
The research method
So the research method is to study a property of soil called soil structure. And soil is made up of primary particles of small fragments of minerals from the parent rock that soil forms from, dead organic matter which is decaying (so you might think of plant remains which have been deposited on the soil, at the beginning of winter, and these are broken down by soil organisms) and then also living organisms in the soil (principally bacteria and fungi but also worms and so on). These constituents of soil, in fertile soil they tend to bind up together and form larger aggregates. So these principal fragments are quite small, they can be a thousandth of a millimetre in size. But in productive soils we find out that these particles stick together and it’s not clear why these larger aggregates coincide with more productive, more fertile soils. So the first research challenge that we tackle is to understand how aggregate formation occurs and why it, for example, supports better nitrogen supply to plants, better phosphorus supply to plants, better potassium supply to plants, all important nutrients. It’s to understand that and to be more quantitative in our understanding of that.