Individual Transferable
Quotas in Iceland
BIRGIR RUNOLFSSON and RAGNAR ARNASON
Around the world in recent years, there has been a clear move-ment towards fisheries managemove-ment based on property rights. This trend mirrors the earlier development of the organization of economic activity on land. The spread of fisheries manage-ment based on individual transferable quotas (ITQs) is another stage in the historical expansion of property rights as a method of economic organization. Economic history informs us that the extension of rights to private property has generally been moti-vated by the desire to increase economic efficiency (North 1981), and private property is generally believed to be funda-mental to the current high level of economic productivity on land (Hayek 1976; Buchanan 1975). As with property rights on land, the ITQ system may be expected to yield substantial eco-nomic benefits.1
Iceland and New Zealand are the front-runners in this devel-opment. These countries were the first to introduce individual quotas (IQs) and individual transferable quotas (ITQs) in major ocean fisheries. In Iceland, IQs were introduced in the herring fishery in 1975. In 1979, these quotas were made transferable, cre-ating a fully fledged ITQ system in that fishery. IQs and subse-quently ITQs were introduced to other Icelandic fisheries during the 1980s. In New Zealand, ITQs were introduced in 1982 and seem, generally speaking, to have been successful (Arnason 1992a, 1996b).
The purpose of this paper is to look at the ITQ system as it de-veloped in the Icelandic fisheries. IQs and subsequently ITQs were introduced into other Icelandic fisheries during the 1980s. Since 1991, all major fisheries within the Iceland’s economic ex-clusive zone (EEZ) have been subject to a uniform system of ITQs with only minor exceptions. This chapter will describe the cur-rent structure of the system and evaluate its performance.
The Icelandic fisheries
The Icelandic economy is heavily dependent on the fisheries. Ex-ports of fish products account for around 80 percent of the com-modity exports in Iceland and 50 percent of the foreign exchange earnings. The fishing industry’s direct contribution to GDP is about 17 percent, but total contribution (direct and indirect) is es-timated to be as high as 45 percent of GDP. In other words, with-out the fisheries Iceland’s GDP would be only abwith-out 60 percent of the current GDP (Arnason 1995a: 85–86). The fishing indus-try’s size relative to the whole economy means that any fisheries’ policy has far-reaching implications. The fishing industry is a ma-jor determinant of personal incomes and income distribution and, in many parts of Iceland, the fishing industry is virtually the only basis for economic activity. Anything that affects the fishing industry, therefore, has a regional impact that often has very po-tent political repercussions. As a result, fisheries management is a major topic of public discussion and has great influence on the formulation of Iceland’s economic and regional policy.
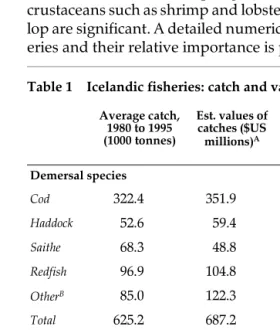
aeglefi-nus, Gadidae), redfish (Sebastes sp., Scorpaenidae: mostly S. marinus and S. mentella), and saithe (Pollachius virens, Ga-didae). Also important is the pelagic fishery, which harvests up-per-sea species. The pelagic fishery, based upon capelin (Mallotus villosus, Osmeridae) and herring (Clupea harengus, Clupeidae), yields up to 10 percent of the total catch value. In ad-dition to demersal and pelagic fisheries, fisheries harvesting crustaceans such as shrimp and lobster, and shellfish such as scal-lop are significant. A detailed numerical description of these fish-eries and their relative importance is provided in table 1.
Table 1 Icelandic fisheries: catch and value data
Average catch,
A At 1995 average unit catch prices and exchange rates. Estimated
Max-Cod 322.4 351.9 400.0 436.5
Haddock 52.6 59.4 60.0 67.7
Saithe 68.3 48.8 85.0 60.8
Redfish 96.9 104.8 120.0 129.8
OtherB
B Mainly Greenland halibut, catfish, plaice, tusk and ling.
85.0 122.3 85.0 122.3
Total 625.2 687.2 750.0 817.1
Pelagic species
Capelin 676.1 49.7 700.0 51.5
Herring 92.7 9.1 150.0 14.8
Total 768.8 58.8 850.0 66.3
Crustaceans
Shrimp 33.1 58.3 50.0 88.0
Lobster 2.3 8.8 2.5 9.6
Total 35.4 67.1 52.5 97.6
Shellfish
Scallop 12.0 6.0 10.0 5.0
The current fishing fleet measures about 129,000 gross regis-tered tonnes (GRT) and consists of several vessel types. It is con-venient to describe the fleet in the following four main categories.
Deep-sea trawlers
These are large fishing vessels between 200 and 1200 GRT and 130 and 250 feet (40–75 m) in length. They are engaged in the de-mersal fisheries employing bottom and, occasionally, mid-water trawl. Some also are used in the deep-sea shrimp fishery. Due to their size, the deep-sea trawlers have a wide operating range and are able to exploit practically any fishing ground off Iceland as well as those in international waters. Each trip in domestic fish-ing grounds usually lasts for from 5 to 15 days. A number of the deep-sea trawlers have recently been turned into freezer trawl-ers. The fishing trip of a typical freezer trawler is from 20 to 30 days; it may be longer if the ship goes into distant waters.
Specialized purse-seiners
These vessels—200 GRT and larger—are engaged primarily in the capelin fishery. Most also participate in other fisheries, particular-ly the deep-sea shrimp fishery and the herring fishery. The spe-cialized purse-seiners usually follow the capelin schools over great distances and land their catches where it is most convenient.
Multipurpose vessels
The multipurpose vessels cover a wide size range, from 12 GRT to over 200 GRT. The typical multipurpose vessel is smaller than those previously discussed, the average size being just over 100 GRT. The multipurpose fleet tends not to specialize with respect to fishing gear or fishery. Most of the multipurpose fleet is de-signed to gillnet or longline although they are technically capa-ble of employing trawl and purse-seine gear as well. The geographical range of the smaller multipurpose vessels is limited and they are normally confined to fishing trips of one to three days, exploiting grounds relatively close to their home port. The fishing trips of the larger vessels can last up to two weeks.
The part-time fleet
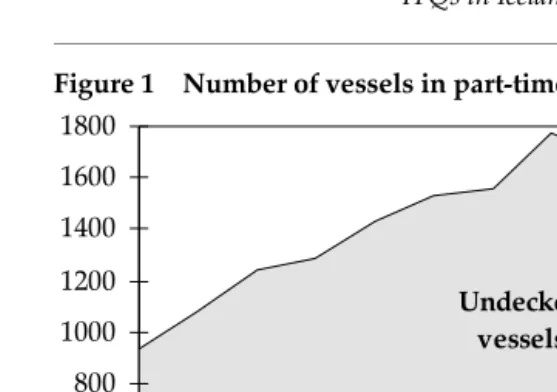
fleet employs handline, gillnet and longline gear. Depending on the gear and fishery, the size of the crew ranges from one to three people. The smaller of the part-time fleet—vessels under 10 GRT—were not subject to vessel-quota restrictions until 1991, so this component of the part-time fleet mushroomed in the preced-ing years (see figure 1). Vessels under 6 GRT are still allowed to opt for restricted catch days instead of quota restrictions.
Further details about the Icelandic fishing fleet are set out in ta-ble 2. As shown in that tata-ble, the average age of the fishing fleet is rather high. This is the effect of restrictive fishery-management measures and official efforts in recent years to halt new invest-ment in the fishing fleet.
The evolution of the fisheries management system
Until the extension of the fisheries jurisdiction to 200 miles in 1976, the Icelandic fisheries were international and common-property fisheries. Large foreign fishing fleets featured promi-nently on the fishing grounds, taking almost half of the demersal catch. The extension of fisheries jurisdiction to 200 miles all but eliminated foreign participation in the Icelandic fisheries. How-ever, the initial management measures taken in the demersal fisheries following the extension of the fisheries jurisdiction were
0-12 GRT Undecked vessels
0 200 400 600 800 1000 1200 1400 1600 1800
'84 '86 '88 '90 '92 '94 '96
Figure 1 Number of vessels in part-time fleet, 1983–1996
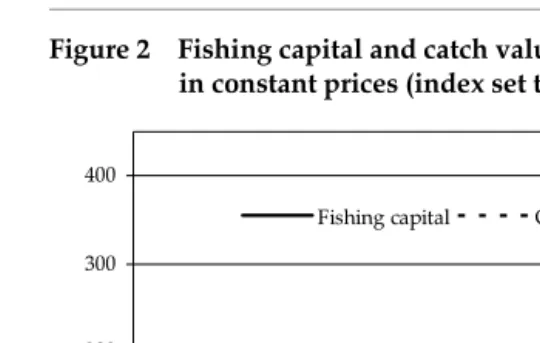
inadequate. These measures did not alter the common-property nature of these fisheries for domestic fishers, who were still forced to compete for shares in the catch. Not surprisingly, the development of the Icelandic fisheries after World War II closely followed the path predicted for common-property fisheries: in-vestment of capital and effort became increasingly excessive in comparison with the reproductive capacity of the fish stocks. The postwar development of fishing capital and catch values before the introduction of the demersal vessel-quota system in 1984 are illustrated in figure 2.
The value of fishing capital employed in the Icelandic fisheries increased by over 1200 percent from 1945–1983; during the same period, real catch values increased by only 300 percent. Thus, the growth in fishing capital exceeded the increase in catch values by a factor of more than four, and, in 1983, the output-to-capital ratio
Table 2 Icelandic fishing fleet (decked vessels, 1996)
Number Total tonnage
(1000 GRT) Average age (years) age age, 1984–96Change in
aver-Deep-sea trawlers
Standard 69 NA NA NA
Freezer 51 NA NA NA
Total 120 71.428 18.0 8.0
Specialized purse-seiners
Total 43 21.040 27.5 12.0
Multipurpose vessels
over 200 GRT 44 12.311 23.5 8.0
111–200 GRT 78 12.387 26.6 8.0
51–110 GRT 84 6.536 30.8 5.0
13–50 GRT 123 3.073 22.5 2.0
Total 339 34.307 25.5 5.0
Part-time fleet (0–12 GRT)
Total 326 2.495 12.4 –6
Grand total 818 129.270 19.2
in the Icelandic fisheries was less than one-third of the output-to-capital ratio in 1945 (see Arnason 1995a: 102–103).
This long-term decline in the economic performance of the Ice-landic fisheries did not go unnoticed by the authorities, and, over the years, various measures were taken to reverse this trend. Be-fore the extension of the exclusive zone to 200 miles in 1976, how-ever, effective management of the fisheries—especially demersal fisheries—appeared impracticable due to the presence of large foreign fleets on the fishing grounds.
With the de facto recognition of the exclusive 200-mile zone in 1976, the situation changed dramatically. The Icelandic fisheries gradually came under increased management until, after 1991, there was a uniform ITQ system in practically all fisheries. The chronology of this development is summarized in table 3. A more detailed review of the evolution of the ITQ fisheries manage-ment system in individual Icelandic fisheries follows.
The herring fishery
Due to an alarming decline in the herring stocks, an overall quota was imposed on this fishery in 1969. Since this did not halt the decline in the stocks, a complete herring moratorium was intro-duced in 1972. In 1975, when fishing from the Icelandic herring stocks was partly resumed, it was obvious that the whole fleet
0 100 200 300 400
1950 1960 1970 1980 1990
Fishing capital Catch value
Figure 2 Fishing capital and catch values, 1945–1994, both expressed in constant prices (index set to 100 = 1960).
could not participate. A system of individual vessel quotas with limited eligibility was introduced in 1975. Vessel quotas were small and issued on a year-to-year basis.2 In 1979, spokesmen for
the industry suggested fairly unrestricted transfers of quotas be-tween vessels, which the Ministry of Fisheries permitted.3 The
Fisheries Management Act of 1990 made the vessel-quota system in the herring fishery part of the general ITQ system.
The capelin fishery
The capelin fishery, which became big in the 1970s, was subjected to limited entry and individual vessel quotas for licence holders in 1980, when the stock was seriously threatened with overfish-ing. The arguments for introducing vessel quotas were the same as those in the herring fishery.4 The positive experience with the
vessel-quota system in the herring fishery proved a convincing argument for adopting a similar system in the much more impor-tant capelin fishery. In 1986, in conjunction with an increasing transferability of demersal vessel quotas, capelin vessel quotas became partly transferable. The capelin vessel quota system
Table 3 Chronology of the key steps in the evolution of the ITQ management system
1975 The herring fishery: individual vessel quotas
1979 The herring fishery: vessel quotas made transferable
1980 The capelin industry: individual vessel quotas
1984 The demersal fisheries Individual transferable vessel quotas
1985 The demersal fisheries: effort quotas option introduced
1986 The capelin fishery: vessel quotas made transferable
1988 Transferable vessel quotas in all fisheries; effort quota option retained
1991 A complete uniform system of transferable quotas in all fisheries
2 The quotas were not permanent, but determined annually by dividing the TAC by the total number of eligible vessels applying to participate in the fishery. 3 It had been observed that there were various methods for bypassing the
non-transferability of the IQs (Arnason 1996).
became a part of the general ITQ system with the adoption of the Fisheries Management Act of 1990.
The demersal fisheries
With the extension of Iceland’s exclusive fishing zone to 200 miles in 1976, the major demersal fisheries were subject to overall catch quotas. The quotas recommended by the marine biologists soon proved quite restrictive, and difficult to uphold. As a result, indi-vidual effort restrictions, taking the form of limited fishing days for each vessel, were introduced in 1977. As new entry remained possible, however, and the demersal fleet continued to grow, the allowable fishing days had to be reduced each year.5 It gradually
became obvious that this system was economically wasteful. In 1984, following a sharp drop in the demersal stock and catch levels, a system of individual vessel quotas was introduced.6
Ini-tially, regulations to this effect were issued for one year only. Due to the favourable results of the system, it was extended, though, in order to ensure sufficient support for the system, an important provision was added. Vessels were allowed to opt for effort re-strictions instead of catch quotas. In 1988, the Icelandic parlia-ment enacted general vessel-quota legislation that applied to all Icelandic fisheries and was effective between 1988 and 1990.7
This legislation retained the effort-quota option but made it less attractive. In 1990, the Icelandic parliament passed comprehen-sive ITQ legislation, the Fisheries Management Act, which abol-ished the effort-quota option and closed other loopholes in the previous legislation, especially in regards to the operation of ves-sels under 10 GRT. Moreover, it extended the ITQ system indefi-nitely, albeit with a stipulation for a revision in 1992.8
5 In 1977, deep-sea trawlers were allowed to fish for cod 323 days a year. In 1981, they were allowed only 215 days a year.
6 On December 22, 1983, the parliament passed an amendment to the Fisheries Act of 1976 that gave the minister of Fisheries discretionary power to put a vessel-quota system in place. In the upper house of the parliament, the amend-ment received only the minimum majority necessary—11 of 20 MPs in support. At the annual meeting of the Fisheries Association of Iceland on December 2 and 3, after heated discussion, the members agreed to ask the Ministry of Fish-eries to experiment with IQs for the demersal fishFish-eries for one year in 1984. 7 The Fisheries Management Act of 1988 became law on January 8, 1988. 8 The Fisheries Management Act of 1990 was amended in 1992 and 1994. Both
The shrimp, lobster, and scallop fisheries
The inshore shrimp, lobster, and scallop fisheries are relatively re-cent additions to the Icelandic fisheries. These fisheries were de-veloped largely during the 1960s and 1970s and, from the outset, have been subject to extensive management, primarily limited lo-cal entry and overall quotas. An overall TAC for the lobster fishery was set in 1973, with restrictions on the size of vessels and, in 1988, licensing and vessel quotas. New legislation regulating the pro-cessing and fishing of inshore shrimp and scallops was passed in 1975. This legislation gave the Ministry of Fisheries authority to is-sue quotas for shrimp and scallop to the processors. There are 7 inshore shrimp areas, each having regulations specific to it; two areas already had IQs in 1974. Recently, there has been a strong movement towards vessel quotas in these fisheries, and, in 1988, the deep-sea shrimp fishery was subject to vessel quotas. The management of shrimp and scallop fisheries became part of the general ITQ system with the Fisheries Management Act of 1990.
Sumumary
As may be inferred from this description, the course towards a complete ITQ fisheries management system in Iceland evolved more through trial and error than by design. In most countries— and Iceland is no exception—there is strong social opposition to radical changes in the institutional framework of production and employment. A great deal of this opposition derives not from ra-tional arguments but rather from the desire to protect tradira-tional values and vested interests. From a sociopolitical point of view, Iceland probably had to pass through an evolutionary process during which various management methods were tried in differ-ent fisheries. The knowledge and understanding gained from these experiments were crucial for the eventual acceptance of a more efficient ITQ system.
This pattern reflects the reluctance of the fishing industry to accept changes in the traditional organization of the fisheries. Only when faced with a significant fall in income due to fish-stock reductions or a drop in the world market price for fish products have interest groups been willing to consider changes in the institutional framework of the fisheries.9
The passing of the comprehensive ITQ fisheries management legislation in 1990 constitutes a break in this pattern. For the first time, the fishing industry agreed to a significant improvement in the fisheries management system without being threatened with the alternative of a financial disaster. This must be attributed to the potentially immense economic benefits of the vessel-quota system, which were now becoming apparent to most of the par-ticipants in the fisheries.
The current ITQ fisheries management system
Although this system was instituted at different times and in dif-ferent forms in the various fisheries, it was made uniform by the Fisheries Management Act of 1990. The fisheries management system is based on individual transferable quotas and is appropri-ately referred to as an ITQ system. The essential features of the current ITQ system are as follows: all fisheries are subject to vessel catch quotas; the quotas represent shares in the total allowable catch (TAC); the quotas are permanent,10 perfectly divisible and,
with some restrictions, freely transferable; they are issued subject to a small annual charge to cover enforcement costs. The ITQ sys-tem is fairly uniform across fisheries, although slight differences between fisheries exist, mostly for historical reasons.
The ITQ system was superimposed on an earlier management system designed mainly for the protection of juvenile fish. This
9 That rule changes in the fisheries are always a response to a crisis, such as lower income for fishermen, fits nicely with Libecap (1989). One should bear in mind, though, that even if the adoption of an ITQ system is considered a radical rule change, it was not new to the Icelandic fisheries, as IQs already existed in the herring and capelin fisheries at this time. As early as 1981, the favourable experience of quotas in these fisheries had influenced many ves-sel owners that nothing short of an ITQ system was needed. Despite an in-creased catch of demersal species, the fishing industry was running at heavy losses in the period from 1981 to 1983.
system, involving certain restrictions on gear, area, and fish size, is still in place. The ITQ system has not replaced these compo-nents of the earlier fisheries management system.
Total allowable catch
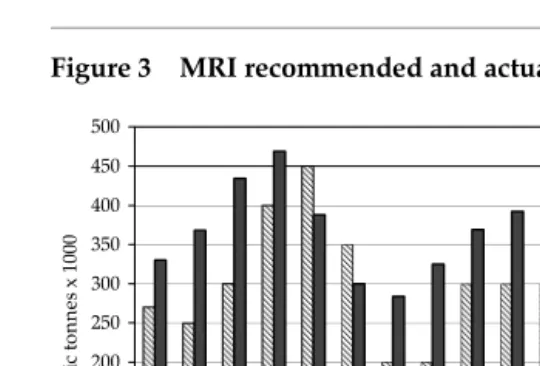
The Ministry of Fisheries determines the total allowable catch (TAC) for each of the most important species in the fisheries. This decision is made on the basis of recommendations from the Ma-rine Research Institute.11 Recently, the Ministry of Fisheries has
followed the recommendations of the Marine Research Institute quite closely, except in the cod fishery (see figure 3).12
Currently 13 species are subject to TACs and, as a consequence, to IQs.13 Several species that are not heavily fished are not
cur-rently subject to TAC and fishing of these species can be pursued freely. These fisheries are, in most cases, commercially negligible.
Permanent quota shares
Every eligible vessel is issued a permanent share in the TAC for each species for which there is a TAC. These permanent quota shares can be referred to as TAC shares.
Initial allocation of permanent quota shares
The initial allocation of TAC shares to individual vessels varies over fisheries. In the demersal, lobster, and deep-sea shrimp fish-eries, the TAC shares normally are based on the vessel’s historical catch-record during certain base years. In the demersal fisheries, this usually equals the vessel’s average share in the total catch
dur-11 The Marine Research Institute (MRI) has its own vessels to study the state of the fish stocks. In addition, the Institute relies on information from the fish-ers. For example, there is the annual trawler-rally and the gillnetters-rally, in which a number of trawler and gillnet vessels is contracted by the MRI to har-vest in particular areas at given dates and record all information (volume and composition of the catch, size and age of fish, etc.) about the catch. 12 The cod fishery plays a substantial role in the economy. Not surprisingly,
suc-cessive governments have been reluctant to curtail cod TACs in accordance with the recommendations of the MRI. Only in the 1990s has the Ministry fol-lowed this advice and stood firm on that decision despite political pressure, even from within the government. In addition to the government fisheries researchers, the vessel owners association employs its own researchers. 13 They include 8 demersal species: cod, haddock, saithe, redfish, Greenland
ing the three years prior to the introduction of the ITQ system in 1984. There are some noteworthy exceptions to this rule. If, for in-stance, the vessel in question was not operating normally during the period from 1981 to 1983 due to major repairs, or had entered the fleet after 1981, the calculated share was adjusted upwards. Al-so, during the years 1985 to 1987, it was possible to modify the TAC shares by temporarily opting for effort restrictions instead of vessel quotas and demonstrating high catches during this period.
In the herring and inshore shrimp fisheries, the initial TAC shares were equal for all eligible vessels.14 The same was true in
the capelin fishery except that a third of the TAC shares were ini-tially allocated on the basis of vessel hold capacity.
Annual vessel quotas
The size of each vessel’s annual quota in a specific fishery is a simple multiple of the TAC for that fishery and the vessel’s TAC share.15 While the TAC share is a percentage, annual quotas are
denominated in volume terms.
14 The management of inshore shrimp has moved from processor quotas to ves-sel quotas.
15 In some fisheries (e.g., capelin and inshore shrimp) the management periods are less than a year (seasonal). Nevertheless, the same rule applies.
0
1978 1979 1980 1981 1982 1983 1984 1985 1986 1987 1988 1989 1990 1991
1991/92 1992/93 1993/94 1994/95 1995/96
Fishing year Figure 3 MRI recommended and actual catch of codfish, 1978–1996
As the Icelandic demersal fisheries are a mixed-stock fishery and vessels are bound to catch other species, the ITQs (or TAC shares) also are denominated in cod-equivalent terms, i.e., because cod is the most important species in the Icelandic fisheries, it is used as the common denominator for the whole ITQ system.16 This
pro-vides some flexibility for the vessels as they can subtract by-catch of other species from their quota at fixed values (Arason 1995).
Transferability
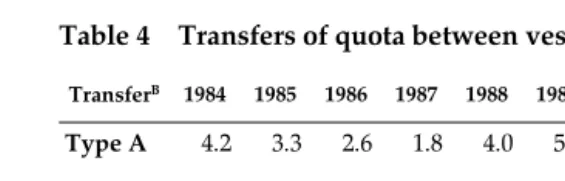
Both the TAC shares and the annual quotas are freely transfer-able and perfectly divisible. Any fraction of a given quota may be transferred to another vessel. TAC shares are transferable with-out any restrictions. Transfers of annual vessel quotas, on the oth-er hand, are subject to some restrictions. Annual vessel quotas are freely transferable between vessels within the same geo-graphical region. Transfers of annual quotas among geogeo-graphical regions are subject to revision by the respective fishers’ unions and the local authorities. Offsetting transfers of different species with equal value are not subject to such restrictions. The ratio-nale for this stipulation is that it will stabilize local employment in the short run. In practice, however, it appears that few interre-gional transfers are actually blocked (see table 4).
In 1992 and 1994, the parliament amended the Fisheries Man-agement Act of 1990, adding further restrictions. These restrictions, however, are relatively insignificant; they were designed to dis-courage speculative quota holdings and stabilize regional and fish-ers’ employment in the short run.17 Apart from this, transfers of
quotas are subject to registration with the Ministry of Fisheries. The particulars of the exchange, including price, are not registered.18
16 Cod equivalent values in 1995/96 are: Cod 1.00, haddock 1.10, saithe 0.55, red-fish 0.8, plaice 1.30, Greenland halibut 1.70, capelin 0.05, herring 0.08, lobster (tails) 8.40, shrimp 1.00 and scallops 0.40.
17 One amendment stipulates that if a fishing vessel did not harvest at least 25 percent of its annual quota for 2 years in a row, it would forfeit its TAC share. In another amendment, this harvesting requirement was doubled. It was also stipulated that no vessel could more than double its quota corresponding to its TAC share by temporary quota purchases. It may, however, acquire per-manent quota shares without limit. In a temporary amendment that expired at the end of 1995, no vessel could buy annual quotas if it had during the same year sold more than 15 percent of its quota, nor could it sell if it had pre-viously bought more than 15 percent of its annual quota.
Restricted access
In addition to the ITQ system, the Icelandic fisheries are subject to restricted access. All commercial fishing vessels must hold both a valid fishing licence and catch quota. Fishing licences are issued to vessels in the fishery since 1990 and replacements comparable to the original in fishing power. Fishing licences are transferable only with vessels.19 One of the impacts of a well designed ITQ
sys-tem is to provide the socially appropriate incentive for investment (or disinvestment) in the fishing fleet; the fishing-licence stipula-tion clearly adds a deterrent to investment in fishing vessels.
Exemptions from the ITQ system
There is one minor exemption from the current ITQ system. In the demersal fisheries, hook-and-line fishing by vessels under 6 GRT are allowed exemption from quota restrictions, but are subject,
19 One consequence of restricting access and licensing is that licences become valuable if they are transferable. As restricted access and licensing usually ac-companies an ITQ system, this “wealth effect” or “windfall” is often associat-ed incorrectly with ITQs. The “wealth” or “windfall” is the result of the licensing, not the ITQs.
Table 4 Transfers of quota between vessels, 1984–1993A
A Source: OECD (1994). Transfers are shown as a percentage of total
ground-fish catch. These groundground-fish quotas are measured in kilograms of cod equivalents and represent temporary annual quota transfers only.
TransferB
B Type A: transfers between vessels with the same owner; type B: transfers
between vessels with different owners operated from the same port; type C: offsetting transfers of different species with equal value between vessels with different owners; type D: transfers between vessels with different owners operated from different ports.
1984 1985 1986 1987 1988 1989 1990 1991C
C First eight months of 1991.
1991/92D
D September to August fisheries year.
1992/93
Type A 4.2 3.3 2.6 1.8 4.0 5.1 5.5 12.2 18.7 24.6
Type B 3.8 3.4 2.2 1.9 3.1 3.7 3.6 9.0 8.8 12.2
Type C 1.1 1.7 1.1 0.1 2.4 2.7 1.7 4.3 5.3 8.1
Type D 3.6 5.8 2.7 2.2 4.7 4.4 6.9 7.8 13.5 21.6
instead, to limited fishing days and an overall TAC. Although this arrangement was to end in 1994, the exemption was extended, though the number of fishing days was reduced. Under the 1996 amendment to the Act, these vessels must choose between a share quota and an effort quota. As a group, they continue to receive a common share of the general TAC.
Quota fees
The annual vessel quotas were initially issued by the Ministry of Fisheries free of charge. However, in accordance with the Fisher-ies Management Act of 1990, the Ministry now collects fees for catch quotas to cover the cost of monitoring and enforcing the ITQ regulations. The law imposes an upper bound on this fee amounting to 0.4 percent of the estimated catch value. The Min-istry estimates that it will collect US$6 million in quota fees in the 1996/97 fishing year. In addition, the vessel owners will pay an es-timated US$2 million in licence fees in 1996/97, and each vessel also has to pay harbour fees for docking at a port and fees for having the catch weighed, whether it uses a public weighing sta-tion or a private firm.
Deviations from an ideal ITQ system
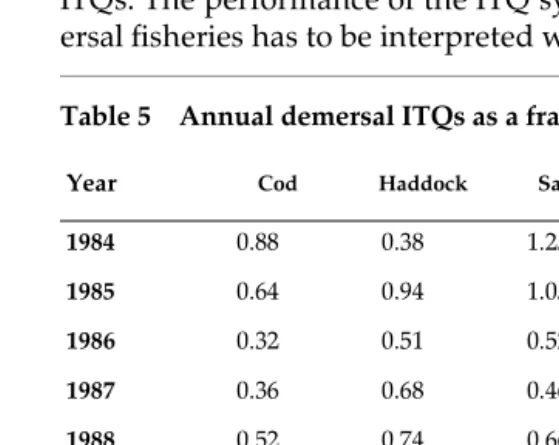
for limited effort rather than IQs. Further, the part-time fleet only became subject to ITQs in 1996, and a little less than half of those vessels can choose to be exempted from the system. Table 5 shows what fraction of the demersal catch has been subject to ITQs. The performance of the ITQ system in the Icelandic dem-ersal fisheries has to be interpreted with this in mind.
The performance of the ITQ system
The main purpose of the vessel-quota system is to improve the economic efficiency of the fisheries. The Icelandic fisheries are bi-ologically very productive and able to generate high economic rents. Until the adoption of the vessel-quota system, however, comparatively low rents were generated in the industry. During
Table 5 Annual demersal ITQs as a fraction of total catchA
A A ratio in excess of unity indicates that the total issued ITQs exceed the
ac-tual catch. Source: Ministry of Fisheries, Utvegur 1984–1994, Aegir 1995, Ar-nason 1996a.
Year Cod Haddock Saithe Redfish Greenland halibut
1984 0.88 0.38 1.25 1.09 1.00
1985 0.64 0.94 1.05 0.97 0.76
1986 0.32 0.51 0.52 0.37 0.29
1987 0.36 0.68 0.46 0.40 0.24
1988 0.52 0.74 0.66 0.43 0.33
1989 0.53 0.63 0.60 0.41 0.29
1990 0.49 0.58 0.54 0.39 0.46
1991B
B The fishing year under the Fisheries Management Act of 1990, that is 1
Jan-uary to 1 September. Subsequent fishing years from 1 September to 1 Sep-tember the following calendar year.
1.00 1.24 1.00 0.99 1.10
1991/92 0.94 1.09 0.90 1.02 0.85
1992/93 0.79 1.34 1.22 1.01 0.87
1993/94 0.73 1.14 1.28 0.97 1.06
1994/95 0.73 1.00 1.46 0.84 1.14
the years preceding the introduction of the vessel-quota system, losses in the various fisheries were often very great (see Arnason 1995a). Since, the ITQ system was introduced at different times and in different forms in the various fisheries, we shall discuss the impact of the system on each of these fisheries separately.
The herring fishery
The herring fishery resumed in 1975 after a three year fishing moratorium. A system of individual vessel quotas was imposed on the fishery, with eligibility for quota allocations limited to small vessels with a history of herring fishery participation. The larger purse-seiners were excluded on the grounds that they were capable of pursuing the North Sea herring fishery and the Icelandic capelin fishery. Due to the generally favourable experi-ence with this system, the quotas were made perfectly divisible and transferable in 1979. In 1990, the herring fisheries manage-ment system was incorporated, largely unchanged, in the com-prehensive fisheries management system for the Icelandic fisheries.
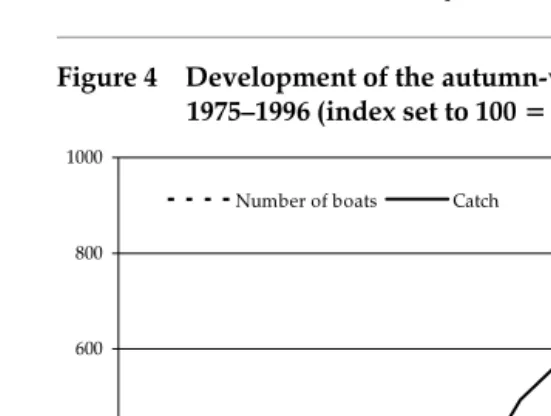
The ITQ system in the herring fishery has been very success-ful. Herring catches have increased almost tenfold since 1975, and fishing effort has declined substantially. The number of ves-sels in the fishery decreased from about 65 vesves-sels in 1975 to 30 to 40 in recent years.20 Technical efficiency in the herring fishery is
now roughly 10 times higher than it was at the outset of the ves-sel-quota system in the fishery 20 years ago (Arnason 1993). The development of the herring fishery in terms of number of vessels and catches is described in figure 4.
The capelin fishery
An individual vessel-quota system was introduced in the capelin fishery in 1980. In 1986, the quotas were made transferable. In 1990, the capelin management system was incorporated in the
overall Icelandic fisheries-management system.21 The capelin is a
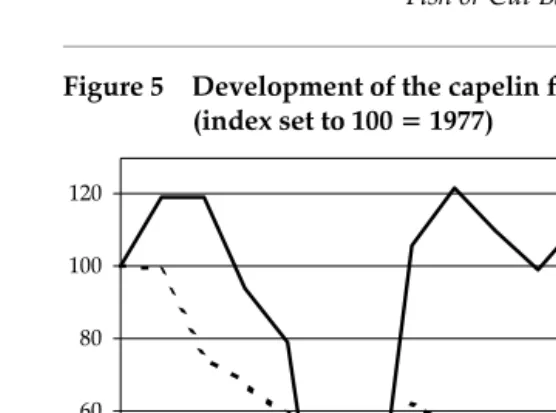
short-lived species and the fishery is very volatile. Since the intro-duction of the vessel-quota system in 1980 there has been no trend in catch levels, though mean catches have remained rough-ly unchanged. The capelin fleet, on the other hand, has been sub-stantially reduced: the number of vessels has declined from 68 in 1979 to 44 in 1996, or by more than 30 percent, and the number of vessels is expected to decrease further this year.22 The total
ton-21 Part of the capelin stock migrates seasonally into the jurisdiction of the Greenland and Norwegian fisheries. The capelin is therefore a shared stock, but, through an agreement with these two countries, Iceland determines the annual TAC to be shared between the three countries. Iceland’s share is 78 percent of the TAC and Norway and Greenland each receive 11 percent. In winter, the capelin is fished exclusively in Icelandic waters.
22 The number of vessels participating in the capelin fishery in 1993 was down to 39. In the Summer of 1994 the Norse herring fishery resumed and that seems to have induced some vessel owners to revert to purse-seine fishing. The TAC for the Norse herring in 1995 was 150,000 tonnes and 190,000 tonnes in 1996. The size of the capelin stock has been growing and the TAC increas-ing as a result. The capelin catch had averaged less than 680,000 tonnes since 1980 but the TAC for the 1996 fishing year was 1,175,000 tonnes.
0 200 400 600 800 1000
'76 '78 '80 '82 '84 '86 '88 '90 '92 '94 '96 Number of boats Catch
Figure 4 Development of the autumn-winter herring fishery, 1975–1996 (index set to 100 = 1975)
nage (GRT) of the fleet has been reduced by over 25 percent. Thus, there are strong indications that the efficiency of the capelin fishery has increased substantially since the introduction of the vessel-quota system. The development of the capelin fishery, in terms of vessel number and catches, is illustrated in figure 5.
The demersal fisheries
The demersal fisheries are by far the most important Icelandic fisheries, accounting for around 80 percent of the total wetfish value. These fisheries have been subject since 1984 to an individ-ual transferable quota system, which has been under continuous revision, even since the adoption of the comprehensive Fisheries Management Act of 1990.
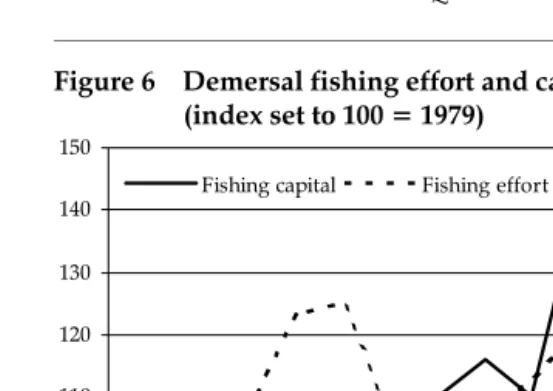
The trend in fishing capital and fishing effort
One of the reasons for the dissipation of economic rents in the Icelandic fisheries is overinvestment in fishing capital and exces-sive fishing effort. Therefore, one of the tests of the efficacy of the vessel-quota system is the development of fishing capital and ag-gregate fishing effort since the introduction of the system.
The trend in fishing capital and fishing effort in the demersal fisheries in recent years is illustrated in figure 6. The previous
0 20 40 60 80 100 120
'78 '80 '82 '84 '86 '88 '90 '92 '94 '96
Number of boats Catch
Source: Fisheries Association of Iceland.
growth in the value of aggregate harvesting capital halted abruptly in 1984 when the vessel-quota system was introduced. In fact, fishing capital contracted between 1984 and 1985. This was the first time since 1969 that the value of the fishing fleet de-creased. In the preceding 15 years, capital value had grown at an annual rate of over 6 percent. The vessel-quota system seems to have generated beneficial results, although the halt in invest-ment can not be attributed exclusively to the vessel-quota sys-tem. The years 1982, 1983, and 1984 were periods of heavy losses for the fishing industry. In 1986, investment in fishing capital re-sumed at a high rate. This resumption of investment should not, however, be interpreted as a failure of the vessel-quota system. The increase in the value of fishing capital since the inception of the ITQ system has amounted to just over two percent annually while, during the preceding 15 years, this annual increase was over 6 percent. Moreover, most of the investment since 1986 can be explained by factors extraneous to the ITQ system.
First, a good deal of the investment in fishing capital from 1986 onwards consisted of the installation of freezing equipment and the corresponding modifications of several deep-sea trawlers. In 1983, there were three freezer trawlers, in 1990, there were 28, and in 1996, there were 50. This part of the capital investment was for new, profitable, techniques for fish processing. Second, a part of
80 90 100 110 120 130 140 150
'80 '82 '84 '86 '88 '90 '92 '94
Fishing capital Fishing effort
Figure 6 Demersal fishing effort and capital, 1978–1995 (index set to 100 = 1979)
the investment was in specialized trawlers for the emerging and very valuable deep-sea prawn fishery that was not subject to ves-sel quotas until 1988. Third, by the mid 1980s a significant fraction of the deep-sea trawler fleet was due for replacement. Many firms took the opportunity to replace their ageing vessels in 1986 and 1987 as these years were unusually profitable for the harvesting sector. Fourth, during this period there was significant investment in small vessels (under 10 GRT) that were not subject to the vessel-quota system. Last, the effort-vessel-quota option in the demersal fisher-ies introduced in 1985 undermined the efficiency incentives of the ITQ system since it induced many vessel owners to upgrade or re-place their vessels. The effort-quota option was abolished in 1990 and there was a significant reduction in fishing capital in that year and the following years.
The course of the demersal fishing effort tells a similar story. As indicated in figure 6, fishing effort in the demersal fisheries dropped by 15 percent in 1984, the first year of the vessel-quota system, and by an additional 6 percent in 1985. From 1986 to 1990, on the other hand, fishing effort increased considerably. This is due to the widespread selection of the effort-quota option within the ITQ system. Another important explanation for the increase in fishing effort in 1989 and 1990 was the decline in the demersal fish stocks without a commensurate reduction in the TACs. Thus, more fishing effort was required to fill the catch quotas. From 1991 onwards, demersal fishing effort declined substantially.23
The important question, however, may not be whether fishing effort has been reduced from its 1983 level. A more crucial mea-sure of the impact of the vessel-quota system is the difference be-tween the actual fishing effort from 1984 onwards compared to the fishing effort level that would have prevailed had the vessel-quota system not been introduced. Although, it is by no means straightforward to predict the course of fishing effort under the earlier management regime, attempts have been made to do so. Using a simple trend model, one can produce some interesting results (Arnason 1993: 213–14; 1995a: 125–27; see figure 7). We es-timate that the vessel-quota system reduced total demersal fish-ing effort from 1984 to 1990 by over 30 percent compared to the
expected fishing effort under the previous management sys-tem.24 The financial benefits of this kind of a reduction in effort
are substantial. When interpreting these results, however, one should be mindful of the extreme simplicity and mechanistic na-ture of Arnason’s underlying model. In fact, Arnason claims these results should be regarded as indicative only.
More direct estimates of economic benefits
Unfortunately, little research has been done in this area and the available information is thus rather scant. From a theoretical point of view, the economic benefits of a vessel-quota system should in-clude the following items:
(1) A Reduction in Fishing Effort Under the vessel-quota system, competition between vessels for a limited stock of fish is eliminat-ed. Consequently, fishing firms will attempt to catch their vessel quota with a minimum of fishing effort. It is important to realize, however, that aggregate fishing effort will not be reduced if the TAC is excessive relative to the size of the fish stocks.
24 Arnason (1995a: 126–27) tests the hypothesis that there is no structural break in the evolution of fishing effort between the two management regimes. The hypothesis is soundly rejected.
80 100 120 140 160 180 200
'78 '80 '82 '84 '86 '88 '90
Actual fishing effort Predicted fishing effort
Figure 7 Predicted fishing effort assuming no vessel-quota system com-pared with actual fishing effort, 1978-1990 (index 1979 = 100)
(2) Reduced Cost of Fishing Effort Having secured property rights to a certain volume of catch under the vessel-quota system, fish-ing firms can concentrate on takfish-ing that catch with minimal costs.
(3) Improved Quality of the Catch Being bound by vessel-catch quotas, fishing firms can only increase revenues by improving the quality of this catch.25
Enforcement of fisheries management regulations
Monitoring and enforcement is necessary to counter any tenden-cy to “high-grade,” i.e., discard inferior catch, and exceed as-signed quotas. Violations of fisheries regulations are subject to fines, expropriation of catch and gear, and cancellation of fishing licences, depending on the seriousness of the violation. The Min-istry of Fisheries and its agencies have discretionary power to as-sess these penalties and a proven willingness to use them. Alleged violators have recourse through the court system in cas-es where they do not accept the Ministry’s penalticas-es.
To apprehend those who catch more than their quota of fish, Iceland uses an effective landings-control system. By law, all ma-rine catch must be weighed on officially approved scales at the point of landing, and public officials record the landings and ver-ify the species composition of each catch. The landings-control system covers all 67 landing ports in Iceland, as well as the major foreign export ports.
The Coast Guard has an important role in monitoring and en-forcing domestic fisheries regulations, and the Ministry main-tains a group of observers to monitor adherence to quota rules and other fisheries regulations. Some observers are stationed aboard fishing vessels during fishing trips, while others travel be-tween the landings ports. Despite elaborate monitoring and en-forcement, there are some violations of the various regulations; all together, though, they are negligible.
Weaknesses in the fisheries management system
There are certain weaknesses in the current fisheries-manage-ment system, especially from the point of view of economic effi-ciency. The most serious ones appear to be the following.
High-grading
High-grading (i.e., discarding less valuable catch) is a problem of-ten attributed to ITQ systems, especially in mixed fisheries. The Icelandic demersal fisheries are certainly mixed fisheries but there is little evidence of increased discarding under the ITQ system. According to measurements published in a 1993 report by a gov-ernment commission, demersal discards range from 1 to 6 percent of total catch volume depending on gear and vessel type. Accord-ing to this report, there has not been any detectable increase in discards since the introduction of the vessel-quota system in 1984.
Loopholes
Although the comprehensive Fisheries Management Act of 1990 closed many of the loopholes of the previous ITQ system(s), one worrisome loophole remains. Fishing vessels under 6 GRT in size were offered the option of remaining outside the ITQ system provided they restricted their operations to hook-and-line fish-ing for demersal species. This exemption, usually referred to as the hook licence, was to expire in 1994, but the Act was amended in 1996 so that this group of vessels now receives a common share of the TAC; these vessels receive a 13.9 percent share of the TAC for cod. Of the 1,009 vessels in this group, 533 chose IQs.
This exemption has resulted in a distortion in the composition of the fishing fleet and the amount of effort in the fishery. The fleet of small boats has increased its share in the demersal catch. The hook-licence fleet has expanded its share in the catch of cod from less than 3 percent in 1989 to over 20 percent in 1995 (see fig-ure 8). After the introduction of the ITQ system in the demersal fisheries in 1984, the number of small hook-licence vessels mush-roomed, almost doubling in numbers between 1983 and 1990. Further, investment in small vessels has accounted for almost 15 percent of total investment in the fishing fleet since 1984.26
Simi-larly, since the introduction of the ITQ system in the demersal
fisheries in 1984, the longline fleet has expanded its share in the cod catch from about 9 percent to just over 20 percent. There also has been substantial investment in this fleet.
Quota holdings
Quota holdings are limited to owners of fishing vessels. This re-striction obviously reduces the number of potential quota-market participants and severely limits the scope for quota arbitrage in the market. The efficiency of the market is impaired and its effective-ness in allocating quotas to the most efficient operators reduced.
Imprecision in stock management
The current ITQ system allows quota holders to postpone the harvesting of up to 20 percent of the annual quota allotment until the following year. It also allows quota holders to exceed their quota allotment by up to 5 percent in any year subject to a corre-sponding quota reduction in the following year. These provi-sions provide some operational flexibility to vessel owners but, since they allow actual catches in a given year to deviate as much as 25 percent from the TAC, they also admit excessive imprecision in the biological management of the stocks.
0
'89 '90 '91/'92 '92/'93 '93/'94 '94/'95 '95/'96
N
Hook-licence vessels Share of the cod catch
Figure 8 Number of hook-licence vessels and share of the cod catch, 1989-1996
Quality of the quota-property right
Economic theory suggests that the efficiency of an ITQ system stems from its creation of private property in harvesting rights (see, for example, Scott 1989; Arnason 1990, 1995b; Libecap 1989). This suggests that the higher the quality of this property right in terms of security of title, permanence, exclusivity, flexibility, di-visibility, and transferability, the greater will be the resulting effi-ciency of the ITQ system (see Scott 1988, 1989 for more details). Article 1 of the Fisheries Management Act of 1990 states that the fish stocks in Icelandic waters are the common property of the Icelandic people. It further states that the allocation of ITQs to in-dividual firms and vessels does not give irrevocable property rights to these TAC shares. The article has created uncertainty concerning the permanence and exclusivity of the ITQs and un-dermined its economic effectiveness.
The uncertainty and insecurity of the property rights in ITQs has also created problems for tax authorities and banks. The tax authorities are uncertain whether a vessel-quota should be re-garded as an asset on the firm’s books, or if expenditures on quo-tas should be regarded as outlays that are deductible from taxable income. When the tax authorities and the Ministry of Fi-nance could not agree on the rules, it was left for the courts to de-cide the matter. The courts have reached a decision, which can be described as a compromise of differing views. Transfers of annual quotas are to be treated as taxable income or outlays, while trans-fers of TAC shares are to be treated as assets and depreciated over 5 years. Allocated quotas, whether annual or TAC shares, are not subject to these tax rules and are to be treated as non-taxable.
The banks have been unsure whether a vessel quota should be regarded as part of the vessel’s equity (value) when a vessel is put up as collateral for a bank loan. The courts have ruled that quotas are not to be regarded as the property of a vessel owner, and are, therefore, not a legitimate collateral for loans. Vessel owners and banks have, of course, figured out ways to circumvent this rul-ing: for example, the bank will make a loan on condition that it must approve of any transfer of TAC shares.
fishery the property of TAC shareholders, but rather that they have a property (an asset) in harvesting rights.
Icelandic fishing of international and migratory stocks
Icelandic fishing vessels have sailed to far away international wa-ters to compensate for smaller quotas in domestic fisheries. Ves-sels have increased their effort in catching deep-sea redfish (which migrates from Greenland waters, through international waters, into Icelandic waters) and blueling just inside and out-side of the 200 mile exclusive zone. The catch in these stocks is about 45,000 MT in recent years.
The Icelandic government has participated in international ne-gotiations on several fronts recently. They negotiated with Nor-way and Greenland on the capelin stock, which migrates into their waters. They negotiated with Norway on the Norse herring stock, which migrates into Icelandic waters in the summer; Ice-landic vessels are allowed a catch of 190,000 MT in 1996. The Min-istry allocated IQs for that fishery to 67 vessels, 59 purse-seiners and 8 deep-sea trawlers.
They are also negotiating with Norway, Russia, Faeroe Islands and Poland on the deep-sea redfish, as these nations claim a his-tory of catch in that stock. Although these talks have not pro-duced sufficient results, the Ministry will issue ITQs based on catch history in that fishery in 1997. Negotiations with Canadian authorities have led to an agreement on the shrimp fishery on the Flemish Cap and, on the basis of this agreement, the Ministry has allocated ITQs to all Icelandic vessels with catch history on the Flemish Cap. They have also been on-and-off talks with Nor-way, Finland and Russia on demersal fishing in the Barents Sea. In 1995 the demersal catch of these Icelandic vessels in interna-tional waters was around 42,000 MT, of which 75 percent was cod and 20 percent shrimp.
Conclusion
conclu-sive. In the demersal fisheries the evidence is mixed. The fishing fleet has decreased only in the most recent years. Aggregate fish-ing effort decreased immediately after the introduction of the ITQs in 1984 only to increase again in 1986-1990. From 1992 on-wards there has, however, been a dramatic decrease in effort.
When interpreting the development of the demersal fisheries since 1984, one should bear in mind the imperfections of the ITQ system especially in the period 1985-1990. During that period there was widespread use of the effort quota option and the fish-eries management system was only partially an ITQ system in those years.
Despite increasing evidence on the favourable impact of the ITQ system, there is still a debate on its merits. The debate is fo-cused on three main issues: economic efficiency, equity, and re-gional implications.27 A fourth issue has been raised in this
discussion concerning the condition of the fish stocks. Although this issue is based on a misunderstanding of the ITQ system, it has been associated with it.
The evidence on the economic benefits of the ITQ system is be-coming clearer and the TAC for some species will be increased in the near future. The regional impact of the ITQs seems favour-able (see Runolfsson, this volume). All this should increase sup-port for the system and its continuation.
References
Arason, Ari (1995). Kvotabokin 95-96. Reykjavik: Skerpla. ——— (1996). Kvotabokin 96–97. Reykjavik: Skerpla.
Arnason, Ragnar (1990). Minimum Information Management in Fisher-ies. Canadian Journal of Economics 23: 630–53.
——— (1992a). Stjornun fiskveida I nokkrum londum heims. Greinargerd fyrir nefnd um motun sjavarutvegsstefnu (mimeograph). Reykjavik. ——— (1992b). Stjornkerfi fiskveida: Aflamark og byggdathroun. Greinargerd
fyrir nefnd um motun sjavarutvegsstefnu (mimeograph). Reykjavik. ——— (1993). The Icelandic Individual Transferable Quota System: A
Descriptive Account. Marine Resource Economics 8: 201–08.
Arnason, Ragnar (1994). On Catch Discarding in Fisheries. Marine Re-source Economics 9: 189-207.
——— (1995a). The Icelandic Fisheries: Evolution and Management of a Fish-ing Industry. Oxford: Fishing News Books.
——— (1995b). The ITQ Fisheries Management System: Advantages and Disadvantages. In S.T.F. Johansen (ed.), Nordiske Fiskerisamfund I Fremtiden (Kobenhave: Nord): 43–70.
——— (1996a). On the ITQ Fisheries Management System in Iceland.
Reviews in Fish Biology and Fisheries 6: 63–90.
——— (1996b). Property Rights as an Organizational Framework in Fisheries: The Case of Six Fishing Nations. In B.L. Crowley (ed.), Taking Ownership; Property Rights and Fishery Management on the At-lantic Coast (Halifax: Atlantic Institute for Market Studies): 99–144. Arnason, R., and B. Runolfsson (1991). Er kvotakerfid hagkvaemt?
Reykja-vik: Stofnun Jons Thorlakssonar.
Arnason, R., G. Palsson, and O. Jonsson (1992). Stjorn fiskveida og skipting fiskveidiardsins. Reykjavik: Sjarvautvegsstofnun og Haskoli Islands. Buchanan, James M. (1975). The Limits of Liberty. Chicago: University of
Chicago Press.
Bureau of Statistics (1991). Landshagir 1991, Statistical Abstract of Iceland. ——— (1996). Landshagir 1996, Statistical Yearbook of Iceland.
——— Hagtidindi. Vols. 1991–1996
Edwards, Steven F. (1994). Ownership of Renewable Ocean Resources.
Marine Resource Economics, 9: 253–73.
Fisheries Association of Iceland. Aegir. Vols. 1977–1996. ——— Utvegur. Vols. 1977–1994.
Gissurarson, Hannes H. (1990). Fiskistofnarnir vid Island: Thjodareign eda rikiseign? Reykjavik: Stofnun Jons Thorlakssonar.
Hannesson, Rognvaldur (1994). Trends in Fishery Management. In E.A. Loyayza (ed.), Managing Fishery Resources (World Bank Discussion Papers 217).
Hayek, Friedrich (1976). Law, Legislation and Liberty, Vol. 2. Chicago: Uni-versity of Chicago Press.
Johnson, Ronald (1995). Implications of Taxing Quota Value in an Indi-vidual Transferable Quota Fishery. Marine Resource Economics, 10: 327–40.
Libecap, Gary D. (1989). Contracting for Property Rights. Cambridge: Cam-bridge University Press
National Economic Institute (1996). Atvinnuvegaskýrsla 1993. Reykjavik: National Economic Institute.
——— (1997). Atvinnuvegaskýrsla 1994. Reykjavik: National Economic Institute.
Neher, P., R. Arnason, and N. Mollet, eds. (1989). Rights Based Fishing.
North, Douglass C. (1981). Structure and Change in Economic History. New York: WW Norton.
Organisation for Economic Cooperation and Development (1994).
OECD Economic Surveys: Iceland 1994. Paris: OECD.
Runolfsson, Birgir (1992). Skipulag fiskveida: Sereign, hagkvaemni og ardskopun. In R. Arnason, G. Palsson, and O. Jonsson, Stjorn fiskvei-da og skipting fiskveidiardsins (Reykjavik: Sjarvautvegsstofnun og Haskoli Islands): 31–52.
Scott, Anthony (1988). Development of Property in the Fishery. Marine Resource Economics, 5: 289–311.
——— (1989). Conceptual Origins of Rights Based Fishing. In P.A. Neher, R. Arnason and N. Mollett (eds.), Rights Based Fishing (Dordrecht: Kluwer): 11–38